Free Statistics

of Irreproducible Research!

Author's title

Author*Unverified author*
R Software Modulerwasp_exponentialsmoothing.wasp
Title produced by softwareExponential Smoothing
Date of computationSun, 24 Apr 2016 21:49:38 +0100
Cite this page as followsStatistical Computations at FreeStatistics.org, Office for Research Development and Education, URL https://freestatistics.org/blog/index.php?v=date/2016/Apr/24/t14615310749o8q23iqxgvlm94.htm/, Retrieved Tue, 30 Apr 2024 09:12:40 +0000
Statistical Computations at FreeStatistics.org, Office for Research Development and Education, URL https://freestatistics.org/blog/index.php?pk=294661, Retrieved Tue, 30 Apr 2024 09:12:40 +0000
QR Codes:

Original text written by user:
IsPrivate?No (this computation is public)
User-defined keywords
Estimated Impact123
Family? (F = Feedback message, R = changed R code, M = changed R Module, P = changed Parameters, D = changed Data)
-       [Exponential Smoothing] [Uitvoer België] [2016-04-24 20:49:38] [30ac29e28bcab64021946a7872e1db5d] [Current]
Feedback Forum

Post a new message
Dataseries X:
13566,7
13941,5
14964,1
14086
13505,1
15300,4
14725,2
12484,9
16082,6
15915,8
15916,1
15713
14746
15253,2
18384,3
16848,5
16485,5
19257,1
17093,4
15700,1
19124,3
18640,8
18439,2
17106,3
18347,7
19372,7
22263,8
19422,9
21268,6
20310
19256
17535,9
19857,4
19628,4
19727,5
18112,2
18889,3
20516,1
22317
19768,8
20015,8
20260,5
19434,3
17910
19134,4
20880,1
19680
17493,4
19087,8
19064,6
21191
20503,9
20364,1
19860,4
20924,1
17018,8
20607,4
21500,2
19868,3
18801,9
19787,5
19936,2
21047,6
21034,4
20132,8
20725,3
20827,8
16992,3
21818,2
21841,4
19252,2
17933,7


Summary of computational transaction
Raw Inputview raw input (R code)
Raw Outputview raw output of R engine
Computing time2 seconds
R Server'Sir Maurice George Kendall' @ kendall.wessa.net

\begin{tabular}{lllllllll}
\hline
Summary of computational transaction \tabularnewline
Raw Input & view raw input (R code)  \tabularnewline
Raw Output & view raw output of R engine  \tabularnewline
Computing time & 2 seconds \tabularnewline
R Server & 'Sir Maurice George Kendall' @ kendall.wessa.net \tabularnewline
\hline
\end{tabular}
%Source: https://freestatistics.org/blog/index.php?pk=294661&T=0

[TABLE]
[ROW][C]Summary of computational transaction[/C][/ROW]
[ROW][C]Raw Input[/C][C]view raw input (R code) [/C][/ROW]
[ROW][C]Raw Output[/C][C]view raw output of R engine [/C][/ROW]
[ROW][C]Computing time[/C][C]2 seconds[/C][/ROW]
[ROW][C]R Server[/C][C]'Sir Maurice George Kendall' @ kendall.wessa.net[/C][/ROW]
[/TABLE]
Source: https://freestatistics.org/blog/index.php?pk=294661&T=0

Globally Unique Identifier (entire table): ba.freestatistics.org/blog/index.php?pk=294661&T=0

As an alternative you can also use a QR Code:  

The GUIDs for individual cells are displayed in the table below:

Summary of computational transaction
Raw Inputview raw input (R code)
Raw Outputview raw output of R engine
Computing time2 seconds
R Server'Sir Maurice George Kendall' @ kendall.wessa.net


Estimated Parameters of Exponential Smoothing
ParameterValue
alpha0.130833151993687
beta0.428021655131703
gamma0.951642767295901

\begin{tabular}{lllllllll}
\hline
Estimated Parameters of Exponential Smoothing \tabularnewline
Parameter & Value \tabularnewline
alpha & 0.130833151993687 \tabularnewline
beta & 0.428021655131703 \tabularnewline
gamma & 0.951642767295901 \tabularnewline
\hline
\end{tabular}
%Source: https://freestatistics.org/blog/index.php?pk=294661&T=1

[TABLE]
[ROW][C]Estimated Parameters of Exponential Smoothing[/C][/ROW]
[ROW][C]Parameter[/C][C]Value[/C][/ROW]
[ROW][C]alpha[/C][C]0.130833151993687[/C][/ROW]
[ROW][C]beta[/C][C]0.428021655131703[/C][/ROW]
[ROW][C]gamma[/C][C]0.951642767295901[/C][/ROW]
[/TABLE]
Source: https://freestatistics.org/blog/index.php?pk=294661&T=1

Globally Unique Identifier (entire table): ba.freestatistics.org/blog/index.php?pk=294661&T=1

As an alternative you can also use a QR Code:  

The GUIDs for individual cells are displayed in the table below:

Estimated Parameters of Exponential Smoothing
ParameterValue
alpha0.130833151993687
beta0.428021655131703
gamma0.951642767295901


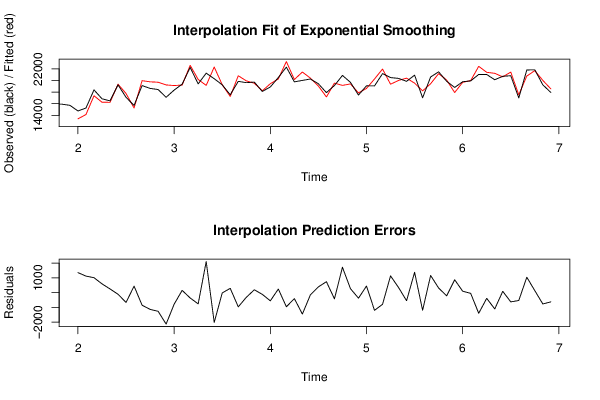
Interpolation Forecasts of Exponential Smoothing
tObservedFittedResiduals
131474613385.09079426531360.90920573473
1415253.214130.67535487111122.52464512887
1518384.317369.44676575371014.8532342463
1616848.516252.2773294968596.222670503226
1716485.516231.8912419382253.608758061819
1819257.119366.3301649169-109.230164916917
1917093.417757.4393902355-664.039390235459
2015700.115252.5255371902447.574462809816
2119124.319973.3453865573-849.0453865573
2218640.819773.9127473267-1133.11274732672
2318439.219703.0626052008-1263.86260520079
2417106.319235.1034605897-2128.80346058969
2518347.719130.5985315371-782.898531537077
2619372.719216.5983716804156.101628319575
2722263.822624.8983912445-361.098391244494
2819422.920182.7137836738-759.813783673821
2921268.619158.00214694032110.59785305974
302031022327.6335473872-2017.63354738722
311925619275.4800555894-19.4800555893598
3217535.917242.5732539801293.326746019924
3319857.420819.9480388566-962.548038856617
3419628.419946.9931735315-318.593173531499
3519727.519533.0593261321194.440673867946
3618112.218226.2282024374-114.028202437377
3718889.319442.6993855112-553.399385511166
3820516.120268.4553388931247.644661106948
392231723273.4435286264-956.443528626362
4019768.820173.6725753224-404.872575322377
4120015.821465.5826138391-1449.78261383909
4220260.520408.5487638897-148.048763889725
4319434.319041.1482763208393.151723679151
441791017164.8677268205745.132273179501
4519134.419556.1721361806-421.772136180571
4620880.119155.73852328021724.3614767198
471968019411.4034801909268.596519809067
4817493.417865.5278960438-372.127896043818
4919087.818637.4927582504450.307241749557
5019064.620264.485561776-1199.88556177601
512119121981.1618671714-790.161867171373
5220503.919364.62959702971139.27040297032
5320364.120016.0447644438348.055235556225
5419860.420408.1547845-547.754784499957
5520924.119543.16672494221380.93327505779
5617018.818211.5330463999-1192.73304639992
5720607.419442.21137397311165.18862602693
5821500.221186.596822183313.603177816985
5919868.320083.7142721425-215.414272142538
6018801.917925.9429004718875.957099528157
6119787.519687.1822178485100.317782151455
6219936.219983.1382866856-46.9382866855958
6321047.622447.4395317957-1399.83953179565
6421034.421417.3577655319-382.957765531944
6520132.821238.7208623127-1105.92086231275
6620725.320633.289252819392.0107471807314
6720827.821452.5700375462-624.770037546212
6816992.317523.3067222885-531.006722288472
6921818.220769.22166096721048.97833903283
7021841.421704.4865046077136.913495392295
7119252.220018.2673031087-766.067303108699
7217933.718557.6572464516-623.957246451639

\begin{tabular}{lllllllll}
\hline
Interpolation Forecasts of Exponential Smoothing \tabularnewline
t & Observed & Fitted & Residuals \tabularnewline
13 & 14746 & 13385.0907942653 & 1360.90920573473 \tabularnewline
14 & 15253.2 & 14130.6753548711 & 1122.52464512887 \tabularnewline
15 & 18384.3 & 17369.4467657537 & 1014.8532342463 \tabularnewline
16 & 16848.5 & 16252.2773294968 & 596.222670503226 \tabularnewline
17 & 16485.5 & 16231.8912419382 & 253.608758061819 \tabularnewline
18 & 19257.1 & 19366.3301649169 & -109.230164916917 \tabularnewline
19 & 17093.4 & 17757.4393902355 & -664.039390235459 \tabularnewline
20 & 15700.1 & 15252.5255371902 & 447.574462809816 \tabularnewline
21 & 19124.3 & 19973.3453865573 & -849.0453865573 \tabularnewline
22 & 18640.8 & 19773.9127473267 & -1133.11274732672 \tabularnewline
23 & 18439.2 & 19703.0626052008 & -1263.86260520079 \tabularnewline
24 & 17106.3 & 19235.1034605897 & -2128.80346058969 \tabularnewline
25 & 18347.7 & 19130.5985315371 & -782.898531537077 \tabularnewline
26 & 19372.7 & 19216.5983716804 & 156.101628319575 \tabularnewline
27 & 22263.8 & 22624.8983912445 & -361.098391244494 \tabularnewline
28 & 19422.9 & 20182.7137836738 & -759.813783673821 \tabularnewline
29 & 21268.6 & 19158.0021469403 & 2110.59785305974 \tabularnewline
30 & 20310 & 22327.6335473872 & -2017.63354738722 \tabularnewline
31 & 19256 & 19275.4800555894 & -19.4800555893598 \tabularnewline
32 & 17535.9 & 17242.5732539801 & 293.326746019924 \tabularnewline
33 & 19857.4 & 20819.9480388566 & -962.548038856617 \tabularnewline
34 & 19628.4 & 19946.9931735315 & -318.593173531499 \tabularnewline
35 & 19727.5 & 19533.0593261321 & 194.440673867946 \tabularnewline
36 & 18112.2 & 18226.2282024374 & -114.028202437377 \tabularnewline
37 & 18889.3 & 19442.6993855112 & -553.399385511166 \tabularnewline
38 & 20516.1 & 20268.4553388931 & 247.644661106948 \tabularnewline
39 & 22317 & 23273.4435286264 & -956.443528626362 \tabularnewline
40 & 19768.8 & 20173.6725753224 & -404.872575322377 \tabularnewline
41 & 20015.8 & 21465.5826138391 & -1449.78261383909 \tabularnewline
42 & 20260.5 & 20408.5487638897 & -148.048763889725 \tabularnewline
43 & 19434.3 & 19041.1482763208 & 393.151723679151 \tabularnewline
44 & 17910 & 17164.8677268205 & 745.132273179501 \tabularnewline
45 & 19134.4 & 19556.1721361806 & -421.772136180571 \tabularnewline
46 & 20880.1 & 19155.7385232802 & 1724.3614767198 \tabularnewline
47 & 19680 & 19411.4034801909 & 268.596519809067 \tabularnewline
48 & 17493.4 & 17865.5278960438 & -372.127896043818 \tabularnewline
49 & 19087.8 & 18637.4927582504 & 450.307241749557 \tabularnewline
50 & 19064.6 & 20264.485561776 & -1199.88556177601 \tabularnewline
51 & 21191 & 21981.1618671714 & -790.161867171373 \tabularnewline
52 & 20503.9 & 19364.6295970297 & 1139.27040297032 \tabularnewline
53 & 20364.1 & 20016.0447644438 & 348.055235556225 \tabularnewline
54 & 19860.4 & 20408.1547845 & -547.754784499957 \tabularnewline
55 & 20924.1 & 19543.1667249422 & 1380.93327505779 \tabularnewline
56 & 17018.8 & 18211.5330463999 & -1192.73304639992 \tabularnewline
57 & 20607.4 & 19442.2113739731 & 1165.18862602693 \tabularnewline
58 & 21500.2 & 21186.596822183 & 313.603177816985 \tabularnewline
59 & 19868.3 & 20083.7142721425 & -215.414272142538 \tabularnewline
60 & 18801.9 & 17925.9429004718 & 875.957099528157 \tabularnewline
61 & 19787.5 & 19687.1822178485 & 100.317782151455 \tabularnewline
62 & 19936.2 & 19983.1382866856 & -46.9382866855958 \tabularnewline
63 & 21047.6 & 22447.4395317957 & -1399.83953179565 \tabularnewline
64 & 21034.4 & 21417.3577655319 & -382.957765531944 \tabularnewline
65 & 20132.8 & 21238.7208623127 & -1105.92086231275 \tabularnewline
66 & 20725.3 & 20633.2892528193 & 92.0107471807314 \tabularnewline
67 & 20827.8 & 21452.5700375462 & -624.770037546212 \tabularnewline
68 & 16992.3 & 17523.3067222885 & -531.006722288472 \tabularnewline
69 & 21818.2 & 20769.2216609672 & 1048.97833903283 \tabularnewline
70 & 21841.4 & 21704.4865046077 & 136.913495392295 \tabularnewline
71 & 19252.2 & 20018.2673031087 & -766.067303108699 \tabularnewline
72 & 17933.7 & 18557.6572464516 & -623.957246451639 \tabularnewline
\hline
\end{tabular}
%Source: https://freestatistics.org/blog/index.php?pk=294661&T=2

[TABLE]
[ROW][C]Interpolation Forecasts of Exponential Smoothing[/C][/ROW]
[ROW][C]t[/C][C]Observed[/C][C]Fitted[/C][C]Residuals[/C][/ROW]
[ROW][C]13[/C][C]14746[/C][C]13385.0907942653[/C][C]1360.90920573473[/C][/ROW]
[ROW][C]14[/C][C]15253.2[/C][C]14130.6753548711[/C][C]1122.52464512887[/C][/ROW]
[ROW][C]15[/C][C]18384.3[/C][C]17369.4467657537[/C][C]1014.8532342463[/C][/ROW]
[ROW][C]16[/C][C]16848.5[/C][C]16252.2773294968[/C][C]596.222670503226[/C][/ROW]
[ROW][C]17[/C][C]16485.5[/C][C]16231.8912419382[/C][C]253.608758061819[/C][/ROW]
[ROW][C]18[/C][C]19257.1[/C][C]19366.3301649169[/C][C]-109.230164916917[/C][/ROW]
[ROW][C]19[/C][C]17093.4[/C][C]17757.4393902355[/C][C]-664.039390235459[/C][/ROW]
[ROW][C]20[/C][C]15700.1[/C][C]15252.5255371902[/C][C]447.574462809816[/C][/ROW]
[ROW][C]21[/C][C]19124.3[/C][C]19973.3453865573[/C][C]-849.0453865573[/C][/ROW]
[ROW][C]22[/C][C]18640.8[/C][C]19773.9127473267[/C][C]-1133.11274732672[/C][/ROW]
[ROW][C]23[/C][C]18439.2[/C][C]19703.0626052008[/C][C]-1263.86260520079[/C][/ROW]
[ROW][C]24[/C][C]17106.3[/C][C]19235.1034605897[/C][C]-2128.80346058969[/C][/ROW]
[ROW][C]25[/C][C]18347.7[/C][C]19130.5985315371[/C][C]-782.898531537077[/C][/ROW]
[ROW][C]26[/C][C]19372.7[/C][C]19216.5983716804[/C][C]156.101628319575[/C][/ROW]
[ROW][C]27[/C][C]22263.8[/C][C]22624.8983912445[/C][C]-361.098391244494[/C][/ROW]
[ROW][C]28[/C][C]19422.9[/C][C]20182.7137836738[/C][C]-759.813783673821[/C][/ROW]
[ROW][C]29[/C][C]21268.6[/C][C]19158.0021469403[/C][C]2110.59785305974[/C][/ROW]
[ROW][C]30[/C][C]20310[/C][C]22327.6335473872[/C][C]-2017.63354738722[/C][/ROW]
[ROW][C]31[/C][C]19256[/C][C]19275.4800555894[/C][C]-19.4800555893598[/C][/ROW]
[ROW][C]32[/C][C]17535.9[/C][C]17242.5732539801[/C][C]293.326746019924[/C][/ROW]
[ROW][C]33[/C][C]19857.4[/C][C]20819.9480388566[/C][C]-962.548038856617[/C][/ROW]
[ROW][C]34[/C][C]19628.4[/C][C]19946.9931735315[/C][C]-318.593173531499[/C][/ROW]
[ROW][C]35[/C][C]19727.5[/C][C]19533.0593261321[/C][C]194.440673867946[/C][/ROW]
[ROW][C]36[/C][C]18112.2[/C][C]18226.2282024374[/C][C]-114.028202437377[/C][/ROW]
[ROW][C]37[/C][C]18889.3[/C][C]19442.6993855112[/C][C]-553.399385511166[/C][/ROW]
[ROW][C]38[/C][C]20516.1[/C][C]20268.4553388931[/C][C]247.644661106948[/C][/ROW]
[ROW][C]39[/C][C]22317[/C][C]23273.4435286264[/C][C]-956.443528626362[/C][/ROW]
[ROW][C]40[/C][C]19768.8[/C][C]20173.6725753224[/C][C]-404.872575322377[/C][/ROW]
[ROW][C]41[/C][C]20015.8[/C][C]21465.5826138391[/C][C]-1449.78261383909[/C][/ROW]
[ROW][C]42[/C][C]20260.5[/C][C]20408.5487638897[/C][C]-148.048763889725[/C][/ROW]
[ROW][C]43[/C][C]19434.3[/C][C]19041.1482763208[/C][C]393.151723679151[/C][/ROW]
[ROW][C]44[/C][C]17910[/C][C]17164.8677268205[/C][C]745.132273179501[/C][/ROW]
[ROW][C]45[/C][C]19134.4[/C][C]19556.1721361806[/C][C]-421.772136180571[/C][/ROW]
[ROW][C]46[/C][C]20880.1[/C][C]19155.7385232802[/C][C]1724.3614767198[/C][/ROW]
[ROW][C]47[/C][C]19680[/C][C]19411.4034801909[/C][C]268.596519809067[/C][/ROW]
[ROW][C]48[/C][C]17493.4[/C][C]17865.5278960438[/C][C]-372.127896043818[/C][/ROW]
[ROW][C]49[/C][C]19087.8[/C][C]18637.4927582504[/C][C]450.307241749557[/C][/ROW]
[ROW][C]50[/C][C]19064.6[/C][C]20264.485561776[/C][C]-1199.88556177601[/C][/ROW]
[ROW][C]51[/C][C]21191[/C][C]21981.1618671714[/C][C]-790.161867171373[/C][/ROW]
[ROW][C]52[/C][C]20503.9[/C][C]19364.6295970297[/C][C]1139.27040297032[/C][/ROW]
[ROW][C]53[/C][C]20364.1[/C][C]20016.0447644438[/C][C]348.055235556225[/C][/ROW]
[ROW][C]54[/C][C]19860.4[/C][C]20408.1547845[/C][C]-547.754784499957[/C][/ROW]
[ROW][C]55[/C][C]20924.1[/C][C]19543.1667249422[/C][C]1380.93327505779[/C][/ROW]
[ROW][C]56[/C][C]17018.8[/C][C]18211.5330463999[/C][C]-1192.73304639992[/C][/ROW]
[ROW][C]57[/C][C]20607.4[/C][C]19442.2113739731[/C][C]1165.18862602693[/C][/ROW]
[ROW][C]58[/C][C]21500.2[/C][C]21186.596822183[/C][C]313.603177816985[/C][/ROW]
[ROW][C]59[/C][C]19868.3[/C][C]20083.7142721425[/C][C]-215.414272142538[/C][/ROW]
[ROW][C]60[/C][C]18801.9[/C][C]17925.9429004718[/C][C]875.957099528157[/C][/ROW]
[ROW][C]61[/C][C]19787.5[/C][C]19687.1822178485[/C][C]100.317782151455[/C][/ROW]
[ROW][C]62[/C][C]19936.2[/C][C]19983.1382866856[/C][C]-46.9382866855958[/C][/ROW]
[ROW][C]63[/C][C]21047.6[/C][C]22447.4395317957[/C][C]-1399.83953179565[/C][/ROW]
[ROW][C]64[/C][C]21034.4[/C][C]21417.3577655319[/C][C]-382.957765531944[/C][/ROW]
[ROW][C]65[/C][C]20132.8[/C][C]21238.7208623127[/C][C]-1105.92086231275[/C][/ROW]
[ROW][C]66[/C][C]20725.3[/C][C]20633.2892528193[/C][C]92.0107471807314[/C][/ROW]
[ROW][C]67[/C][C]20827.8[/C][C]21452.5700375462[/C][C]-624.770037546212[/C][/ROW]
[ROW][C]68[/C][C]16992.3[/C][C]17523.3067222885[/C][C]-531.006722288472[/C][/ROW]
[ROW][C]69[/C][C]21818.2[/C][C]20769.2216609672[/C][C]1048.97833903283[/C][/ROW]
[ROW][C]70[/C][C]21841.4[/C][C]21704.4865046077[/C][C]136.913495392295[/C][/ROW]
[ROW][C]71[/C][C]19252.2[/C][C]20018.2673031087[/C][C]-766.067303108699[/C][/ROW]
[ROW][C]72[/C][C]17933.7[/C][C]18557.6572464516[/C][C]-623.957246451639[/C][/ROW]
[/TABLE]
Source: https://freestatistics.org/blog/index.php?pk=294661&T=2

Globally Unique Identifier (entire table): ba.freestatistics.org/blog/index.php?pk=294661&T=2

As an alternative you can also use a QR Code:  

The GUIDs for individual cells are displayed in the table below:

Interpolation Forecasts of Exponential Smoothing
tObservedFittedResiduals
131474613385.09079426531360.90920573473
1415253.214130.67535487111122.52464512887
1518384.317369.44676575371014.8532342463
1616848.516252.2773294968596.222670503226
1716485.516231.8912419382253.608758061819
1819257.119366.3301649169-109.230164916917
1917093.417757.4393902355-664.039390235459
2015700.115252.5255371902447.574462809816
2119124.319973.3453865573-849.0453865573
2218640.819773.9127473267-1133.11274732672
2318439.219703.0626052008-1263.86260520079
2417106.319235.1034605897-2128.80346058969
2518347.719130.5985315371-782.898531537077
2619372.719216.5983716804156.101628319575
2722263.822624.8983912445-361.098391244494
2819422.920182.7137836738-759.813783673821
2921268.619158.00214694032110.59785305974
302031022327.6335473872-2017.63354738722
311925619275.4800555894-19.4800555893598
3217535.917242.5732539801293.326746019924
3319857.420819.9480388566-962.548038856617
3419628.419946.9931735315-318.593173531499
3519727.519533.0593261321194.440673867946
3618112.218226.2282024374-114.028202437377
3718889.319442.6993855112-553.399385511166
3820516.120268.4553388931247.644661106948
392231723273.4435286264-956.443528626362
4019768.820173.6725753224-404.872575322377
4120015.821465.5826138391-1449.78261383909
4220260.520408.5487638897-148.048763889725
4319434.319041.1482763208393.151723679151
441791017164.8677268205745.132273179501
4519134.419556.1721361806-421.772136180571
4620880.119155.73852328021724.3614767198
471968019411.4034801909268.596519809067
4817493.417865.5278960438-372.127896043818
4919087.818637.4927582504450.307241749557
5019064.620264.485561776-1199.88556177601
512119121981.1618671714-790.161867171373
5220503.919364.62959702971139.27040297032
5320364.120016.0447644438348.055235556225
5419860.420408.1547845-547.754784499957
5520924.119543.16672494221380.93327505779
5617018.818211.5330463999-1192.73304639992
5720607.419442.21137397311165.18862602693
5821500.221186.596822183313.603177816985
5919868.320083.7142721425-215.414272142538
6018801.917925.9429004718875.957099528157
6119787.519687.1822178485100.317782151455
6219936.219983.1382866856-46.9382866855958
6321047.622447.4395317957-1399.83953179565
6421034.421417.3577655319-382.957765531944
6520132.821238.7208623127-1105.92086231275
6620725.320633.289252819392.0107471807314
6720827.821452.5700375462-624.770037546212
6816992.317523.3067222885-531.006722288472
6921818.220769.22166096721048.97833903283
7021841.421704.4865046077136.913495392295
7119252.220018.2673031087-766.067303108699
7217933.718557.6572464516-623.957246451639


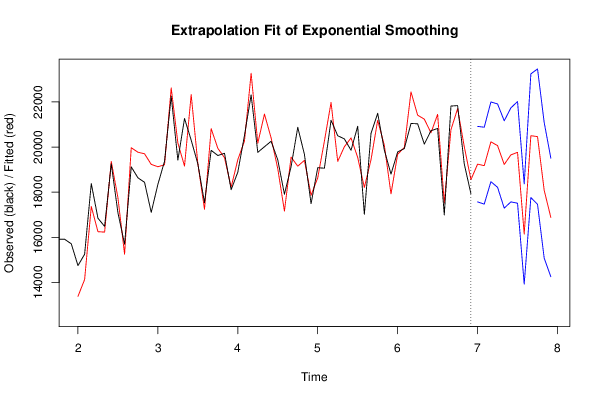
Extrapolation Forecasts of Exponential Smoothing
tForecast95% Lower Bound95% Upper Bound
7319245.336762798317572.096847320820918.5766782759
7419177.403425941817472.544074111620882.2627777719
7520234.13548507618467.100899953422001.1700701986
7620066.078440472118218.959554396921913.1973265472
7719231.457442684417295.904490593821167.0103947749
7819654.832829624217571.853555677721737.8121035707
7919768.543120106117514.862372152122022.2238680602
8016147.673103878213927.279717230318368.066490526
8120506.11572928317765.789591815923246.4418667501
8220465.690637928317466.591844113123464.7894317435
8318086.59274544615079.549832955321093.6356579367
8416881.373230535714254.272843421919508.4736176494

\begin{tabular}{lllllllll}
\hline
Extrapolation Forecasts of Exponential Smoothing \tabularnewline
t & Forecast & 95% Lower Bound & 95% Upper Bound \tabularnewline
73 & 19245.3367627983 & 17572.0968473208 & 20918.5766782759 \tabularnewline
74 & 19177.4034259418 & 17472.5440741116 & 20882.2627777719 \tabularnewline
75 & 20234.135485076 & 18467.1008999534 & 22001.1700701986 \tabularnewline
76 & 20066.0784404721 & 18218.9595543969 & 21913.1973265472 \tabularnewline
77 & 19231.4574426844 & 17295.9044905938 & 21167.0103947749 \tabularnewline
78 & 19654.8328296242 & 17571.8535556777 & 21737.8121035707 \tabularnewline
79 & 19768.5431201061 & 17514.8623721521 & 22022.2238680602 \tabularnewline
80 & 16147.6731038782 & 13927.2797172303 & 18368.066490526 \tabularnewline
81 & 20506.115729283 & 17765.7895918159 & 23246.4418667501 \tabularnewline
82 & 20465.6906379283 & 17466.5918441131 & 23464.7894317435 \tabularnewline
83 & 18086.592745446 & 15079.5498329553 & 21093.6356579367 \tabularnewline
84 & 16881.3732305357 & 14254.2728434219 & 19508.4736176494 \tabularnewline
\hline
\end{tabular}
%Source: https://freestatistics.org/blog/index.php?pk=294661&T=3

[TABLE]
[ROW][C]Extrapolation Forecasts of Exponential Smoothing[/C][/ROW]
[ROW][C]t[/C][C]Forecast[/C][C]95% Lower Bound[/C][C]95% Upper Bound[/C][/ROW]
[ROW][C]73[/C][C]19245.3367627983[/C][C]17572.0968473208[/C][C]20918.5766782759[/C][/ROW]
[ROW][C]74[/C][C]19177.4034259418[/C][C]17472.5440741116[/C][C]20882.2627777719[/C][/ROW]
[ROW][C]75[/C][C]20234.135485076[/C][C]18467.1008999534[/C][C]22001.1700701986[/C][/ROW]
[ROW][C]76[/C][C]20066.0784404721[/C][C]18218.9595543969[/C][C]21913.1973265472[/C][/ROW]
[ROW][C]77[/C][C]19231.4574426844[/C][C]17295.9044905938[/C][C]21167.0103947749[/C][/ROW]
[ROW][C]78[/C][C]19654.8328296242[/C][C]17571.8535556777[/C][C]21737.8121035707[/C][/ROW]
[ROW][C]79[/C][C]19768.5431201061[/C][C]17514.8623721521[/C][C]22022.2238680602[/C][/ROW]
[ROW][C]80[/C][C]16147.6731038782[/C][C]13927.2797172303[/C][C]18368.066490526[/C][/ROW]
[ROW][C]81[/C][C]20506.115729283[/C][C]17765.7895918159[/C][C]23246.4418667501[/C][/ROW]
[ROW][C]82[/C][C]20465.6906379283[/C][C]17466.5918441131[/C][C]23464.7894317435[/C][/ROW]
[ROW][C]83[/C][C]18086.592745446[/C][C]15079.5498329553[/C][C]21093.6356579367[/C][/ROW]
[ROW][C]84[/C][C]16881.3732305357[/C][C]14254.2728434219[/C][C]19508.4736176494[/C][/ROW]
[/TABLE]
Source: https://freestatistics.org/blog/index.php?pk=294661&T=3

Globally Unique Identifier (entire table): ba.freestatistics.org/blog/index.php?pk=294661&T=3

As an alternative you can also use a QR Code:  

The GUIDs for individual cells are displayed in the table below:

Extrapolation Forecasts of Exponential Smoothing
tForecast95% Lower Bound95% Upper Bound
7319245.336762798317572.096847320820918.5766782759
7419177.403425941817472.544074111620882.2627777719
7520234.13548507618467.100899953422001.1700701986
7620066.078440472118218.959554396921913.1973265472
7719231.457442684417295.904490593821167.0103947749
7819654.832829624217571.853555677721737.8121035707
7919768.543120106117514.862372152122022.2238680602
8016147.673103878213927.279717230318368.066490526
8120506.11572928317765.789591815923246.4418667501
8220465.690637928317466.591844113123464.7894317435
8318086.59274544615079.549832955321093.6356579367
8416881.373230535714254.272843421919508.4736176494


Parameters (Session):
par1 = 12 ; par2 = Triple ; par3 = multiplicative ;
Parameters (R input):
par1 = 12 ; par2 = Triple ; par3 = multiplicative ;
R code (references can be found in the software module):
par1 <- as.numeric(par1)
if (par2 == 'Single') K <- 1
if (par2 == 'Double') K <- 2
if (par2 == 'Triple') K <- par1
nx <- length(x)
nxmK <- nx - K
x <- ts(x, frequency = par1)
if (par2 == 'Single') fit <- HoltWinters(x, gamma=F, beta=F)
if (par2 == 'Double') fit <- HoltWinters(x, gamma=F)
if (par2 == 'Triple') fit <- HoltWinters(x, seasonal=par3)
fit
myresid <- x - fit$fitted[,'xhat']
bitmap(file='test1.png')
op <- par(mfrow=c(2,1))
plot(fit,ylab='Observed (black) / Fitted (red)',main='Interpolation Fit of Exponential Smoothing')
plot(myresid,ylab='Residuals',main='Interpolation Prediction Errors')
par(op)
dev.off()
bitmap(file='test2.png')
p <- predict(fit, par1, prediction.interval=TRUE)
np <- length(p[,1])
plot(fit,p,ylab='Observed (black) / Fitted (red)',main='Extrapolation Fit of Exponential Smoothing')
dev.off()
bitmap(file='test3.png')
op <- par(mfrow = c(2,2))
acf(as.numeric(myresid),lag.max = nx/2,main='Residual ACF')
spectrum(myresid,main='Residals Periodogram')
cpgram(myresid,main='Residal Cumulative Periodogram')
qqnorm(myresid,main='Residual Normal QQ Plot')
qqline(myresid)
par(op)
dev.off()
load(file='createtable')
a<-table.start()
a<-table.row.start(a)
a<-table.element(a,'Estimated Parameters of Exponential Smoothing',2,TRUE)
a<-table.row.end(a)
a<-table.row.start(a)
a<-table.element(a,'Parameter',header=TRUE)
a<-table.element(a,'Value',header=TRUE)
a<-table.row.end(a)
a<-table.row.start(a)
a<-table.element(a,'alpha',header=TRUE)
a<-table.element(a,fit$alpha)
a<-table.row.end(a)
a<-table.row.start(a)
a<-table.element(a,'beta',header=TRUE)
a<-table.element(a,fit$beta)
a<-table.row.end(a)
a<-table.row.start(a)
a<-table.element(a,'gamma',header=TRUE)
a<-table.element(a,fit$gamma)
a<-table.row.end(a)
a<-table.end(a)
table.save(a,file='mytable.tab')
a<-table.start()
a<-table.row.start(a)
a<-table.element(a,'Interpolation Forecasts of Exponential Smoothing',4,TRUE)
a<-table.row.end(a)
a<-table.row.start(a)
a<-table.element(a,'t',header=TRUE)
a<-table.element(a,'Observed',header=TRUE)
a<-table.element(a,'Fitted',header=TRUE)
a<-table.element(a,'Residuals',header=TRUE)
a<-table.row.end(a)
for (i in 1:nxmK) {
a<-table.row.start(a)
a<-table.element(a,i+K,header=TRUE)
a<-table.element(a,x[i+K])
a<-table.element(a,fit$fitted[i,'xhat'])
a<-table.element(a,myresid[i])
a<-table.row.end(a)
}
a<-table.end(a)
table.save(a,file='mytable1.tab')
a<-table.start()
a<-table.row.start(a)
a<-table.element(a,'Extrapolation Forecasts of Exponential Smoothing',4,TRUE)
a<-table.row.end(a)
a<-table.row.start(a)
a<-table.element(a,'t',header=TRUE)
a<-table.element(a,'Forecast',header=TRUE)
a<-table.element(a,'95% Lower Bound',header=TRUE)
a<-table.element(a,'95% Upper Bound',header=TRUE)
a<-table.row.end(a)
for (i in 1:np) {
a<-table.row.start(a)
a<-table.element(a,nx+i,header=TRUE)
a<-table.element(a,p[i,'fit'])
a<-table.element(a,p[i,'lwr'])
a<-table.element(a,p[i,'upr'])
a<-table.row.end(a)
}
a<-table.end(a)
table.save(a,file='mytable2.tab')