Free Statistics

of Irreproducible Research!

Author's title

Author*Unverified author*
R Software Modulerwasp_autocorrelation.wasp
Title produced by software(Partial) Autocorrelation Function
Date of computationMon, 01 Aug 2016 13:22:01 +0100
Cite this page as followsStatistical Computations at FreeStatistics.org, Office for Research Development and Education, URL https://freestatistics.org/blog/index.php?v=date/2016/Aug/01/t14700541497kmm70z4qaayzvs.htm/, Retrieved Mon, 29 Apr 2024 15:09:47 +0000
Statistical Computations at FreeStatistics.org, Office for Research Development and Education, URL https://freestatistics.org/blog/index.php?pk=295991, Retrieved Mon, 29 Apr 2024 15:09:47 +0000
QR Codes:

Original text written by user:
IsPrivate?No (this computation is public)
User-defined keywords
Estimated Impact139
Family? (F = Feedback message, R = changed R code, M = changed R Module, P = changed Parameters, D = changed Data)
-       [(Partial) Autocorrelation Function] [] [2016-08-01 12:22:01] [b94c13d84d922b33c8d74b1e5b1d38c1] [Current]
Feedback Forum

Post a new message
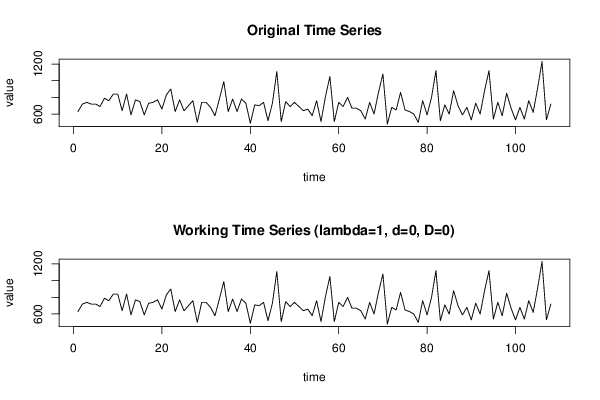
Dataseries X:
630
720
740
720
720
690
790
760
840
840
640
840
590
770
750
590
730
740
770
660
830
900
630
770
640
700
760
500
740
740
680
580
780
990
630
780
630
780
730
490
710
700
740
520
730
1110
510
750
690
740
690
640
660
580
760
510
810
1050
510
740
690
800
670
670
640
540
740
600
860
1080
480
680
650
860
650
630
600
500
760
590
800
1120
520
710
600
880
700
590
680
530
730
600
880
1120
540
740
580
850
670
530
680
540
760
620
910
1230
530
720


Summary of computational transaction
Raw Inputview raw input (R code)
Raw Outputview raw output of R engine
Computing time2 seconds
R Server'Herman Ole Andreas Wold' @ wold.wessa.net

\begin{tabular}{lllllllll}
\hline
Summary of computational transaction \tabularnewline
Raw Input & view raw input (R code)  \tabularnewline
Raw Output & view raw output of R engine  \tabularnewline
Computing time & 2 seconds \tabularnewline
R Server & 'Herman Ole Andreas Wold' @ wold.wessa.net \tabularnewline
\hline
\end{tabular}
%Source: https://freestatistics.org/blog/index.php?pk=295991&T=0

[TABLE]
[ROW][C]Summary of computational transaction[/C][/ROW]
[ROW][C]Raw Input[/C][C]view raw input (R code) [/C][/ROW]
[ROW][C]Raw Output[/C][C]view raw output of R engine [/C][/ROW]
[ROW][C]Computing time[/C][C]2 seconds[/C][/ROW]
[ROW][C]R Server[/C][C]'Herman Ole Andreas Wold' @ wold.wessa.net[/C][/ROW]
[/TABLE]
Source: https://freestatistics.org/blog/index.php?pk=295991&T=0

Globally Unique Identifier (entire table): ba.freestatistics.org/blog/index.php?pk=295991&T=0

As an alternative you can also use a QR Code:  

The GUIDs for individual cells are displayed in the table below:

Summary of computational transaction
Raw Inputview raw input (R code)
Raw Outputview raw output of R engine
Computing time2 seconds
R Server'Herman Ole Andreas Wold' @ wold.wessa.net


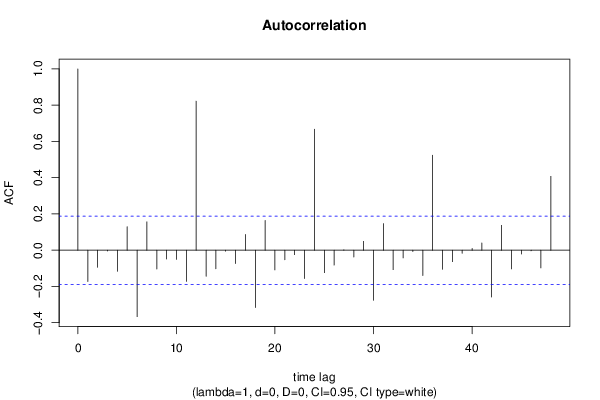
Autocorrelation Function
Time lag kACF(k)T-STATP-value
1-0.172619-1.79390.037813
2-0.093779-0.97460.165974
3-0.004754-0.04940.480344
4-0.116459-1.21030.114408
50.1299051.350.089918
6-0.366392-3.80770.000117
70.1563211.62450.053588
8-0.103608-1.07670.142002
9-0.048798-0.50710.306549
10-0.050326-0.5230.301022
11-0.171827-1.78570.038479
120.8223468.54610
13-0.143628-1.49260.069225
14-0.102554-1.06580.144452
15-0.005171-0.05370.478623
16-0.073241-0.76110.224114
170.0867840.90190.184562
18-0.316311-3.28720.000683
190.1639321.70360.045663
20-0.108496-1.12750.131009
21-0.052374-0.54430.293683
22-0.024293-0.25250.400584
23-0.155774-1.61890.054198
240.6672396.93420
25-0.123746-1.2860.100596
26-0.082038-0.85260.197893
270.0021050.02190.491292
28-0.03751-0.38980.348719
290.0487770.50690.306629
30-0.275781-2.8660.002499
310.1467061.52460.06514
32-0.107173-1.11380.133925
33-0.042258-0.43920.330713
34-0.007006-0.07280.471045
35-0.139004-1.44460.075737
360.5238055.44350
37-0.105214-1.09340.138322
38-0.06274-0.6520.257887
39-0.016762-0.17420.431019
400.0091560.09520.462184
410.0402240.4180.338383
42-0.257864-2.67980.00426
430.1370061.42380.078692
44-0.102756-1.06790.143979
45-0.020466-0.21270.415986
46-0.003436-0.03570.485789
47-0.097564-1.01390.156444
480.4073754.23362.4e-05

\begin{tabular}{lllllllll}
\hline
Autocorrelation Function \tabularnewline
Time lag k & ACF(k) & T-STAT & P-value \tabularnewline
1 & -0.172619 & -1.7939 & 0.037813 \tabularnewline
2 & -0.093779 & -0.9746 & 0.165974 \tabularnewline
3 & -0.004754 & -0.0494 & 0.480344 \tabularnewline
4 & -0.116459 & -1.2103 & 0.114408 \tabularnewline
5 & 0.129905 & 1.35 & 0.089918 \tabularnewline
6 & -0.366392 & -3.8077 & 0.000117 \tabularnewline
7 & 0.156321 & 1.6245 & 0.053588 \tabularnewline
8 & -0.103608 & -1.0767 & 0.142002 \tabularnewline
9 & -0.048798 & -0.5071 & 0.306549 \tabularnewline
10 & -0.050326 & -0.523 & 0.301022 \tabularnewline
11 & -0.171827 & -1.7857 & 0.038479 \tabularnewline
12 & 0.822346 & 8.5461 & 0 \tabularnewline
13 & -0.143628 & -1.4926 & 0.069225 \tabularnewline
14 & -0.102554 & -1.0658 & 0.144452 \tabularnewline
15 & -0.005171 & -0.0537 & 0.478623 \tabularnewline
16 & -0.073241 & -0.7611 & 0.224114 \tabularnewline
17 & 0.086784 & 0.9019 & 0.184562 \tabularnewline
18 & -0.316311 & -3.2872 & 0.000683 \tabularnewline
19 & 0.163932 & 1.7036 & 0.045663 \tabularnewline
20 & -0.108496 & -1.1275 & 0.131009 \tabularnewline
21 & -0.052374 & -0.5443 & 0.293683 \tabularnewline
22 & -0.024293 & -0.2525 & 0.400584 \tabularnewline
23 & -0.155774 & -1.6189 & 0.054198 \tabularnewline
24 & 0.667239 & 6.9342 & 0 \tabularnewline
25 & -0.123746 & -1.286 & 0.100596 \tabularnewline
26 & -0.082038 & -0.8526 & 0.197893 \tabularnewline
27 & 0.002105 & 0.0219 & 0.491292 \tabularnewline
28 & -0.03751 & -0.3898 & 0.348719 \tabularnewline
29 & 0.048777 & 0.5069 & 0.306629 \tabularnewline
30 & -0.275781 & -2.866 & 0.002499 \tabularnewline
31 & 0.146706 & 1.5246 & 0.06514 \tabularnewline
32 & -0.107173 & -1.1138 & 0.133925 \tabularnewline
33 & -0.042258 & -0.4392 & 0.330713 \tabularnewline
34 & -0.007006 & -0.0728 & 0.471045 \tabularnewline
35 & -0.139004 & -1.4446 & 0.075737 \tabularnewline
36 & 0.523805 & 5.4435 & 0 \tabularnewline
37 & -0.105214 & -1.0934 & 0.138322 \tabularnewline
38 & -0.06274 & -0.652 & 0.257887 \tabularnewline
39 & -0.016762 & -0.1742 & 0.431019 \tabularnewline
40 & 0.009156 & 0.0952 & 0.462184 \tabularnewline
41 & 0.040224 & 0.418 & 0.338383 \tabularnewline
42 & -0.257864 & -2.6798 & 0.00426 \tabularnewline
43 & 0.137006 & 1.4238 & 0.078692 \tabularnewline
44 & -0.102756 & -1.0679 & 0.143979 \tabularnewline
45 & -0.020466 & -0.2127 & 0.415986 \tabularnewline
46 & -0.003436 & -0.0357 & 0.485789 \tabularnewline
47 & -0.097564 & -1.0139 & 0.156444 \tabularnewline
48 & 0.407375 & 4.2336 & 2.4e-05 \tabularnewline
\hline
\end{tabular}
%Source: https://freestatistics.org/blog/index.php?pk=295991&T=1

[TABLE]
[ROW][C]Autocorrelation Function[/C][/ROW]
[ROW][C]Time lag k[/C][C]ACF(k)[/C][C]T-STAT[/C][C]P-value[/C][/ROW]
[ROW][C]1[/C][C]-0.172619[/C][C]-1.7939[/C][C]0.037813[/C][/ROW]
[ROW][C]2[/C][C]-0.093779[/C][C]-0.9746[/C][C]0.165974[/C][/ROW]
[ROW][C]3[/C][C]-0.004754[/C][C]-0.0494[/C][C]0.480344[/C][/ROW]
[ROW][C]4[/C][C]-0.116459[/C][C]-1.2103[/C][C]0.114408[/C][/ROW]
[ROW][C]5[/C][C]0.129905[/C][C]1.35[/C][C]0.089918[/C][/ROW]
[ROW][C]6[/C][C]-0.366392[/C][C]-3.8077[/C][C]0.000117[/C][/ROW]
[ROW][C]7[/C][C]0.156321[/C][C]1.6245[/C][C]0.053588[/C][/ROW]
[ROW][C]8[/C][C]-0.103608[/C][C]-1.0767[/C][C]0.142002[/C][/ROW]
[ROW][C]9[/C][C]-0.048798[/C][C]-0.5071[/C][C]0.306549[/C][/ROW]
[ROW][C]10[/C][C]-0.050326[/C][C]-0.523[/C][C]0.301022[/C][/ROW]
[ROW][C]11[/C][C]-0.171827[/C][C]-1.7857[/C][C]0.038479[/C][/ROW]
[ROW][C]12[/C][C]0.822346[/C][C]8.5461[/C][C]0[/C][/ROW]
[ROW][C]13[/C][C]-0.143628[/C][C]-1.4926[/C][C]0.069225[/C][/ROW]
[ROW][C]14[/C][C]-0.102554[/C][C]-1.0658[/C][C]0.144452[/C][/ROW]
[ROW][C]15[/C][C]-0.005171[/C][C]-0.0537[/C][C]0.478623[/C][/ROW]
[ROW][C]16[/C][C]-0.073241[/C][C]-0.7611[/C][C]0.224114[/C][/ROW]
[ROW][C]17[/C][C]0.086784[/C][C]0.9019[/C][C]0.184562[/C][/ROW]
[ROW][C]18[/C][C]-0.316311[/C][C]-3.2872[/C][C]0.000683[/C][/ROW]
[ROW][C]19[/C][C]0.163932[/C][C]1.7036[/C][C]0.045663[/C][/ROW]
[ROW][C]20[/C][C]-0.108496[/C][C]-1.1275[/C][C]0.131009[/C][/ROW]
[ROW][C]21[/C][C]-0.052374[/C][C]-0.5443[/C][C]0.293683[/C][/ROW]
[ROW][C]22[/C][C]-0.024293[/C][C]-0.2525[/C][C]0.400584[/C][/ROW]
[ROW][C]23[/C][C]-0.155774[/C][C]-1.6189[/C][C]0.054198[/C][/ROW]
[ROW][C]24[/C][C]0.667239[/C][C]6.9342[/C][C]0[/C][/ROW]
[ROW][C]25[/C][C]-0.123746[/C][C]-1.286[/C][C]0.100596[/C][/ROW]
[ROW][C]26[/C][C]-0.082038[/C][C]-0.8526[/C][C]0.197893[/C][/ROW]
[ROW][C]27[/C][C]0.002105[/C][C]0.0219[/C][C]0.491292[/C][/ROW]
[ROW][C]28[/C][C]-0.03751[/C][C]-0.3898[/C][C]0.348719[/C][/ROW]
[ROW][C]29[/C][C]0.048777[/C][C]0.5069[/C][C]0.306629[/C][/ROW]
[ROW][C]30[/C][C]-0.275781[/C][C]-2.866[/C][C]0.002499[/C][/ROW]
[ROW][C]31[/C][C]0.146706[/C][C]1.5246[/C][C]0.06514[/C][/ROW]
[ROW][C]32[/C][C]-0.107173[/C][C]-1.1138[/C][C]0.133925[/C][/ROW]
[ROW][C]33[/C][C]-0.042258[/C][C]-0.4392[/C][C]0.330713[/C][/ROW]
[ROW][C]34[/C][C]-0.007006[/C][C]-0.0728[/C][C]0.471045[/C][/ROW]
[ROW][C]35[/C][C]-0.139004[/C][C]-1.4446[/C][C]0.075737[/C][/ROW]
[ROW][C]36[/C][C]0.523805[/C][C]5.4435[/C][C]0[/C][/ROW]
[ROW][C]37[/C][C]-0.105214[/C][C]-1.0934[/C][C]0.138322[/C][/ROW]
[ROW][C]38[/C][C]-0.06274[/C][C]-0.652[/C][C]0.257887[/C][/ROW]
[ROW][C]39[/C][C]-0.016762[/C][C]-0.1742[/C][C]0.431019[/C][/ROW]
[ROW][C]40[/C][C]0.009156[/C][C]0.0952[/C][C]0.462184[/C][/ROW]
[ROW][C]41[/C][C]0.040224[/C][C]0.418[/C][C]0.338383[/C][/ROW]
[ROW][C]42[/C][C]-0.257864[/C][C]-2.6798[/C][C]0.00426[/C][/ROW]
[ROW][C]43[/C][C]0.137006[/C][C]1.4238[/C][C]0.078692[/C][/ROW]
[ROW][C]44[/C][C]-0.102756[/C][C]-1.0679[/C][C]0.143979[/C][/ROW]
[ROW][C]45[/C][C]-0.020466[/C][C]-0.2127[/C][C]0.415986[/C][/ROW]
[ROW][C]46[/C][C]-0.003436[/C][C]-0.0357[/C][C]0.485789[/C][/ROW]
[ROW][C]47[/C][C]-0.097564[/C][C]-1.0139[/C][C]0.156444[/C][/ROW]
[ROW][C]48[/C][C]0.407375[/C][C]4.2336[/C][C]2.4e-05[/C][/ROW]
[/TABLE]
Source: https://freestatistics.org/blog/index.php?pk=295991&T=1

Globally Unique Identifier (entire table): ba.freestatistics.org/blog/index.php?pk=295991&T=1

As an alternative you can also use a QR Code:  

The GUIDs for individual cells are displayed in the table below:

Autocorrelation Function
Time lag kACF(k)T-STATP-value
1-0.172619-1.79390.037813
2-0.093779-0.97460.165974
3-0.004754-0.04940.480344
4-0.116459-1.21030.114408
50.1299051.350.089918
6-0.366392-3.80770.000117
70.1563211.62450.053588
8-0.103608-1.07670.142002
9-0.048798-0.50710.306549
10-0.050326-0.5230.301022
11-0.171827-1.78570.038479
120.8223468.54610
13-0.143628-1.49260.069225
14-0.102554-1.06580.144452
15-0.005171-0.05370.478623
16-0.073241-0.76110.224114
170.0867840.90190.184562
18-0.316311-3.28720.000683
190.1639321.70360.045663
20-0.108496-1.12750.131009
21-0.052374-0.54430.293683
22-0.024293-0.25250.400584
23-0.155774-1.61890.054198
240.6672396.93420
25-0.123746-1.2860.100596
26-0.082038-0.85260.197893
270.0021050.02190.491292
28-0.03751-0.38980.348719
290.0487770.50690.306629
30-0.275781-2.8660.002499
310.1467061.52460.06514
32-0.107173-1.11380.133925
33-0.042258-0.43920.330713
34-0.007006-0.07280.471045
35-0.139004-1.44460.075737
360.5238055.44350
37-0.105214-1.09340.138322
38-0.06274-0.6520.257887
39-0.016762-0.17420.431019
400.0091560.09520.462184
410.0402240.4180.338383
42-0.257864-2.67980.00426
430.1370061.42380.078692
44-0.102756-1.06790.143979
45-0.020466-0.21270.415986
46-0.003436-0.03570.485789
47-0.097564-1.01390.156444
480.4073754.23362.4e-05


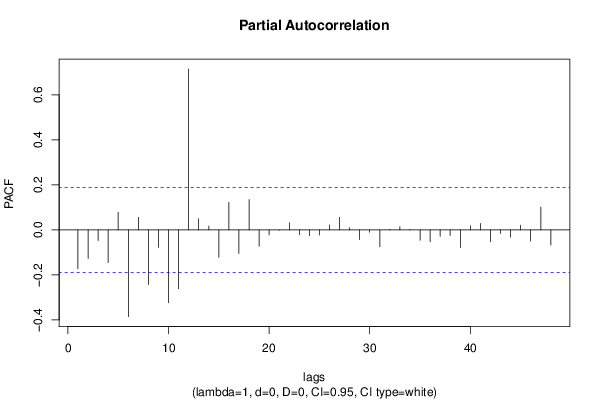
Partial Autocorrelation Function
Time lag kPACF(k)T-STATP-value
1-0.172619-1.79390.037813
2-0.127371-1.32370.094202
3-0.047137-0.48990.312613
4-0.145278-1.50980.067011
50.0780590.81120.209514
6-0.385694-4.00825.6e-05
70.0556910.57880.28198
8-0.243016-2.52550.006503
9-0.077748-0.8080.210438
10-0.324043-3.36760.000526
11-0.261654-2.71920.003814
120.7157577.43840
130.0496710.51620.303387
140.0176750.18370.427302
15-0.121954-1.26740.103872
160.1223841.27180.103079
17-0.104259-1.08350.140501
180.1347031.39990.082208
19-0.072726-0.75580.225711
20-0.022114-0.22980.409334
21-0.001267-0.01320.494759
220.0317230.32970.371143
23-0.021407-0.22250.412185
24-0.02571-0.26720.394918
25-0.022439-0.23320.408025
260.0221690.23040.409114
270.0564930.58710.279185
280.0100970.10490.458311
29-0.04297-0.44660.328043
30-0.010724-0.11140.455735
31-0.074663-0.77590.219746
320.0025650.02670.48939
330.0145790.15150.439928
34-0.000687-0.00710.497157
35-0.045842-0.47640.317376
36-0.052981-0.55060.291523
37-0.028373-0.29490.384334
38-0.0245-0.25460.399754
39-0.077953-0.81010.209828
400.0183710.19090.424474
410.0285620.29680.383587
42-0.052829-0.5490.292063
43-0.016117-0.16750.433647
44-0.03211-0.33370.369628
450.0210740.2190.41353
46-0.049754-0.51710.303087
470.1013081.05280.147386
48-0.067627-0.70280.241846

\begin{tabular}{lllllllll}
\hline
Partial Autocorrelation Function \tabularnewline
Time lag k & PACF(k) & T-STAT & P-value \tabularnewline
1 & -0.172619 & -1.7939 & 0.037813 \tabularnewline
2 & -0.127371 & -1.3237 & 0.094202 \tabularnewline
3 & -0.047137 & -0.4899 & 0.312613 \tabularnewline
4 & -0.145278 & -1.5098 & 0.067011 \tabularnewline
5 & 0.078059 & 0.8112 & 0.209514 \tabularnewline
6 & -0.385694 & -4.0082 & 5.6e-05 \tabularnewline
7 & 0.055691 & 0.5788 & 0.28198 \tabularnewline
8 & -0.243016 & -2.5255 & 0.006503 \tabularnewline
9 & -0.077748 & -0.808 & 0.210438 \tabularnewline
10 & -0.324043 & -3.3676 & 0.000526 \tabularnewline
11 & -0.261654 & -2.7192 & 0.003814 \tabularnewline
12 & 0.715757 & 7.4384 & 0 \tabularnewline
13 & 0.049671 & 0.5162 & 0.303387 \tabularnewline
14 & 0.017675 & 0.1837 & 0.427302 \tabularnewline
15 & -0.121954 & -1.2674 & 0.103872 \tabularnewline
16 & 0.122384 & 1.2718 & 0.103079 \tabularnewline
17 & -0.104259 & -1.0835 & 0.140501 \tabularnewline
18 & 0.134703 & 1.3999 & 0.082208 \tabularnewline
19 & -0.072726 & -0.7558 & 0.225711 \tabularnewline
20 & -0.022114 & -0.2298 & 0.409334 \tabularnewline
21 & -0.001267 & -0.0132 & 0.494759 \tabularnewline
22 & 0.031723 & 0.3297 & 0.371143 \tabularnewline
23 & -0.021407 & -0.2225 & 0.412185 \tabularnewline
24 & -0.02571 & -0.2672 & 0.394918 \tabularnewline
25 & -0.022439 & -0.2332 & 0.408025 \tabularnewline
26 & 0.022169 & 0.2304 & 0.409114 \tabularnewline
27 & 0.056493 & 0.5871 & 0.279185 \tabularnewline
28 & 0.010097 & 0.1049 & 0.458311 \tabularnewline
29 & -0.04297 & -0.4466 & 0.328043 \tabularnewline
30 & -0.010724 & -0.1114 & 0.455735 \tabularnewline
31 & -0.074663 & -0.7759 & 0.219746 \tabularnewline
32 & 0.002565 & 0.0267 & 0.48939 \tabularnewline
33 & 0.014579 & 0.1515 & 0.439928 \tabularnewline
34 & -0.000687 & -0.0071 & 0.497157 \tabularnewline
35 & -0.045842 & -0.4764 & 0.317376 \tabularnewline
36 & -0.052981 & -0.5506 & 0.291523 \tabularnewline
37 & -0.028373 & -0.2949 & 0.384334 \tabularnewline
38 & -0.0245 & -0.2546 & 0.399754 \tabularnewline
39 & -0.077953 & -0.8101 & 0.209828 \tabularnewline
40 & 0.018371 & 0.1909 & 0.424474 \tabularnewline
41 & 0.028562 & 0.2968 & 0.383587 \tabularnewline
42 & -0.052829 & -0.549 & 0.292063 \tabularnewline
43 & -0.016117 & -0.1675 & 0.433647 \tabularnewline
44 & -0.03211 & -0.3337 & 0.369628 \tabularnewline
45 & 0.021074 & 0.219 & 0.41353 \tabularnewline
46 & -0.049754 & -0.5171 & 0.303087 \tabularnewline
47 & 0.101308 & 1.0528 & 0.147386 \tabularnewline
48 & -0.067627 & -0.7028 & 0.241846 \tabularnewline
\hline
\end{tabular}
%Source: https://freestatistics.org/blog/index.php?pk=295991&T=2

[TABLE]
[ROW][C]Partial Autocorrelation Function[/C][/ROW]
[ROW][C]Time lag k[/C][C]PACF(k)[/C][C]T-STAT[/C][C]P-value[/C][/ROW]
[ROW][C]1[/C][C]-0.172619[/C][C]-1.7939[/C][C]0.037813[/C][/ROW]
[ROW][C]2[/C][C]-0.127371[/C][C]-1.3237[/C][C]0.094202[/C][/ROW]
[ROW][C]3[/C][C]-0.047137[/C][C]-0.4899[/C][C]0.312613[/C][/ROW]
[ROW][C]4[/C][C]-0.145278[/C][C]-1.5098[/C][C]0.067011[/C][/ROW]
[ROW][C]5[/C][C]0.078059[/C][C]0.8112[/C][C]0.209514[/C][/ROW]
[ROW][C]6[/C][C]-0.385694[/C][C]-4.0082[/C][C]5.6e-05[/C][/ROW]
[ROW][C]7[/C][C]0.055691[/C][C]0.5788[/C][C]0.28198[/C][/ROW]
[ROW][C]8[/C][C]-0.243016[/C][C]-2.5255[/C][C]0.006503[/C][/ROW]
[ROW][C]9[/C][C]-0.077748[/C][C]-0.808[/C][C]0.210438[/C][/ROW]
[ROW][C]10[/C][C]-0.324043[/C][C]-3.3676[/C][C]0.000526[/C][/ROW]
[ROW][C]11[/C][C]-0.261654[/C][C]-2.7192[/C][C]0.003814[/C][/ROW]
[ROW][C]12[/C][C]0.715757[/C][C]7.4384[/C][C]0[/C][/ROW]
[ROW][C]13[/C][C]0.049671[/C][C]0.5162[/C][C]0.303387[/C][/ROW]
[ROW][C]14[/C][C]0.017675[/C][C]0.1837[/C][C]0.427302[/C][/ROW]
[ROW][C]15[/C][C]-0.121954[/C][C]-1.2674[/C][C]0.103872[/C][/ROW]
[ROW][C]16[/C][C]0.122384[/C][C]1.2718[/C][C]0.103079[/C][/ROW]
[ROW][C]17[/C][C]-0.104259[/C][C]-1.0835[/C][C]0.140501[/C][/ROW]
[ROW][C]18[/C][C]0.134703[/C][C]1.3999[/C][C]0.082208[/C][/ROW]
[ROW][C]19[/C][C]-0.072726[/C][C]-0.7558[/C][C]0.225711[/C][/ROW]
[ROW][C]20[/C][C]-0.022114[/C][C]-0.2298[/C][C]0.409334[/C][/ROW]
[ROW][C]21[/C][C]-0.001267[/C][C]-0.0132[/C][C]0.494759[/C][/ROW]
[ROW][C]22[/C][C]0.031723[/C][C]0.3297[/C][C]0.371143[/C][/ROW]
[ROW][C]23[/C][C]-0.021407[/C][C]-0.2225[/C][C]0.412185[/C][/ROW]
[ROW][C]24[/C][C]-0.02571[/C][C]-0.2672[/C][C]0.394918[/C][/ROW]
[ROW][C]25[/C][C]-0.022439[/C][C]-0.2332[/C][C]0.408025[/C][/ROW]
[ROW][C]26[/C][C]0.022169[/C][C]0.2304[/C][C]0.409114[/C][/ROW]
[ROW][C]27[/C][C]0.056493[/C][C]0.5871[/C][C]0.279185[/C][/ROW]
[ROW][C]28[/C][C]0.010097[/C][C]0.1049[/C][C]0.458311[/C][/ROW]
[ROW][C]29[/C][C]-0.04297[/C][C]-0.4466[/C][C]0.328043[/C][/ROW]
[ROW][C]30[/C][C]-0.010724[/C][C]-0.1114[/C][C]0.455735[/C][/ROW]
[ROW][C]31[/C][C]-0.074663[/C][C]-0.7759[/C][C]0.219746[/C][/ROW]
[ROW][C]32[/C][C]0.002565[/C][C]0.0267[/C][C]0.48939[/C][/ROW]
[ROW][C]33[/C][C]0.014579[/C][C]0.1515[/C][C]0.439928[/C][/ROW]
[ROW][C]34[/C][C]-0.000687[/C][C]-0.0071[/C][C]0.497157[/C][/ROW]
[ROW][C]35[/C][C]-0.045842[/C][C]-0.4764[/C][C]0.317376[/C][/ROW]
[ROW][C]36[/C][C]-0.052981[/C][C]-0.5506[/C][C]0.291523[/C][/ROW]
[ROW][C]37[/C][C]-0.028373[/C][C]-0.2949[/C][C]0.384334[/C][/ROW]
[ROW][C]38[/C][C]-0.0245[/C][C]-0.2546[/C][C]0.399754[/C][/ROW]
[ROW][C]39[/C][C]-0.077953[/C][C]-0.8101[/C][C]0.209828[/C][/ROW]
[ROW][C]40[/C][C]0.018371[/C][C]0.1909[/C][C]0.424474[/C][/ROW]
[ROW][C]41[/C][C]0.028562[/C][C]0.2968[/C][C]0.383587[/C][/ROW]
[ROW][C]42[/C][C]-0.052829[/C][C]-0.549[/C][C]0.292063[/C][/ROW]
[ROW][C]43[/C][C]-0.016117[/C][C]-0.1675[/C][C]0.433647[/C][/ROW]
[ROW][C]44[/C][C]-0.03211[/C][C]-0.3337[/C][C]0.369628[/C][/ROW]
[ROW][C]45[/C][C]0.021074[/C][C]0.219[/C][C]0.41353[/C][/ROW]
[ROW][C]46[/C][C]-0.049754[/C][C]-0.5171[/C][C]0.303087[/C][/ROW]
[ROW][C]47[/C][C]0.101308[/C][C]1.0528[/C][C]0.147386[/C][/ROW]
[ROW][C]48[/C][C]-0.067627[/C][C]-0.7028[/C][C]0.241846[/C][/ROW]
[/TABLE]
Source: https://freestatistics.org/blog/index.php?pk=295991&T=2

Globally Unique Identifier (entire table): ba.freestatistics.org/blog/index.php?pk=295991&T=2

As an alternative you can also use a QR Code:  

The GUIDs for individual cells are displayed in the table below:

Partial Autocorrelation Function
Time lag kPACF(k)T-STATP-value
1-0.172619-1.79390.037813
2-0.127371-1.32370.094202
3-0.047137-0.48990.312613
4-0.145278-1.50980.067011
50.0780590.81120.209514
6-0.385694-4.00825.6e-05
70.0556910.57880.28198
8-0.243016-2.52550.006503
9-0.077748-0.8080.210438
10-0.324043-3.36760.000526
11-0.261654-2.71920.003814
120.7157577.43840
130.0496710.51620.303387
140.0176750.18370.427302
15-0.121954-1.26740.103872
160.1223841.27180.103079
17-0.104259-1.08350.140501
180.1347031.39990.082208
19-0.072726-0.75580.225711
20-0.022114-0.22980.409334
21-0.001267-0.01320.494759
220.0317230.32970.371143
23-0.021407-0.22250.412185
24-0.02571-0.26720.394918
25-0.022439-0.23320.408025
260.0221690.23040.409114
270.0564930.58710.279185
280.0100970.10490.458311
29-0.04297-0.44660.328043
30-0.010724-0.11140.455735
31-0.074663-0.77590.219746
320.0025650.02670.48939
330.0145790.15150.439928
34-0.000687-0.00710.497157
35-0.045842-0.47640.317376
36-0.052981-0.55060.291523
37-0.028373-0.29490.384334
38-0.0245-0.25460.399754
39-0.077953-0.81010.209828
400.0183710.19090.424474
410.0285620.29680.383587
42-0.052829-0.5490.292063
43-0.016117-0.16750.433647
44-0.03211-0.33370.369628
450.0210740.2190.41353
46-0.049754-0.51710.303087
470.1013081.05280.147386
48-0.067627-0.70280.241846


Parameters (Session):
par1 = 48 ; par2 = 1 ; par3 = 0 ; par4 = 0 ; par5 = 12 ; par6 = White Noise ; par7 = 0.95 ;
Parameters (R input):
par1 = 48 ; par2 = 1 ; par3 = 0 ; par4 = 0 ; par5 = 12 ; par6 = White Noise ; par7 = 0.95 ; par8 = ;
R code (references can be found in the software module):
par8 <- ''
par7 <- '0.95'
par6 <- 'White Noise'
par5 <- '12'
par4 <- '0'
par3 <- '0'
par2 <- '1'
par1 <- 'Default'
if (par1 == 'Default') {
par1 = 10*log10(length(x))
} else {
par1 <- as.numeric(par1)
}
par2 <- as.numeric(par2)
par3 <- as.numeric(par3)
par4 <- as.numeric(par4)
par5 <- as.numeric(par5)
if (par6 == 'White Noise') par6 <- 'white' else par6 <- 'ma'
par7 <- as.numeric(par7)
if (par8 != '') par8 <- as.numeric(par8)
x <- na.omit(x)
ox <- x
if (par8 == '') {
if (par2 == 0) {
x <- log(x)
} else {
x <- (x ^ par2 - 1) / par2
}
} else {
x <- log(x,base=par8)
}
if (par3 > 0) x <- diff(x,lag=1,difference=par3)
if (par4 > 0) x <- diff(x,lag=par5,difference=par4)
bitmap(file='picts.png')
op <- par(mfrow=c(2,1))
plot(ox,type='l',main='Original Time Series',xlab='time',ylab='value')
if (par8=='') {
mytitle <- paste('Working Time Series (lambda=',par2,', d=',par3,', D=',par4,')',sep='')
mysub <- paste('(lambda=',par2,', d=',par3,', D=',par4,', CI=', par7, ', CI type=',par6,')',sep='')
} else {
mytitle <- paste('Working Time Series (base=',par8,', d=',par3,', D=',par4,')',sep='')
mysub <- paste('(base=',par8,', d=',par3,', D=',par4,', CI=', par7, ', CI type=',par6,')',sep='')
}
plot(x,type='l', main=mytitle,xlab='time',ylab='value')
par(op)
dev.off()
bitmap(file='pic1.png')
racf <- acf(x, par1, main='Autocorrelation', xlab='time lag', ylab='ACF', ci.type=par6, ci=par7, sub=mysub)
dev.off()
bitmap(file='pic2.png')
rpacf <- pacf(x,par1,main='Partial Autocorrelation',xlab='lags',ylab='PACF',sub=mysub)
dev.off()
(myacf <- c(racf$acf))
(mypacf <- c(rpacf$acf))
lengthx <- length(x)
sqrtn <- sqrt(lengthx)
load(file='createtable')
a<-table.start()
a<-table.row.start(a)
a<-table.element(a,'Autocorrelation Function',4,TRUE)
a<-table.row.end(a)
a<-table.row.start(a)
a<-table.element(a,'Time lag k',header=TRUE)
a<-table.element(a,hyperlink('basics.htm','ACF(k)','click here for more information about the Autocorrelation Function'),header=TRUE)
a<-table.element(a,'T-STAT',header=TRUE)
a<-table.element(a,'P-value',header=TRUE)
a<-table.row.end(a)
for (i in 2:(par1+1)) {
a<-table.row.start(a)
a<-table.element(a,i-1,header=TRUE)
a<-table.element(a,round(myacf[i],6))
mytstat <- myacf[i]*sqrtn
a<-table.element(a,round(mytstat,4))
a<-table.element(a,round(1-pt(abs(mytstat),lengthx),6))
a<-table.row.end(a)
}
a<-table.end(a)
table.save(a,file='mytable.tab')
a<-table.start()
a<-table.row.start(a)
a<-table.element(a,'Partial Autocorrelation Function',4,TRUE)
a<-table.row.end(a)
a<-table.row.start(a)
a<-table.element(a,'Time lag k',header=TRUE)
a<-table.element(a,hyperlink('basics.htm','PACF(k)','click here for more information about the Partial Autocorrelation Function'),header=TRUE)
a<-table.element(a,'T-STAT',header=TRUE)
a<-table.element(a,'P-value',header=TRUE)
a<-table.row.end(a)
for (i in 1:par1) {
a<-table.row.start(a)
a<-table.element(a,i,header=TRUE)
a<-table.element(a,round(mypacf[i],6))
mytstat <- mypacf[i]*sqrtn
a<-table.element(a,round(mytstat,4))
a<-table.element(a,round(1-pt(abs(mytstat),lengthx),6))
a<-table.row.end(a)
}
a<-table.end(a)
table.save(a,file='mytable1.tab')