Free Statistics

of Irreproducible Research!

Author's title

Author*Unverified author*
R Software Modulerwasp_smp.wasp
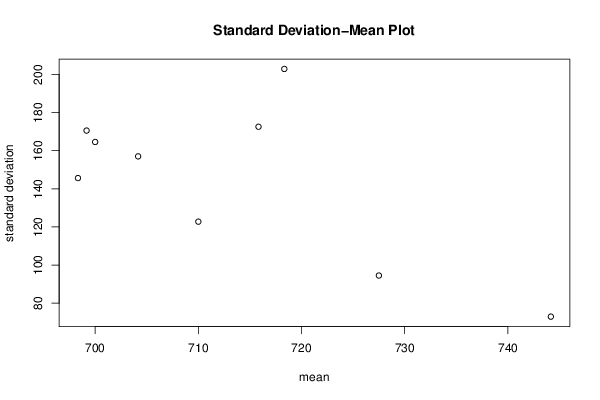
Title produced by softwareStandard Deviation-Mean Plot
Date of computationMon, 01 Aug 2016 13:34:50 +0100
Cite this page as followsStatistical Computations at FreeStatistics.org, Office for Research Development and Education, URL https://freestatistics.org/blog/index.php?v=date/2016/Aug/01/t147005496010urqgoz3fss4dp.htm/, Retrieved Mon, 29 Apr 2024 08:20:09 +0000
Statistical Computations at FreeStatistics.org, Office for Research Development and Education, URL https://freestatistics.org/blog/index.php?pk=295993, Retrieved Mon, 29 Apr 2024 08:20:09 +0000
QR Codes:

Original text written by user:
IsPrivate?No (this computation is public)
User-defined keywords
Estimated Impact162
Family? (F = Feedback message, R = changed R code, M = changed R Module, P = changed Parameters, D = changed Data)
-       [Standard Deviation-Mean Plot] [] [2016-08-01 12:34:50] [b94c13d84d922b33c8d74b1e5b1d38c1] [Current]
Feedback Forum

Post a new message
Dataseries X:
630
720
740
720
720
690
790
760
840
840
640
840
590
770
750
590
730
740
770
660
830
900
630
770
640
700
760
500
740
740
680
580
780
990
630
780
630
780
730
490
710
700
740
520
730
1110
510
750
690
740
690
640
660
580
760
510
810
1050
510
740
690
800
670
670
640
540
740
600
860
1080
480
680
650
860
650
630
600
500
760
590
800
1120
520
710
600
880
700
590
680
530
730
600
880
1120
540
740
580
850
670
530
680
540
760
620
910
1230
530
720


Summary of computational transaction
Raw Inputview raw input (R code)
Raw Outputview raw output of R engine
Computing time1 seconds
R Server'Gwilym Jenkins' @ jenkins.wessa.net

\begin{tabular}{lllllllll}
\hline
Summary of computational transaction \tabularnewline
Raw Input & view raw input (R code)  \tabularnewline
Raw Output & view raw output of R engine  \tabularnewline
Computing time & 1 seconds \tabularnewline
R Server & 'Gwilym Jenkins' @ jenkins.wessa.net \tabularnewline
\hline
\end{tabular}
%Source: https://freestatistics.org/blog/index.php?pk=295993&T=0

[TABLE]
[ROW][C]Summary of computational transaction[/C][/ROW]
[ROW][C]Raw Input[/C][C]view raw input (R code) [/C][/ROW]
[ROW][C]Raw Output[/C][C]view raw output of R engine [/C][/ROW]
[ROW][C]Computing time[/C][C]1 seconds[/C][/ROW]
[ROW][C]R Server[/C][C]'Gwilym Jenkins' @ jenkins.wessa.net[/C][/ROW]
[/TABLE]
Source: https://freestatistics.org/blog/index.php?pk=295993&T=0

Globally Unique Identifier (entire table): ba.freestatistics.org/blog/index.php?pk=295993&T=0

As an alternative you can also use a QR Code:  

The GUIDs for individual cells are displayed in the table below:

Summary of computational transaction
Raw Inputview raw input (R code)
Raw Outputview raw output of R engine
Computing time1 seconds
R Server'Gwilym Jenkins' @ jenkins.wessa.net


Standard Deviation-Mean Plot
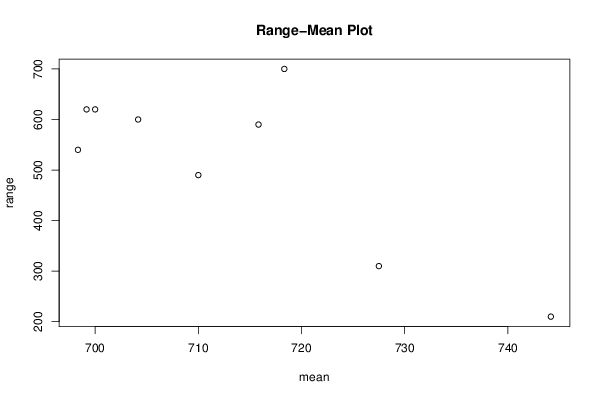
SectionMeanStandard DeviationRange
1744.16666666666772.9206708857251210
2727.594.4962721727448310
3710122.77103596829490
4700164.593162345552620
5698.333333333333145.654219009102540
6704.166666666667157.044193741376600
7699.166666666667170.585000583997620
8715.833333333333172.598237288657590
9718.333333333333202.925572264286700

\begin{tabular}{lllllllll}
\hline
Standard Deviation-Mean Plot \tabularnewline
Section & Mean & Standard Deviation & Range \tabularnewline
1 & 744.166666666667 & 72.9206708857251 & 210 \tabularnewline
2 & 727.5 & 94.4962721727448 & 310 \tabularnewline
3 & 710 & 122.77103596829 & 490 \tabularnewline
4 & 700 & 164.593162345552 & 620 \tabularnewline
5 & 698.333333333333 & 145.654219009102 & 540 \tabularnewline
6 & 704.166666666667 & 157.044193741376 & 600 \tabularnewline
7 & 699.166666666667 & 170.585000583997 & 620 \tabularnewline
8 & 715.833333333333 & 172.598237288657 & 590 \tabularnewline
9 & 718.333333333333 & 202.925572264286 & 700 \tabularnewline
\hline
\end{tabular}
%Source: https://freestatistics.org/blog/index.php?pk=295993&T=1

[TABLE]
[ROW][C]Standard Deviation-Mean Plot[/C][/ROW]
[ROW][C]Section[/C][C]Mean[/C][C]Standard Deviation[/C][C]Range[/C][/ROW]
[ROW][C]1[/C][C]744.166666666667[/C][C]72.9206708857251[/C][C]210[/C][/ROW]
[ROW][C]2[/C][C]727.5[/C][C]94.4962721727448[/C][C]310[/C][/ROW]
[ROW][C]3[/C][C]710[/C][C]122.77103596829[/C][C]490[/C][/ROW]
[ROW][C]4[/C][C]700[/C][C]164.593162345552[/C][C]620[/C][/ROW]
[ROW][C]5[/C][C]698.333333333333[/C][C]145.654219009102[/C][C]540[/C][/ROW]
[ROW][C]6[/C][C]704.166666666667[/C][C]157.044193741376[/C][C]600[/C][/ROW]
[ROW][C]7[/C][C]699.166666666667[/C][C]170.585000583997[/C][C]620[/C][/ROW]
[ROW][C]8[/C][C]715.833333333333[/C][C]172.598237288657[/C][C]590[/C][/ROW]
[ROW][C]9[/C][C]718.333333333333[/C][C]202.925572264286[/C][C]700[/C][/ROW]
[/TABLE]
Source: https://freestatistics.org/blog/index.php?pk=295993&T=1

Globally Unique Identifier (entire table): ba.freestatistics.org/blog/index.php?pk=295993&T=1

As an alternative you can also use a QR Code:  

The GUIDs for individual cells are displayed in the table below:

Standard Deviation-Mean Plot
SectionMeanStandard DeviationRange
1744.16666666666772.9206708857251210
2727.594.4962721727448310
3710122.77103596829490
4700164.593162345552620
5698.333333333333145.654219009102540
6704.166666666667157.044193741376600
7699.166666666667170.585000583997620
8715.833333333333172.598237288657590
9718.333333333333202.925572264286700


Regression: S.E.(k) = alpha + beta * Mean(k)
alpha1376.96611105585
beta-1.72794805379711
S.D.0.775952127687301
T-STAT-2.22687456112428
p-value0.061252704981263

\begin{tabular}{lllllllll}
\hline
Regression: S.E.(k) = alpha + beta * Mean(k) \tabularnewline
alpha & 1376.96611105585 \tabularnewline
beta & -1.72794805379711 \tabularnewline
S.D. & 0.775952127687301 \tabularnewline
T-STAT & -2.22687456112428 \tabularnewline
p-value & 0.061252704981263 \tabularnewline
\hline
\end{tabular}
%Source: https://freestatistics.org/blog/index.php?pk=295993&T=2

[TABLE]
[ROW][C]Regression: S.E.(k) = alpha + beta * Mean(k)[/C][/ROW]
[ROW][C]alpha[/C][C]1376.96611105585[/C][/ROW]
[ROW][C]beta[/C][C]-1.72794805379711[/C][/ROW]
[ROW][C]S.D.[/C][C]0.775952127687301[/C][/ROW]
[ROW][C]T-STAT[/C][C]-2.22687456112428[/C][/ROW]
[ROW][C]p-value[/C][C]0.061252704981263[/C][/ROW]
[/TABLE]
Source: https://freestatistics.org/blog/index.php?pk=295993&T=2

Globally Unique Identifier (entire table): ba.freestatistics.org/blog/index.php?pk=295993&T=2

As an alternative you can also use a QR Code:  

The GUIDs for individual cells are displayed in the table below:

Regression: S.E.(k) = alpha + beta * Mean(k)
alpha1376.96611105585
beta-1.72794805379711
S.D.0.775952127687301
T-STAT-2.22687456112428
p-value0.061252704981263


Regression: ln S.E.(k) = alpha + beta * ln Mean(k)
alpha78.6500407167264
beta-11.2214248064541
S.D.3.9671205225793
T-STAT-2.82860698145826
p-value0.025456994548278
Lambda12.2214248064541

\begin{tabular}{lllllllll}
\hline
Regression: ln S.E.(k) = alpha + beta * ln Mean(k) \tabularnewline
alpha & 78.6500407167264 \tabularnewline
beta & -11.2214248064541 \tabularnewline
S.D. & 3.9671205225793 \tabularnewline
T-STAT & -2.82860698145826 \tabularnewline
p-value & 0.025456994548278 \tabularnewline
Lambda & 12.2214248064541 \tabularnewline
\hline
\end{tabular}
%Source: https://freestatistics.org/blog/index.php?pk=295993&T=3

[TABLE]
[ROW][C]Regression: ln S.E.(k) = alpha + beta * ln Mean(k)[/C][/ROW]
[ROW][C]alpha[/C][C]78.6500407167264[/C][/ROW]
[ROW][C]beta[/C][C]-11.2214248064541[/C][/ROW]
[ROW][C]S.D.[/C][C]3.9671205225793[/C][/ROW]
[ROW][C]T-STAT[/C][C]-2.82860698145826[/C][/ROW]
[ROW][C]p-value[/C][C]0.025456994548278[/C][/ROW]
[ROW][C]Lambda[/C][C]12.2214248064541[/C][/ROW]
[/TABLE]
Source: https://freestatistics.org/blog/index.php?pk=295993&T=3

Globally Unique Identifier (entire table): ba.freestatistics.org/blog/index.php?pk=295993&T=3

As an alternative you can also use a QR Code:  

The GUIDs for individual cells are displayed in the table below:

Regression: ln S.E.(k) = alpha + beta * ln Mean(k)
alpha78.6500407167264
beta-11.2214248064541
S.D.3.9671205225793
T-STAT-2.82860698145826
p-value0.025456994548278
Lambda12.2214248064541


Parameters (Session):
par1 = 12 ;
Parameters (R input):
par1 = 12 ;
R code (references can be found in the software module):
par1 <- as.numeric(par1)
(n <- length(x))
(np <- floor(n / par1))
arr <- array(NA,dim=c(par1,np))
j <- 0
k <- 1
for (i in 1:(np*par1))
{
j = j + 1
arr[j,k] <- x[i]
if (j == par1) {
j = 0
k=k+1
}
}
arr
arr.mean <- array(NA,dim=np)
arr.sd <- array(NA,dim=np)
arr.range <- array(NA,dim=np)
for (j in 1:np)
{
arr.mean[j] <- mean(arr[,j],na.rm=TRUE)
arr.sd[j] <- sd(arr[,j],na.rm=TRUE)
arr.range[j] <- max(arr[,j],na.rm=TRUE) - min(arr[,j],na.rm=TRUE)
}
arr.mean
arr.sd
arr.range
(lm1 <- lm(arr.sd~arr.mean))
(lnlm1 <- lm(log(arr.sd)~log(arr.mean)))
(lm2 <- lm(arr.range~arr.mean))
bitmap(file='test1.png')
plot(arr.mean,arr.sd,main='Standard Deviation-Mean Plot',xlab='mean',ylab='standard deviation')
dev.off()
bitmap(file='test2.png')
plot(arr.mean,arr.range,main='Range-Mean Plot',xlab='mean',ylab='range')
dev.off()
load(file='createtable')
a<-table.start()
a<-table.row.start(a)
a<-table.element(a,'Standard Deviation-Mean Plot',4,TRUE)
a<-table.row.end(a)
a<-table.row.start(a)
a<-table.element(a,'Section',header=TRUE)
a<-table.element(a,'Mean',header=TRUE)
a<-table.element(a,'Standard Deviation',header=TRUE)
a<-table.element(a,'Range',header=TRUE)
a<-table.row.end(a)
for (j in 1:np) {
a<-table.row.start(a)
a<-table.element(a,j,header=TRUE)
a<-table.element(a,arr.mean[j])
a<-table.element(a,arr.sd[j] )
a<-table.element(a,arr.range[j] )
a<-table.row.end(a)
}
a<-table.end(a)
table.save(a,file='mytable.tab')
a<-table.start()
a<-table.row.start(a)
a<-table.element(a,'Regression: S.E.(k) = alpha + beta * Mean(k)',2,TRUE)
a<-table.row.end(a)
a<-table.row.start(a)
a<-table.element(a,'alpha',header=TRUE)
a<-table.element(a,lm1$coefficients[[1]])
a<-table.row.end(a)
a<-table.row.start(a)
a<-table.element(a,'beta',header=TRUE)
a<-table.element(a,lm1$coefficients[[2]])
a<-table.row.end(a)
a<-table.row.start(a)
a<-table.element(a,'S.D.',header=TRUE)
a<-table.element(a,summary(lm1)$coefficients[2,2])
a<-table.row.end(a)
a<-table.row.start(a)
a<-table.element(a,'T-STAT',header=TRUE)
a<-table.element(a,summary(lm1)$coefficients[2,3])
a<-table.row.end(a)
a<-table.row.start(a)
a<-table.element(a,'p-value',header=TRUE)
a<-table.element(a,summary(lm1)$coefficients[2,4])
a<-table.row.end(a)
a<-table.end(a)
table.save(a,file='mytable1.tab')
a<-table.start()
a<-table.row.start(a)
a<-table.element(a,'Regression: ln S.E.(k) = alpha + beta * ln Mean(k)',2,TRUE)
a<-table.row.end(a)
a<-table.row.start(a)
a<-table.element(a,'alpha',header=TRUE)
a<-table.element(a,lnlm1$coefficients[[1]])
a<-table.row.end(a)
a<-table.row.start(a)
a<-table.element(a,'beta',header=TRUE)
a<-table.element(a,lnlm1$coefficients[[2]])
a<-table.row.end(a)
a<-table.row.start(a)
a<-table.element(a,'S.D.',header=TRUE)
a<-table.element(a,summary(lnlm1)$coefficients[2,2])
a<-table.row.end(a)
a<-table.row.start(a)
a<-table.element(a,'T-STAT',header=TRUE)
a<-table.element(a,summary(lnlm1)$coefficients[2,3])
a<-table.row.end(a)
a<-table.row.start(a)
a<-table.element(a,'p-value',header=TRUE)
a<-table.element(a,summary(lnlm1)$coefficients[2,4])
a<-table.row.end(a)
a<-table.row.start(a)
a<-table.element(a,'Lambda',header=TRUE)
a<-table.element(a,1-lnlm1$coefficients[[2]])
a<-table.row.end(a)
a<-table.end(a)
table.save(a,file='mytable2.tab')