Free Statistics

of Irreproducible Research!

Author's title

Author*Unverified author*
R Software Modulerwasp_sdplot.wasp
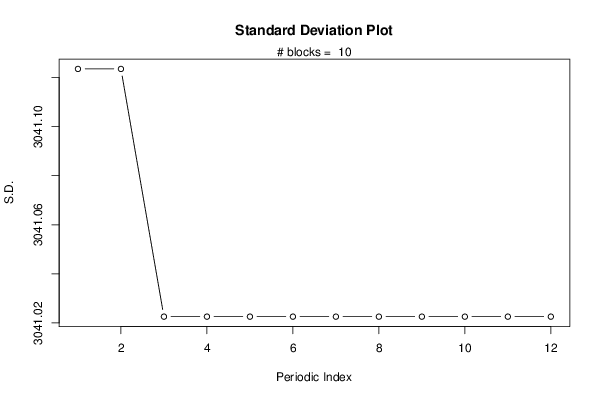
Title produced by softwareStandard Deviation Plot
Date of computationFri, 05 Aug 2016 17:01:45 +0100
Cite this page as followsStatistical Computations at FreeStatistics.org, Office for Research Development and Education, URL https://freestatistics.org/blog/index.php?v=date/2016/Aug/05/t1470413691e8dxnmi8y25ww9z.htm/, Retrieved Mon, 06 May 2024 12:18:59 +0000
Statistical Computations at FreeStatistics.org, Office for Research Development and Education, URL https://freestatistics.org/blog/index.php?pk=296035, Retrieved Mon, 06 May 2024 12:18:59 +0000
QR Codes:

Original text written by user:
IsPrivate?No (this computation is public)
User-defined keywords
Estimated Impact181
Family? (F = Feedback message, R = changed R code, M = changed R Module, P = changed Parameters, D = changed Data)
-       [Standard Deviation Plot] [spreidingsgrafieken] [2016-08-05 16:01:45] [e98d32ae432942f69cb1b3451eac7d8c] [Current]
Feedback Forum

Post a new message
Dataseries X:
 106 474.50 
 106 559.75 
 106 636.75 
 106 722.00 
 106 804.50 
 106 889.75 
 106 972.25 
 107 057.50 
 107 142.75 
 107 225.25 
 107 310.50 
 107 393.00 
 107 478.25 
 107 563.50 
 107 640.50 
 107 725.75 
 107 808.25 
 107 893.50 
 107 976.00 
 108 061.25 
 108 146.50 
 108 229.00 
 108 314.25 
 108 396.75 
 108 482.00 
 108 567.25 
 108 647.00 
 108 732.25 
 108 814.75 
 108 900.00 
 108 982.50 
 109 067.75 
 109 153.00 
 109 235.50 
 109 320.75 
 109 403.25 
 109 488.50 
 109 573.75 
 109 650.75 
 109 736.00 
 109 818.50 
 109 903.75 
 109 986.25 
 110 071.50 
 110 156.75 
 110 239.25 
 110 324.50 
 110 407.00 
 110 492.25 
 110 577.50 
 110 654.50 
 110 739.75 
 110 822.25 
 110 907.50 
 110 990.00 
 111 075.25 
 111 160.50 
 111 243.00 
 111 328.25 
 111 410.75 
 111 496.00 
 111 581.25 
 111 658.25 
 111 743.50 
 111 826.00 
 111 911.25 
 111 993.75 
 112 079.00 
 112 164.25 
 112 246.75 
 112 332.00 
 112 414.50 
 112 499.75 
 112 585.00 
 112 664.75 
 112 750.00 
 112 832.50 
 112 917.75 
 113 000.25 
 113 085.50 
 113 170.75 
 113 253.25 
 113 338.50 
 113 421.00 
 113 506.25 
 113 591.50 
 113 668.50 
 113 753.75 
 113 836.25 
 113 921.50 
 114 004.00 
 114 089.25 
 114 174.50 
 114 257.00 
 114 342.25 
 114 424.75 
 114 510.00 
 114 595.25 
 114 672.25 
 114 757.50 
 114 840.00 
 114 925.25 
 115 007.75 
 115 093.00 
 115 178.25 
 115 260.75 
 115 346.00 
 115 428.50 
 115 513.75 
 115 599.00 
 115 676.00 
 115 761.25 
 115 843.75 
 115 929.00 
 116 011.50 
 116 096.75 
 116 182.00 
 116 264.50 
 116 349.75 
 116 432.25 


Summary of computational transaction
Raw Inputview raw input (R code)
Raw Outputview raw output of R engine
Computing time2 seconds
R Server'Herman Ole Andreas Wold' @ wold.wessa.net

\begin{tabular}{lllllllll}
\hline
Summary of computational transaction \tabularnewline
Raw Input & view raw input (R code)  \tabularnewline
Raw Output & view raw output of R engine  \tabularnewline
Computing time & 2 seconds \tabularnewline
R Server & 'Herman Ole Andreas Wold' @ wold.wessa.net \tabularnewline
\hline
\end{tabular}
%Source: https://freestatistics.org/blog/index.php?pk=296035&T=0

[TABLE]
[ROW][C]Summary of computational transaction[/C][/ROW]
[ROW][C]Raw Input[/C][C]view raw input (R code) [/C][/ROW]
[ROW][C]Raw Output[/C][C]view raw output of R engine [/C][/ROW]
[ROW][C]Computing time[/C][C]2 seconds[/C][/ROW]
[ROW][C]R Server[/C][C]'Herman Ole Andreas Wold' @ wold.wessa.net[/C][/ROW]
[/TABLE]
Source: https://freestatistics.org/blog/index.php?pk=296035&T=0

Globally Unique Identifier (entire table): ba.freestatistics.org/blog/index.php?pk=296035&T=0

As an alternative you can also use a QR Code:  

The GUIDs for individual cells are displayed in the table below:

Summary of computational transaction
Raw Inputview raw input (R code)
Raw Outputview raw output of R engine
Computing time2 seconds
R Server'Herman Ole Andreas Wold' @ wold.wessa.net


Parameters (Session):
par1 = 12 ;
Parameters (R input):
par1 = 12 ;
R code (references can be found in the software module):
par1 <- as.numeric(par1)
(n <- length(x))
(np <- floor(n / par1))
arr <- array(NA,dim=c(par1,np+1))
ari <- array(0,dim=par1)
j <- 0
for (i in 1:n)
{
j = j + 1
ari[j] = ari[j] + 1
arr[j,ari[j]] <- x[i]
if (j == par1) j = 0
}
ari
arr
arr.sd <- array(NA,dim=par1)
arr.range <- array(NA,dim=par1)
arr.iqr <- array(NA,dim=par1)
for (j in 1:par1)
{
arr.sd[j] <- sqrt(var(arr[j,],na.rm=TRUE))
arr.range[j] <- max(arr[j,],na.rm=TRUE) - min(arr[j,],na.rm=TRUE)
arr.iqr[j] <- quantile(arr[j,],0.75,na.rm=TRUE) - quantile(arr[j,],0.25,na.rm=TRUE)
}
overall.sd <- sqrt(var(x))
overall.range <- max(x) - min(x)
overall.iqr <- quantile(x,0.75) - quantile(x,0.25)
bitmap(file='plot1.png')
plot(arr.sd,type='b',ylab='S.D.',main='Standard Deviation Plot',xlab='Periodic Index')
mtext(paste('# blocks = ',np))
abline(overall.sd,0)
dev.off()
bitmap(file='plot2.png')
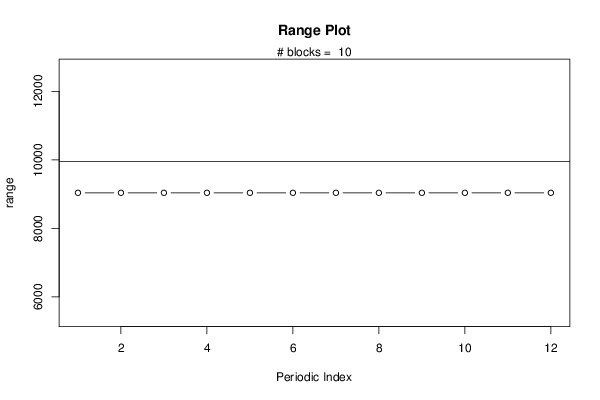
plot(arr.range,type='b',ylab='range',main='Range Plot',xlab='Periodic Index')
mtext(paste('# blocks = ',np))
abline(overall.range,0)
dev.off()
bitmap(file='plot3.png')
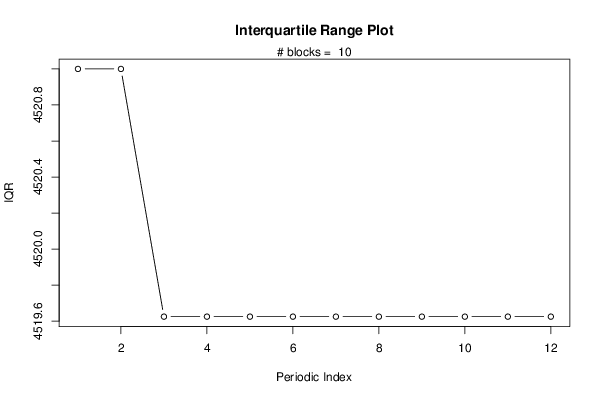
plot(arr.iqr,type='b',ylab='IQR',main='Interquartile Range Plot',xlab='Periodic Index')
mtext(paste('# blocks = ',np))
abline(overall.iqr,0)
dev.off()
bitmap(file='plot4.png')
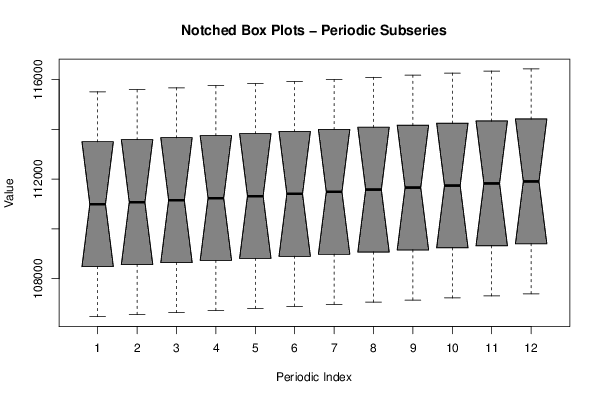
z <- data.frame(t(arr))
names(z) <- c(1:par1)
(boxplot(z,notch=TRUE,col='grey',xlab='Periodic Index',ylab='Value',main='Notched Box Plots - Periodic Subseries'))
dev.off()
bitmap(file='plot5.png')
z <- data.frame(arr)
names(z) <- c(1:np)
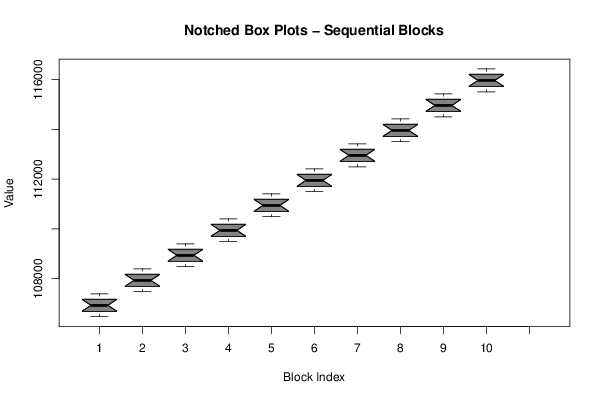
(boxplot(z,notch=TRUE,col='grey',xlab='Block Index',ylab='Value',main='Notched Box Plots - Sequential Blocks'))
dev.off()
bitmap(file='plot6.png')
z <- data.frame(cbind(arr.sd,arr.range,arr.iqr))
names(z) <- list('S.D.','Range','IQR')
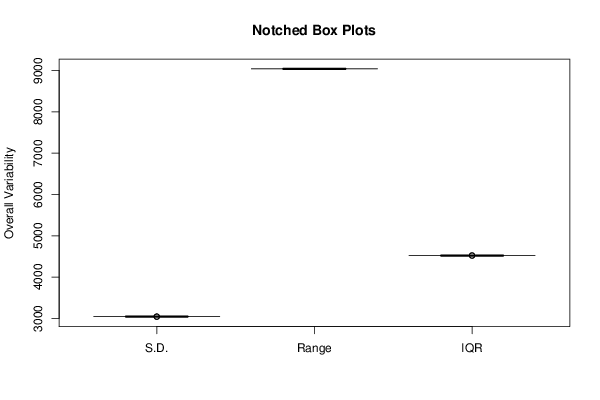
(boxplot(z,notch=TRUE,col='grey',ylab='Overall Variability',main='Notched Box Plots'))
dev.off()