Free Statistics
of Irreproducible Research!
Description of Statistical Computation | |||||||||||||||||||||||||||||||||||||||||
|---|---|---|---|---|---|---|---|---|---|---|---|---|---|---|---|---|---|---|---|---|---|---|---|---|---|---|---|---|---|---|---|---|---|---|---|---|---|---|---|---|---|
| Author's title | |||||||||||||||||||||||||||||||||||||||||
| Author | *Unverified author* | ||||||||||||||||||||||||||||||||||||||||
| R Software Module | rwasp_univariatedataseries.wasp | ||||||||||||||||||||||||||||||||||||||||
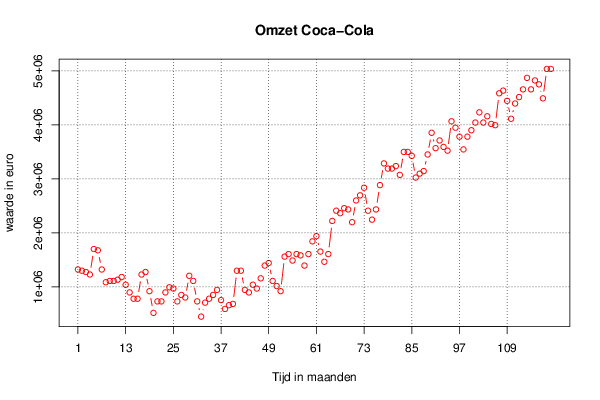
| Title produced by software | Univariate Data Series | ||||||||||||||||||||||||||||||||||||||||
| Date of computation | Wed, 10 Aug 2016 13:34:50 +0100 | ||||||||||||||||||||||||||||||||||||||||
| Cite this page as follows | Statistical Computations at FreeStatistics.org, Office for Research Development and Education, URL https://freestatistics.org/blog/index.php?v=date/2016/Aug/10/t1470832634motpvbjo74cpeo5.htm/, Retrieved Tue, 30 Apr 2024 05:30:17 +0000 | ||||||||||||||||||||||||||||||||||||||||
| Statistical Computations at FreeStatistics.org, Office for Research Development and Education, URL https://freestatistics.org/blog/index.php?pk=296189, Retrieved Tue, 30 Apr 2024 05:30:17 +0000 | |||||||||||||||||||||||||||||||||||||||||
| QR Codes: | |||||||||||||||||||||||||||||||||||||||||
|
| |||||||||||||||||||||||||||||||||||||||||
| Original text written by user: | |||||||||||||||||||||||||||||||||||||||||
| IsPrivate? | No (this computation is public) | ||||||||||||||||||||||||||||||||||||||||
| User-defined keywords | |||||||||||||||||||||||||||||||||||||||||
| Estimated Impact | 115 | ||||||||||||||||||||||||||||||||||||||||
Tree of Dependent Computations | |||||||||||||||||||||||||||||||||||||||||
| Family? (F = Feedback message, R = changed R code, M = changed R Module, P = changed Parameters, D = changed Data) | |||||||||||||||||||||||||||||||||||||||||
| - [Univariate Data Series] [omzet CC jaarbasis] [2016-08-10 12:34:50] [4bedbbf2e5251222bc39a0f973d05821] [Current] | |||||||||||||||||||||||||||||||||||||||||
| Feedback Forum | |||||||||||||||||||||||||||||||||||||||||
Post a new message | |||||||||||||||||||||||||||||||||||||||||
Dataset | |||||||||||||||||||||||||||||||||||||||||
| Dataseries X: | |||||||||||||||||||||||||||||||||||||||||
1323594 1300315,5 1277014,5 1230432,75 1701774 1678470,75 1323594 1087935,75 1111214,25 1111214,25 1134515,25 1183623,75 1041354 898857 782167,5 782167,5 1230432,75 1277014,5 922135,5 520677 733056,75 733056,75 898857 994547,25 971244 733056,75 852277,5 805468,5 1206927 1111214,25 733056,75 450591,75 709755,75 782167,5 852277,5 945438,75 756337,5 593088,75 663198,75 686477,25 1300315,5 1300315,5 945438,75 898857 1041354 971244 1160345,25 1396005,75 1442812,5 1111214,25 1017825,75 922135,5 1561803,75 1608612,75 1489394,25 1608612,75 1585082,25 1396005,75 1608612,75 1844271 1939961,25 1655192,25 1466091 1608612,75 2222428,5 2411527,5 2364948 2458086,75 2434808,25 2199147,75 2600606,25 2696296,5 2836264,5 2411527,5 2245729,5 2434808,25 2885375,25 3286831,5 3191143,5 3191143,5 3237950,25 3074451,75 3499440,75 3499440,75 3427029 3025343,25 3097755 3144561,75 3452631,75 3854090,25 3569298,75 3711820,5 3592602 3522719,25 4066697,25 3947478,75 3781678,5 3546020,25 3781678,5 3900897 4043166,75 4232245,5 4043166,75 4159858,5 4017566,25 3994287,75 4584822,75 4633931,25 4444854,75 4113276,75 4395744 4514735,25 4657234,5 4869614,25 4657234,5 4823032,5 4750623 4491434,25 5035389,75 5035389,75 | |||||||||||||||||||||||||||||||||||||||||
Tables (Output of Computation) | |||||||||||||||||||||||||||||||||||||||||
| |||||||||||||||||||||||||||||||||||||||||
Figures (Output of Computation) | |||||||||||||||||||||||||||||||||||||||||
Input Parameters & R Code | |||||||||||||||||||||||||||||||||||||||||
| Parameters (Session): | |||||||||||||||||||||||||||||||||||||||||
| par1 = Coca-Cola omzet in EUR op jaarbasis ; par2 = Niet gekend ; par3 = Omzet op jaarbasis van Coca-Cola ; par4 = 12 ; | |||||||||||||||||||||||||||||||||||||||||
| Parameters (R input): | |||||||||||||||||||||||||||||||||||||||||
| par1 = Coca-Cola omzet in EUR op jaarbasis ; par2 = Niet gekend ; par3 = Omzet op jaarbasis van Coca-Cola ; par4 = 12 ; | |||||||||||||||||||||||||||||||||||||||||
| R code (references can be found in the software module): | |||||||||||||||||||||||||||||||||||||||||
par4 <- '12' | |||||||||||||||||||||||||||||||||||||||||