Free Statistics

of Irreproducible Research!

Author's title

Author*Unverified author*
R Software Modulerwasp_autocorrelation.wasp
Title produced by software(Partial) Autocorrelation Function
Date of computationWed, 10 Aug 2016 15:48:00 +0100
Cite this page as followsStatistical Computations at FreeStatistics.org, Office for Research Development and Education, URL https://freestatistics.org/blog/index.php?v=date/2016/Aug/10/t1470840519jpv8qax6phtgskd.htm/, Retrieved Tue, 30 Apr 2024 06:04:17 +0000
Statistical Computations at FreeStatistics.org, Office for Research Development and Education, URL https://freestatistics.org/blog/index.php?pk=296210, Retrieved Tue, 30 Apr 2024 06:04:17 +0000
QR Codes:

Original text written by user:
IsPrivate?No (this computation is public)
User-defined keywords
Estimated Impact126
Family? (F = Feedback message, R = changed R code, M = changed R Module, P = changed Parameters, D = changed Data)
-       [(Partial) Autocorrelation Function] [] [2016-08-10 14:48:00] [eed3b94f44ab74d862a61d666a631b56] [Current]
Feedback Forum

Post a new message
Dataseries X:
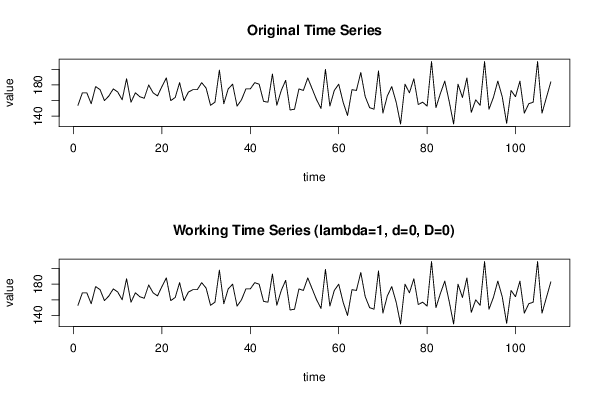
154
170
170
156
178
174
160
166
175
171
161
188
158
170
165
163
180
170
166
178
189
160
164
183
160
171
174
174
183
176
154
158
199
156
175
181
153
161
175
175
183
181
159
158
194
154
173
186
148
149
175
173
189
175
161
150
200
153
173
181
158
141
174
173
196
165
151
149
198
144
166
178
158
130
181
170
188
155
158
153
210
151
169
185
159
130
181
164
189
145
161
154
210
149
164
185
165
131
173
165
185
144
156
158
210
144
164
184


Summary of computational transaction
Raw Inputview raw input (R code)
Raw Outputview raw output of R engine
Computing time1 seconds
R Server'Sir Ronald Aylmer Fisher' @ fisher.wessa.net

\begin{tabular}{lllllllll}
\hline
Summary of computational transaction \tabularnewline
Raw Input & view raw input (R code)  \tabularnewline
Raw Output & view raw output of R engine  \tabularnewline
Computing time & 1 seconds \tabularnewline
R Server & 'Sir Ronald Aylmer Fisher' @ fisher.wessa.net \tabularnewline
\hline
\end{tabular}
%Source: https://freestatistics.org/blog/index.php?pk=296210&T=0

[TABLE]
[ROW][C]Summary of computational transaction[/C][/ROW]
[ROW][C]Raw Input[/C][C]view raw input (R code) [/C][/ROW]
[ROW][C]Raw Output[/C][C]view raw output of R engine [/C][/ROW]
[ROW][C]Computing time[/C][C]1 seconds[/C][/ROW]
[ROW][C]R Server[/C][C]'Sir Ronald Aylmer Fisher' @ fisher.wessa.net[/C][/ROW]
[/TABLE]
Source: https://freestatistics.org/blog/index.php?pk=296210&T=0

Globally Unique Identifier (entire table): ba.freestatistics.org/blog/index.php?pk=296210&T=0

As an alternative you can also use a QR Code:  

The GUIDs for individual cells are displayed in the table below:

Summary of computational transaction
Raw Inputview raw input (R code)
Raw Outputview raw output of R engine
Computing time1 seconds
R Server'Sir Ronald Aylmer Fisher' @ fisher.wessa.net


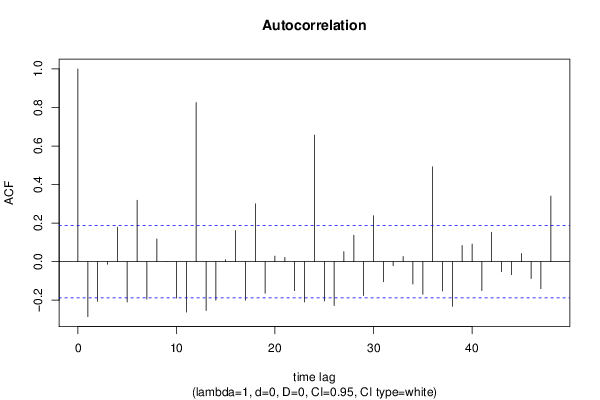
Autocorrelation Function
Time lag kACF(k)T-STATP-value
1-0.285517-2.96720.001851
2-0.20634-2.14430.017124
3-0.014037-0.14590.442146
40.1781741.85160.033405
5-0.209962-2.1820.015639
60.3190663.31580.000622
7-0.194456-2.02080.022885
80.1171321.21730.113077
9-0.000196-0.0020.499189
10-0.189208-1.96630.025915
11-0.261899-2.72170.003786
120.8251448.57510
13-0.253429-2.63370.004843
14-0.200377-2.08240.019835
150.0096420.10020.460183
160.1608271.67140.048773
17-0.19965-2.07480.02019
180.2998733.11640.001173
19-0.164433-1.70880.045177
200.0286890.29810.383083
210.0220990.22970.409395
22-0.15065-1.56560.060184
23-0.208889-2.17080.016067
240.6567136.82480
25-0.204537-2.12560.017908
26-0.227643-2.36570.009889
270.0518450.53880.295569
280.1370321.42410.078653
29-0.175913-1.82810.035144
300.2382812.47630.007414
31-0.104802-1.08910.139259
32-0.020919-0.21740.414155
330.0265510.27590.391565
34-0.116348-1.20910.114629
35-0.169443-1.76090.040543
360.4917655.11061e-06
37-0.152691-1.58680.057739
38-0.232418-2.41540.008699
390.0838180.87110.192827
400.0908840.94450.173512
41-0.150308-1.5620.060602
420.152861.58860.05754
43-0.052195-0.54240.29432
44-0.067459-0.70110.242389
450.0423070.43970.330529
46-0.08727-0.90690.183229
47-0.140296-1.4580.073871
480.3398963.53230.000304

\begin{tabular}{lllllllll}
\hline
Autocorrelation Function \tabularnewline
Time lag k & ACF(k) & T-STAT & P-value \tabularnewline
1 & -0.285517 & -2.9672 & 0.001851 \tabularnewline
2 & -0.20634 & -2.1443 & 0.017124 \tabularnewline
3 & -0.014037 & -0.1459 & 0.442146 \tabularnewline
4 & 0.178174 & 1.8516 & 0.033405 \tabularnewline
5 & -0.209962 & -2.182 & 0.015639 \tabularnewline
6 & 0.319066 & 3.3158 & 0.000622 \tabularnewline
7 & -0.194456 & -2.0208 & 0.022885 \tabularnewline
8 & 0.117132 & 1.2173 & 0.113077 \tabularnewline
9 & -0.000196 & -0.002 & 0.499189 \tabularnewline
10 & -0.189208 & -1.9663 & 0.025915 \tabularnewline
11 & -0.261899 & -2.7217 & 0.003786 \tabularnewline
12 & 0.825144 & 8.5751 & 0 \tabularnewline
13 & -0.253429 & -2.6337 & 0.004843 \tabularnewline
14 & -0.200377 & -2.0824 & 0.019835 \tabularnewline
15 & 0.009642 & 0.1002 & 0.460183 \tabularnewline
16 & 0.160827 & 1.6714 & 0.048773 \tabularnewline
17 & -0.19965 & -2.0748 & 0.02019 \tabularnewline
18 & 0.299873 & 3.1164 & 0.001173 \tabularnewline
19 & -0.164433 & -1.7088 & 0.045177 \tabularnewline
20 & 0.028689 & 0.2981 & 0.383083 \tabularnewline
21 & 0.022099 & 0.2297 & 0.409395 \tabularnewline
22 & -0.15065 & -1.5656 & 0.060184 \tabularnewline
23 & -0.208889 & -2.1708 & 0.016067 \tabularnewline
24 & 0.656713 & 6.8248 & 0 \tabularnewline
25 & -0.204537 & -2.1256 & 0.017908 \tabularnewline
26 & -0.227643 & -2.3657 & 0.009889 \tabularnewline
27 & 0.051845 & 0.5388 & 0.295569 \tabularnewline
28 & 0.137032 & 1.4241 & 0.078653 \tabularnewline
29 & -0.175913 & -1.8281 & 0.035144 \tabularnewline
30 & 0.238281 & 2.4763 & 0.007414 \tabularnewline
31 & -0.104802 & -1.0891 & 0.139259 \tabularnewline
32 & -0.020919 & -0.2174 & 0.414155 \tabularnewline
33 & 0.026551 & 0.2759 & 0.391565 \tabularnewline
34 & -0.116348 & -1.2091 & 0.114629 \tabularnewline
35 & -0.169443 & -1.7609 & 0.040543 \tabularnewline
36 & 0.491765 & 5.1106 & 1e-06 \tabularnewline
37 & -0.152691 & -1.5868 & 0.057739 \tabularnewline
38 & -0.232418 & -2.4154 & 0.008699 \tabularnewline
39 & 0.083818 & 0.8711 & 0.192827 \tabularnewline
40 & 0.090884 & 0.9445 & 0.173512 \tabularnewline
41 & -0.150308 & -1.562 & 0.060602 \tabularnewline
42 & 0.15286 & 1.5886 & 0.05754 \tabularnewline
43 & -0.052195 & -0.5424 & 0.29432 \tabularnewline
44 & -0.067459 & -0.7011 & 0.242389 \tabularnewline
45 & 0.042307 & 0.4397 & 0.330529 \tabularnewline
46 & -0.08727 & -0.9069 & 0.183229 \tabularnewline
47 & -0.140296 & -1.458 & 0.073871 \tabularnewline
48 & 0.339896 & 3.5323 & 0.000304 \tabularnewline
\hline
\end{tabular}
%Source: https://freestatistics.org/blog/index.php?pk=296210&T=1

[TABLE]
[ROW][C]Autocorrelation Function[/C][/ROW]
[ROW][C]Time lag k[/C][C]ACF(k)[/C][C]T-STAT[/C][C]P-value[/C][/ROW]
[ROW][C]1[/C][C]-0.285517[/C][C]-2.9672[/C][C]0.001851[/C][/ROW]
[ROW][C]2[/C][C]-0.20634[/C][C]-2.1443[/C][C]0.017124[/C][/ROW]
[ROW][C]3[/C][C]-0.014037[/C][C]-0.1459[/C][C]0.442146[/C][/ROW]
[ROW][C]4[/C][C]0.178174[/C][C]1.8516[/C][C]0.033405[/C][/ROW]
[ROW][C]5[/C][C]-0.209962[/C][C]-2.182[/C][C]0.015639[/C][/ROW]
[ROW][C]6[/C][C]0.319066[/C][C]3.3158[/C][C]0.000622[/C][/ROW]
[ROW][C]7[/C][C]-0.194456[/C][C]-2.0208[/C][C]0.022885[/C][/ROW]
[ROW][C]8[/C][C]0.117132[/C][C]1.2173[/C][C]0.113077[/C][/ROW]
[ROW][C]9[/C][C]-0.000196[/C][C]-0.002[/C][C]0.499189[/C][/ROW]
[ROW][C]10[/C][C]-0.189208[/C][C]-1.9663[/C][C]0.025915[/C][/ROW]
[ROW][C]11[/C][C]-0.261899[/C][C]-2.7217[/C][C]0.003786[/C][/ROW]
[ROW][C]12[/C][C]0.825144[/C][C]8.5751[/C][C]0[/C][/ROW]
[ROW][C]13[/C][C]-0.253429[/C][C]-2.6337[/C][C]0.004843[/C][/ROW]
[ROW][C]14[/C][C]-0.200377[/C][C]-2.0824[/C][C]0.019835[/C][/ROW]
[ROW][C]15[/C][C]0.009642[/C][C]0.1002[/C][C]0.460183[/C][/ROW]
[ROW][C]16[/C][C]0.160827[/C][C]1.6714[/C][C]0.048773[/C][/ROW]
[ROW][C]17[/C][C]-0.19965[/C][C]-2.0748[/C][C]0.02019[/C][/ROW]
[ROW][C]18[/C][C]0.299873[/C][C]3.1164[/C][C]0.001173[/C][/ROW]
[ROW][C]19[/C][C]-0.164433[/C][C]-1.7088[/C][C]0.045177[/C][/ROW]
[ROW][C]20[/C][C]0.028689[/C][C]0.2981[/C][C]0.383083[/C][/ROW]
[ROW][C]21[/C][C]0.022099[/C][C]0.2297[/C][C]0.409395[/C][/ROW]
[ROW][C]22[/C][C]-0.15065[/C][C]-1.5656[/C][C]0.060184[/C][/ROW]
[ROW][C]23[/C][C]-0.208889[/C][C]-2.1708[/C][C]0.016067[/C][/ROW]
[ROW][C]24[/C][C]0.656713[/C][C]6.8248[/C][C]0[/C][/ROW]
[ROW][C]25[/C][C]-0.204537[/C][C]-2.1256[/C][C]0.017908[/C][/ROW]
[ROW][C]26[/C][C]-0.227643[/C][C]-2.3657[/C][C]0.009889[/C][/ROW]
[ROW][C]27[/C][C]0.051845[/C][C]0.5388[/C][C]0.295569[/C][/ROW]
[ROW][C]28[/C][C]0.137032[/C][C]1.4241[/C][C]0.078653[/C][/ROW]
[ROW][C]29[/C][C]-0.175913[/C][C]-1.8281[/C][C]0.035144[/C][/ROW]
[ROW][C]30[/C][C]0.238281[/C][C]2.4763[/C][C]0.007414[/C][/ROW]
[ROW][C]31[/C][C]-0.104802[/C][C]-1.0891[/C][C]0.139259[/C][/ROW]
[ROW][C]32[/C][C]-0.020919[/C][C]-0.2174[/C][C]0.414155[/C][/ROW]
[ROW][C]33[/C][C]0.026551[/C][C]0.2759[/C][C]0.391565[/C][/ROW]
[ROW][C]34[/C][C]-0.116348[/C][C]-1.2091[/C][C]0.114629[/C][/ROW]
[ROW][C]35[/C][C]-0.169443[/C][C]-1.7609[/C][C]0.040543[/C][/ROW]
[ROW][C]36[/C][C]0.491765[/C][C]5.1106[/C][C]1e-06[/C][/ROW]
[ROW][C]37[/C][C]-0.152691[/C][C]-1.5868[/C][C]0.057739[/C][/ROW]
[ROW][C]38[/C][C]-0.232418[/C][C]-2.4154[/C][C]0.008699[/C][/ROW]
[ROW][C]39[/C][C]0.083818[/C][C]0.8711[/C][C]0.192827[/C][/ROW]
[ROW][C]40[/C][C]0.090884[/C][C]0.9445[/C][C]0.173512[/C][/ROW]
[ROW][C]41[/C][C]-0.150308[/C][C]-1.562[/C][C]0.060602[/C][/ROW]
[ROW][C]42[/C][C]0.15286[/C][C]1.5886[/C][C]0.05754[/C][/ROW]
[ROW][C]43[/C][C]-0.052195[/C][C]-0.5424[/C][C]0.29432[/C][/ROW]
[ROW][C]44[/C][C]-0.067459[/C][C]-0.7011[/C][C]0.242389[/C][/ROW]
[ROW][C]45[/C][C]0.042307[/C][C]0.4397[/C][C]0.330529[/C][/ROW]
[ROW][C]46[/C][C]-0.08727[/C][C]-0.9069[/C][C]0.183229[/C][/ROW]
[ROW][C]47[/C][C]-0.140296[/C][C]-1.458[/C][C]0.073871[/C][/ROW]
[ROW][C]48[/C][C]0.339896[/C][C]3.5323[/C][C]0.000304[/C][/ROW]
[/TABLE]
Source: https://freestatistics.org/blog/index.php?pk=296210&T=1

Globally Unique Identifier (entire table): ba.freestatistics.org/blog/index.php?pk=296210&T=1

As an alternative you can also use a QR Code:  

The GUIDs for individual cells are displayed in the table below:

Autocorrelation Function
Time lag kACF(k)T-STATP-value
1-0.285517-2.96720.001851
2-0.20634-2.14430.017124
3-0.014037-0.14590.442146
40.1781741.85160.033405
5-0.209962-2.1820.015639
60.3190663.31580.000622
7-0.194456-2.02080.022885
80.1171321.21730.113077
9-0.000196-0.0020.499189
10-0.189208-1.96630.025915
11-0.261899-2.72170.003786
120.8251448.57510
13-0.253429-2.63370.004843
14-0.200377-2.08240.019835
150.0096420.10020.460183
160.1608271.67140.048773
17-0.19965-2.07480.02019
180.2998733.11640.001173
19-0.164433-1.70880.045177
200.0286890.29810.383083
210.0220990.22970.409395
22-0.15065-1.56560.060184
23-0.208889-2.17080.016067
240.6567136.82480
25-0.204537-2.12560.017908
26-0.227643-2.36570.009889
270.0518450.53880.295569
280.1370321.42410.078653
29-0.175913-1.82810.035144
300.2382812.47630.007414
31-0.104802-1.08910.139259
32-0.020919-0.21740.414155
330.0265510.27590.391565
34-0.116348-1.20910.114629
35-0.169443-1.76090.040543
360.4917655.11061e-06
37-0.152691-1.58680.057739
38-0.232418-2.41540.008699
390.0838180.87110.192827
400.0908840.94450.173512
41-0.150308-1.5620.060602
420.152861.58860.05754
43-0.052195-0.54240.29432
44-0.067459-0.70110.242389
450.0423070.43970.330529
46-0.08727-0.90690.183229
47-0.140296-1.4580.073871
480.3398963.53230.000304


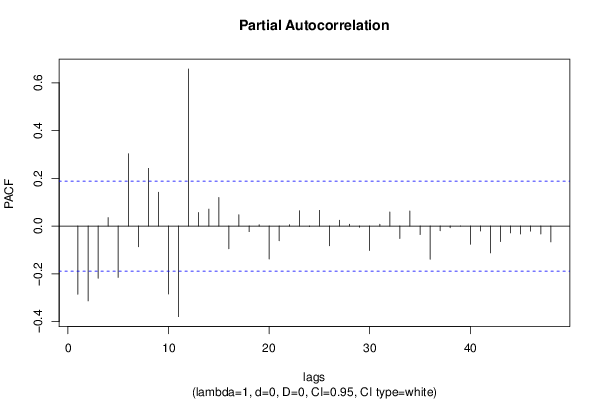
Partial Autocorrelation Function
Time lag kPACF(k)T-STATP-value
1-0.285517-2.96720.001851
2-0.313409-3.2570.000752
3-0.218407-2.26980.012604
40.0355260.36920.35635
5-0.214985-2.23420.013765
60.3028043.14680.001067
7-0.086402-0.89790.185615
80.2416492.51130.006755
90.1416971.47260.071889
10-0.284803-2.95980.001892
11-0.379273-3.94157.2e-05
120.6578436.83650
130.0568630.59090.2779
140.0708990.73680.231419
150.1194391.24120.108602
16-0.095153-0.98890.16247
170.047680.49550.310627
18-0.023271-0.24180.404683
190.0054050.05620.477654
20-0.138262-1.43690.076824
21-0.061394-0.6380.262403
220.005520.05740.477179
230.0642190.66740.252975
24-0.002155-0.02240.491086
250.0656610.68240.248235
26-0.082117-0.85340.197668
270.0240790.25020.401438
280.0079780.08290.467039
29-0.004924-0.05120.47964
30-0.102129-1.06140.145449
310.0073030.07590.469823
320.0586920.60990.271591
33-0.052296-0.54350.29396
340.0634390.65930.255559
35-0.035722-0.37120.355594
36-0.139236-1.4470.075399
37-0.019909-0.20690.418238
38-0.007122-0.0740.470567
39-0.00029-0.0030.498799
40-0.076158-0.79150.215205
41-0.020833-0.21650.414503
42-0.112297-1.1670.122886
43-0.065035-0.67590.250286
44-0.028487-0.2960.383883
45-0.033327-0.34630.364879
46-0.021101-0.21930.413419
47-0.033406-0.34720.36457
48-0.066351-0.68950.24598

\begin{tabular}{lllllllll}
\hline
Partial Autocorrelation Function \tabularnewline
Time lag k & PACF(k) & T-STAT & P-value \tabularnewline
1 & -0.285517 & -2.9672 & 0.001851 \tabularnewline
2 & -0.313409 & -3.257 & 0.000752 \tabularnewline
3 & -0.218407 & -2.2698 & 0.012604 \tabularnewline
4 & 0.035526 & 0.3692 & 0.35635 \tabularnewline
5 & -0.214985 & -2.2342 & 0.013765 \tabularnewline
6 & 0.302804 & 3.1468 & 0.001067 \tabularnewline
7 & -0.086402 & -0.8979 & 0.185615 \tabularnewline
8 & 0.241649 & 2.5113 & 0.006755 \tabularnewline
9 & 0.141697 & 1.4726 & 0.071889 \tabularnewline
10 & -0.284803 & -2.9598 & 0.001892 \tabularnewline
11 & -0.379273 & -3.9415 & 7.2e-05 \tabularnewline
12 & 0.657843 & 6.8365 & 0 \tabularnewline
13 & 0.056863 & 0.5909 & 0.2779 \tabularnewline
14 & 0.070899 & 0.7368 & 0.231419 \tabularnewline
15 & 0.119439 & 1.2412 & 0.108602 \tabularnewline
16 & -0.095153 & -0.9889 & 0.16247 \tabularnewline
17 & 0.04768 & 0.4955 & 0.310627 \tabularnewline
18 & -0.023271 & -0.2418 & 0.404683 \tabularnewline
19 & 0.005405 & 0.0562 & 0.477654 \tabularnewline
20 & -0.138262 & -1.4369 & 0.076824 \tabularnewline
21 & -0.061394 & -0.638 & 0.262403 \tabularnewline
22 & 0.00552 & 0.0574 & 0.477179 \tabularnewline
23 & 0.064219 & 0.6674 & 0.252975 \tabularnewline
24 & -0.002155 & -0.0224 & 0.491086 \tabularnewline
25 & 0.065661 & 0.6824 & 0.248235 \tabularnewline
26 & -0.082117 & -0.8534 & 0.197668 \tabularnewline
27 & 0.024079 & 0.2502 & 0.401438 \tabularnewline
28 & 0.007978 & 0.0829 & 0.467039 \tabularnewline
29 & -0.004924 & -0.0512 & 0.47964 \tabularnewline
30 & -0.102129 & -1.0614 & 0.145449 \tabularnewline
31 & 0.007303 & 0.0759 & 0.469823 \tabularnewline
32 & 0.058692 & 0.6099 & 0.271591 \tabularnewline
33 & -0.052296 & -0.5435 & 0.29396 \tabularnewline
34 & 0.063439 & 0.6593 & 0.255559 \tabularnewline
35 & -0.035722 & -0.3712 & 0.355594 \tabularnewline
36 & -0.139236 & -1.447 & 0.075399 \tabularnewline
37 & -0.019909 & -0.2069 & 0.418238 \tabularnewline
38 & -0.007122 & -0.074 & 0.470567 \tabularnewline
39 & -0.00029 & -0.003 & 0.498799 \tabularnewline
40 & -0.076158 & -0.7915 & 0.215205 \tabularnewline
41 & -0.020833 & -0.2165 & 0.414503 \tabularnewline
42 & -0.112297 & -1.167 & 0.122886 \tabularnewline
43 & -0.065035 & -0.6759 & 0.250286 \tabularnewline
44 & -0.028487 & -0.296 & 0.383883 \tabularnewline
45 & -0.033327 & -0.3463 & 0.364879 \tabularnewline
46 & -0.021101 & -0.2193 & 0.413419 \tabularnewline
47 & -0.033406 & -0.3472 & 0.36457 \tabularnewline
48 & -0.066351 & -0.6895 & 0.24598 \tabularnewline
\hline
\end{tabular}
%Source: https://freestatistics.org/blog/index.php?pk=296210&T=2

[TABLE]
[ROW][C]Partial Autocorrelation Function[/C][/ROW]
[ROW][C]Time lag k[/C][C]PACF(k)[/C][C]T-STAT[/C][C]P-value[/C][/ROW]
[ROW][C]1[/C][C]-0.285517[/C][C]-2.9672[/C][C]0.001851[/C][/ROW]
[ROW][C]2[/C][C]-0.313409[/C][C]-3.257[/C][C]0.000752[/C][/ROW]
[ROW][C]3[/C][C]-0.218407[/C][C]-2.2698[/C][C]0.012604[/C][/ROW]
[ROW][C]4[/C][C]0.035526[/C][C]0.3692[/C][C]0.35635[/C][/ROW]
[ROW][C]5[/C][C]-0.214985[/C][C]-2.2342[/C][C]0.013765[/C][/ROW]
[ROW][C]6[/C][C]0.302804[/C][C]3.1468[/C][C]0.001067[/C][/ROW]
[ROW][C]7[/C][C]-0.086402[/C][C]-0.8979[/C][C]0.185615[/C][/ROW]
[ROW][C]8[/C][C]0.241649[/C][C]2.5113[/C][C]0.006755[/C][/ROW]
[ROW][C]9[/C][C]0.141697[/C][C]1.4726[/C][C]0.071889[/C][/ROW]
[ROW][C]10[/C][C]-0.284803[/C][C]-2.9598[/C][C]0.001892[/C][/ROW]
[ROW][C]11[/C][C]-0.379273[/C][C]-3.9415[/C][C]7.2e-05[/C][/ROW]
[ROW][C]12[/C][C]0.657843[/C][C]6.8365[/C][C]0[/C][/ROW]
[ROW][C]13[/C][C]0.056863[/C][C]0.5909[/C][C]0.2779[/C][/ROW]
[ROW][C]14[/C][C]0.070899[/C][C]0.7368[/C][C]0.231419[/C][/ROW]
[ROW][C]15[/C][C]0.119439[/C][C]1.2412[/C][C]0.108602[/C][/ROW]
[ROW][C]16[/C][C]-0.095153[/C][C]-0.9889[/C][C]0.16247[/C][/ROW]
[ROW][C]17[/C][C]0.04768[/C][C]0.4955[/C][C]0.310627[/C][/ROW]
[ROW][C]18[/C][C]-0.023271[/C][C]-0.2418[/C][C]0.404683[/C][/ROW]
[ROW][C]19[/C][C]0.005405[/C][C]0.0562[/C][C]0.477654[/C][/ROW]
[ROW][C]20[/C][C]-0.138262[/C][C]-1.4369[/C][C]0.076824[/C][/ROW]
[ROW][C]21[/C][C]-0.061394[/C][C]-0.638[/C][C]0.262403[/C][/ROW]
[ROW][C]22[/C][C]0.00552[/C][C]0.0574[/C][C]0.477179[/C][/ROW]
[ROW][C]23[/C][C]0.064219[/C][C]0.6674[/C][C]0.252975[/C][/ROW]
[ROW][C]24[/C][C]-0.002155[/C][C]-0.0224[/C][C]0.491086[/C][/ROW]
[ROW][C]25[/C][C]0.065661[/C][C]0.6824[/C][C]0.248235[/C][/ROW]
[ROW][C]26[/C][C]-0.082117[/C][C]-0.8534[/C][C]0.197668[/C][/ROW]
[ROW][C]27[/C][C]0.024079[/C][C]0.2502[/C][C]0.401438[/C][/ROW]
[ROW][C]28[/C][C]0.007978[/C][C]0.0829[/C][C]0.467039[/C][/ROW]
[ROW][C]29[/C][C]-0.004924[/C][C]-0.0512[/C][C]0.47964[/C][/ROW]
[ROW][C]30[/C][C]-0.102129[/C][C]-1.0614[/C][C]0.145449[/C][/ROW]
[ROW][C]31[/C][C]0.007303[/C][C]0.0759[/C][C]0.469823[/C][/ROW]
[ROW][C]32[/C][C]0.058692[/C][C]0.6099[/C][C]0.271591[/C][/ROW]
[ROW][C]33[/C][C]-0.052296[/C][C]-0.5435[/C][C]0.29396[/C][/ROW]
[ROW][C]34[/C][C]0.063439[/C][C]0.6593[/C][C]0.255559[/C][/ROW]
[ROW][C]35[/C][C]-0.035722[/C][C]-0.3712[/C][C]0.355594[/C][/ROW]
[ROW][C]36[/C][C]-0.139236[/C][C]-1.447[/C][C]0.075399[/C][/ROW]
[ROW][C]37[/C][C]-0.019909[/C][C]-0.2069[/C][C]0.418238[/C][/ROW]
[ROW][C]38[/C][C]-0.007122[/C][C]-0.074[/C][C]0.470567[/C][/ROW]
[ROW][C]39[/C][C]-0.00029[/C][C]-0.003[/C][C]0.498799[/C][/ROW]
[ROW][C]40[/C][C]-0.076158[/C][C]-0.7915[/C][C]0.215205[/C][/ROW]
[ROW][C]41[/C][C]-0.020833[/C][C]-0.2165[/C][C]0.414503[/C][/ROW]
[ROW][C]42[/C][C]-0.112297[/C][C]-1.167[/C][C]0.122886[/C][/ROW]
[ROW][C]43[/C][C]-0.065035[/C][C]-0.6759[/C][C]0.250286[/C][/ROW]
[ROW][C]44[/C][C]-0.028487[/C][C]-0.296[/C][C]0.383883[/C][/ROW]
[ROW][C]45[/C][C]-0.033327[/C][C]-0.3463[/C][C]0.364879[/C][/ROW]
[ROW][C]46[/C][C]-0.021101[/C][C]-0.2193[/C][C]0.413419[/C][/ROW]
[ROW][C]47[/C][C]-0.033406[/C][C]-0.3472[/C][C]0.36457[/C][/ROW]
[ROW][C]48[/C][C]-0.066351[/C][C]-0.6895[/C][C]0.24598[/C][/ROW]
[/TABLE]
Source: https://freestatistics.org/blog/index.php?pk=296210&T=2

Globally Unique Identifier (entire table): ba.freestatistics.org/blog/index.php?pk=296210&T=2

As an alternative you can also use a QR Code:  

The GUIDs for individual cells are displayed in the table below:

Partial Autocorrelation Function
Time lag kPACF(k)T-STATP-value
1-0.285517-2.96720.001851
2-0.313409-3.2570.000752
3-0.218407-2.26980.012604
40.0355260.36920.35635
5-0.214985-2.23420.013765
60.3028043.14680.001067
7-0.086402-0.89790.185615
80.2416492.51130.006755
90.1416971.47260.071889
10-0.284803-2.95980.001892
11-0.379273-3.94157.2e-05
120.6578436.83650
130.0568630.59090.2779
140.0708990.73680.231419
150.1194391.24120.108602
16-0.095153-0.98890.16247
170.047680.49550.310627
18-0.023271-0.24180.404683
190.0054050.05620.477654
20-0.138262-1.43690.076824
21-0.061394-0.6380.262403
220.005520.05740.477179
230.0642190.66740.252975
24-0.002155-0.02240.491086
250.0656610.68240.248235
26-0.082117-0.85340.197668
270.0240790.25020.401438
280.0079780.08290.467039
29-0.004924-0.05120.47964
30-0.102129-1.06140.145449
310.0073030.07590.469823
320.0586920.60990.271591
33-0.052296-0.54350.29396
340.0634390.65930.255559
35-0.035722-0.37120.355594
36-0.139236-1.4470.075399
37-0.019909-0.20690.418238
38-0.007122-0.0740.470567
39-0.00029-0.0030.498799
40-0.076158-0.79150.215205
41-0.020833-0.21650.414503
42-0.112297-1.1670.122886
43-0.065035-0.67590.250286
44-0.028487-0.2960.383883
45-0.033327-0.34630.364879
46-0.021101-0.21930.413419
47-0.033406-0.34720.36457
48-0.066351-0.68950.24598


Parameters (Session):
Parameters (R input):
par1 = 48 ; par2 = 1 ; par3 = 0 ; par4 = 0 ; par5 = 12 ; par6 = White Noise ; par7 = 0.95 ; par8 = ;
R code (references can be found in the software module):
if (par1 == 'Default') {
par1 = 10*log10(length(x))
} else {
par1 <- as.numeric(par1)
}
par2 <- as.numeric(par2)
par3 <- as.numeric(par3)
par4 <- as.numeric(par4)
par5 <- as.numeric(par5)
if (par6 == 'White Noise') par6 <- 'white' else par6 <- 'ma'
par7 <- as.numeric(par7)
if (par8 != '') par8 <- as.numeric(par8)
x <- na.omit(x)
ox <- x
if (par8 == '') {
if (par2 == 0) {
x <- log(x)
} else {
x <- (x ^ par2 - 1) / par2
}
} else {
x <- log(x,base=par8)
}
if (par3 > 0) x <- diff(x,lag=1,difference=par3)
if (par4 > 0) x <- diff(x,lag=par5,difference=par4)
bitmap(file='picts.png')
op <- par(mfrow=c(2,1))
plot(ox,type='l',main='Original Time Series',xlab='time',ylab='value')
if (par8=='') {
mytitle <- paste('Working Time Series (lambda=',par2,', d=',par3,', D=',par4,')',sep='')
mysub <- paste('(lambda=',par2,', d=',par3,', D=',par4,', CI=', par7, ', CI type=',par6,')',sep='')
} else {
mytitle <- paste('Working Time Series (base=',par8,', d=',par3,', D=',par4,')',sep='')
mysub <- paste('(base=',par8,', d=',par3,', D=',par4,', CI=', par7, ', CI type=',par6,')',sep='')
}
plot(x,type='l', main=mytitle,xlab='time',ylab='value')
par(op)
dev.off()
bitmap(file='pic1.png')
racf <- acf(x, par1, main='Autocorrelation', xlab='time lag', ylab='ACF', ci.type=par6, ci=par7, sub=mysub)
dev.off()
bitmap(file='pic2.png')
rpacf <- pacf(x,par1,main='Partial Autocorrelation',xlab='lags',ylab='PACF',sub=mysub)
dev.off()
(myacf <- c(racf$acf))
(mypacf <- c(rpacf$acf))
lengthx <- length(x)
sqrtn <- sqrt(lengthx)
load(file='createtable')
a<-table.start()
a<-table.row.start(a)
a<-table.element(a,'Autocorrelation Function',4,TRUE)
a<-table.row.end(a)
a<-table.row.start(a)
a<-table.element(a,'Time lag k',header=TRUE)
a<-table.element(a,hyperlink('basics.htm','ACF(k)','click here for more information about the Autocorrelation Function'),header=TRUE)
a<-table.element(a,'T-STAT',header=TRUE)
a<-table.element(a,'P-value',header=TRUE)
a<-table.row.end(a)
for (i in 2:(par1+1)) {
a<-table.row.start(a)
a<-table.element(a,i-1,header=TRUE)
a<-table.element(a,round(myacf[i],6))
mytstat <- myacf[i]*sqrtn
a<-table.element(a,round(mytstat,4))
a<-table.element(a,round(1-pt(abs(mytstat),lengthx),6))
a<-table.row.end(a)
}
a<-table.end(a)
table.save(a,file='mytable.tab')
a<-table.start()
a<-table.row.start(a)
a<-table.element(a,'Partial Autocorrelation Function',4,TRUE)
a<-table.row.end(a)
a<-table.row.start(a)
a<-table.element(a,'Time lag k',header=TRUE)
a<-table.element(a,hyperlink('basics.htm','PACF(k)','click here for more information about the Partial Autocorrelation Function'),header=TRUE)
a<-table.element(a,'T-STAT',header=TRUE)
a<-table.element(a,'P-value',header=TRUE)
a<-table.row.end(a)
for (i in 1:par1) {
a<-table.row.start(a)
a<-table.element(a,i,header=TRUE)
a<-table.element(a,round(mypacf[i],6))
mytstat <- mypacf[i]*sqrtn
a<-table.element(a,round(mytstat,4))
a<-table.element(a,round(1-pt(abs(mytstat),lengthx),6))
a<-table.row.end(a)
}
a<-table.end(a)
table.save(a,file='mytable1.tab')