Free Statistics

of Irreproducible Research!

Author's title

Author*Unverified author*
R Software Modulerwasp_autocorrelation.wasp
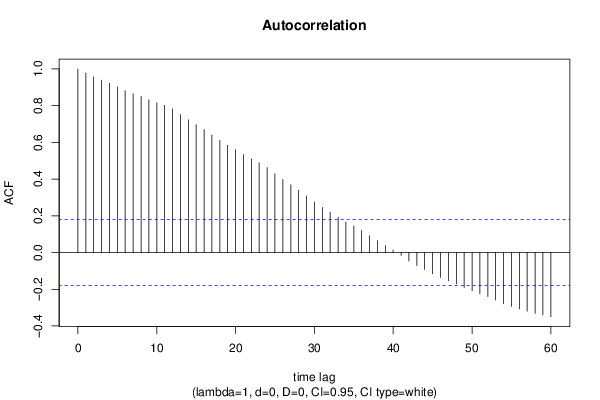
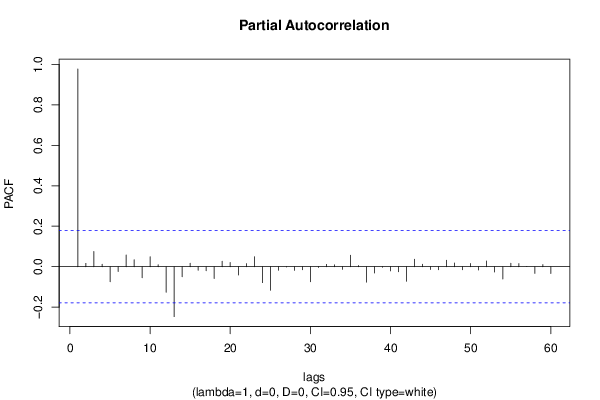
Title produced by software(Partial) Autocorrelation Function
Date of computationWed, 10 Aug 2016 20:00:30 +0100
Cite this page as followsStatistical Computations at FreeStatistics.org, Office for Research Development and Education, URL https://freestatistics.org/blog/index.php?v=date/2016/Aug/10/t1470855756lr65of8vwhhx65k.htm/, Retrieved Tue, 30 Apr 2024 07:33:49 +0000
Statistical Computations at FreeStatistics.org, Office for Research Development and Education, URL https://freestatistics.org/blog/index.php?pk=296240, Retrieved Tue, 30 Apr 2024 07:33:49 +0000
QR Codes:

Original text written by user:
IsPrivate?No (this computation is public)
User-defined keywords
Estimated Impact83
Family? (F = Feedback message, R = changed R code, M = changed R Module, P = changed Parameters, D = changed Data)
-       [(Partial) Autocorrelation Function] [] [2016-08-10 19:00:30] [409a9d71664281dd1fd3bb0995266dd0] [Current]
Feedback Forum

Post a new message
Dataseries X:
21571
21493
21422
21272
22747
22676
21571
20831
20909
20909
20980
21130
21051
21643
21864
21643
22455
21935
20759
20467
20467
20610
20026
20467
20097
20467
21051
21272
21792
21571
20246
19726
19506
19726
19363
19506
19064
19805
20168
20246
21643
21643
19805
19363
19363
19584
18622
18180
17668
17817
18480
17960
19363
19584
18180
17668
17375
17668
16855
16563
15388
15680
15751
15830
17226
17076
15388
14647
14355
14725
13322
12367
10601
10750
10750
10601
11854
11926
10451
10159
9568
10380
8905
8022
6333
6697
6255
6404
7509
7730
6996
6917
6917
7879
6184
5079
3163
4709
4488
4566
6333
6112
5300
5671
5671
6996
5450
4566
3163
5008
4859
4930
6476
6333
5813
5892
6255
7067
5813
4787


Summary of computational transaction
Raw Inputview raw input (R code)
Raw Outputview raw output of R engine
Computing time1 seconds
R Server'Gertrude Mary Cox' @ cox.wessa.net

\begin{tabular}{lllllllll}
\hline
Summary of computational transaction \tabularnewline
Raw Input & view raw input (R code)  \tabularnewline
Raw Output & view raw output of R engine  \tabularnewline
Computing time & 1 seconds \tabularnewline
R Server & 'Gertrude Mary Cox' @ cox.wessa.net \tabularnewline
\hline
\end{tabular}
%Source: https://freestatistics.org/blog/index.php?pk=296240&T=0

[TABLE]
[ROW][C]Summary of computational transaction[/C][/ROW]
[ROW][C]Raw Input[/C][C]view raw input (R code) [/C][/ROW]
[ROW][C]Raw Output[/C][C]view raw output of R engine [/C][/ROW]
[ROW][C]Computing time[/C][C]1 seconds[/C][/ROW]
[ROW][C]R Server[/C][C]'Gertrude Mary Cox' @ cox.wessa.net[/C][/ROW]
[/TABLE]
Source: https://freestatistics.org/blog/index.php?pk=296240&T=0

Globally Unique Identifier (entire table): ba.freestatistics.org/blog/index.php?pk=296240&T=0

As an alternative you can also use a QR Code:  

The GUIDs for individual cells are displayed in the table below:

Summary of computational transaction
Raw Inputview raw input (R code)
Raw Outputview raw output of R engine
Computing time1 seconds
R Server'Gertrude Mary Cox' @ cox.wessa.net


Autocorrelation Function
Time lag kACF(k)T-STATP-value
10.97755810.70860
20.95635610.47640
30.93892610.28540
40.92222110.10240
50.9022389.88350
60.8817269.65880
70.8647369.47270
80.8496549.30750
90.8317559.11140
100.816118.940
110.8018258.78360
120.7823828.57060
130.752418.24220
140.7226327.9160
150.6963747.62840
160.6695567.33460
170.6404977.01630
180.610276.68520
190.5843336.4010
200.560486.13980
210.5343415.85340
220.5101385.58830
230.4888665.35530
240.4625125.06661e-06
250.4295274.70523e-06
260.3977184.35681.4e-05
270.3690594.04284.7e-05
280.3396473.72060.000152
290.3079893.37390.000499
300.2747583.00980.001593
310.2457932.69250.004053
320.2189062.3980.009013
330.1919952.10320.018769
340.1663471.82220.035454
350.1443671.58150.058203
360.1205421.32050.094595
370.0919431.00720.157936
380.063910.70010.242609
390.038910.42620.335349
400.0132070.14470.442606
41-0.015332-0.1680.43345
42-0.045933-0.50320.307883
43-0.070215-0.76920.221652
44-0.092142-1.00940.157415
45-0.114844-1.25810.105407
46-0.135949-1.48930.069522
47-0.153201-1.67820.047952
48-0.170516-1.86790.032107
49-0.190236-2.08390.019644
50-0.20834-2.28220.012118
51-0.224443-2.45860.007687
52-0.239694-2.62570.004886
53-0.258427-2.83090.002722
54-0.27896-3.05590.001383
55-0.293741-3.21780.000831
56-0.305948-3.35150.000538
57-0.318929-3.49370.000334
58-0.331225-3.62840.00021
59-0.339992-3.72440.00015
60-0.349134-3.82460.000105

\begin{tabular}{lllllllll}
\hline
Autocorrelation Function \tabularnewline
Time lag k & ACF(k) & T-STAT & P-value \tabularnewline
1 & 0.977558 & 10.7086 & 0 \tabularnewline
2 & 0.956356 & 10.4764 & 0 \tabularnewline
3 & 0.938926 & 10.2854 & 0 \tabularnewline
4 & 0.922221 & 10.1024 & 0 \tabularnewline
5 & 0.902238 & 9.8835 & 0 \tabularnewline
6 & 0.881726 & 9.6588 & 0 \tabularnewline
7 & 0.864736 & 9.4727 & 0 \tabularnewline
8 & 0.849654 & 9.3075 & 0 \tabularnewline
9 & 0.831755 & 9.1114 & 0 \tabularnewline
10 & 0.81611 & 8.94 & 0 \tabularnewline
11 & 0.801825 & 8.7836 & 0 \tabularnewline
12 & 0.782382 & 8.5706 & 0 \tabularnewline
13 & 0.75241 & 8.2422 & 0 \tabularnewline
14 & 0.722632 & 7.916 & 0 \tabularnewline
15 & 0.696374 & 7.6284 & 0 \tabularnewline
16 & 0.669556 & 7.3346 & 0 \tabularnewline
17 & 0.640497 & 7.0163 & 0 \tabularnewline
18 & 0.61027 & 6.6852 & 0 \tabularnewline
19 & 0.584333 & 6.401 & 0 \tabularnewline
20 & 0.56048 & 6.1398 & 0 \tabularnewline
21 & 0.534341 & 5.8534 & 0 \tabularnewline
22 & 0.510138 & 5.5883 & 0 \tabularnewline
23 & 0.488866 & 5.3553 & 0 \tabularnewline
24 & 0.462512 & 5.0666 & 1e-06 \tabularnewline
25 & 0.429527 & 4.7052 & 3e-06 \tabularnewline
26 & 0.397718 & 4.3568 & 1.4e-05 \tabularnewline
27 & 0.369059 & 4.0428 & 4.7e-05 \tabularnewline
28 & 0.339647 & 3.7206 & 0.000152 \tabularnewline
29 & 0.307989 & 3.3739 & 0.000499 \tabularnewline
30 & 0.274758 & 3.0098 & 0.001593 \tabularnewline
31 & 0.245793 & 2.6925 & 0.004053 \tabularnewline
32 & 0.218906 & 2.398 & 0.009013 \tabularnewline
33 & 0.191995 & 2.1032 & 0.018769 \tabularnewline
34 & 0.166347 & 1.8222 & 0.035454 \tabularnewline
35 & 0.144367 & 1.5815 & 0.058203 \tabularnewline
36 & 0.120542 & 1.3205 & 0.094595 \tabularnewline
37 & 0.091943 & 1.0072 & 0.157936 \tabularnewline
38 & 0.06391 & 0.7001 & 0.242609 \tabularnewline
39 & 0.03891 & 0.4262 & 0.335349 \tabularnewline
40 & 0.013207 & 0.1447 & 0.442606 \tabularnewline
41 & -0.015332 & -0.168 & 0.43345 \tabularnewline
42 & -0.045933 & -0.5032 & 0.307883 \tabularnewline
43 & -0.070215 & -0.7692 & 0.221652 \tabularnewline
44 & -0.092142 & -1.0094 & 0.157415 \tabularnewline
45 & -0.114844 & -1.2581 & 0.105407 \tabularnewline
46 & -0.135949 & -1.4893 & 0.069522 \tabularnewline
47 & -0.153201 & -1.6782 & 0.047952 \tabularnewline
48 & -0.170516 & -1.8679 & 0.032107 \tabularnewline
49 & -0.190236 & -2.0839 & 0.019644 \tabularnewline
50 & -0.20834 & -2.2822 & 0.012118 \tabularnewline
51 & -0.224443 & -2.4586 & 0.007687 \tabularnewline
52 & -0.239694 & -2.6257 & 0.004886 \tabularnewline
53 & -0.258427 & -2.8309 & 0.002722 \tabularnewline
54 & -0.27896 & -3.0559 & 0.001383 \tabularnewline
55 & -0.293741 & -3.2178 & 0.000831 \tabularnewline
56 & -0.305948 & -3.3515 & 0.000538 \tabularnewline
57 & -0.318929 & -3.4937 & 0.000334 \tabularnewline
58 & -0.331225 & -3.6284 & 0.00021 \tabularnewline
59 & -0.339992 & -3.7244 & 0.00015 \tabularnewline
60 & -0.349134 & -3.8246 & 0.000105 \tabularnewline
\hline
\end{tabular}
%Source: https://freestatistics.org/blog/index.php?pk=296240&T=1

[TABLE]
[ROW][C]Autocorrelation Function[/C][/ROW]
[ROW][C]Time lag k[/C][C]ACF(k)[/C][C]T-STAT[/C][C]P-value[/C][/ROW]
[ROW][C]1[/C][C]0.977558[/C][C]10.7086[/C][C]0[/C][/ROW]
[ROW][C]2[/C][C]0.956356[/C][C]10.4764[/C][C]0[/C][/ROW]
[ROW][C]3[/C][C]0.938926[/C][C]10.2854[/C][C]0[/C][/ROW]
[ROW][C]4[/C][C]0.922221[/C][C]10.1024[/C][C]0[/C][/ROW]
[ROW][C]5[/C][C]0.902238[/C][C]9.8835[/C][C]0[/C][/ROW]
[ROW][C]6[/C][C]0.881726[/C][C]9.6588[/C][C]0[/C][/ROW]
[ROW][C]7[/C][C]0.864736[/C][C]9.4727[/C][C]0[/C][/ROW]
[ROW][C]8[/C][C]0.849654[/C][C]9.3075[/C][C]0[/C][/ROW]
[ROW][C]9[/C][C]0.831755[/C][C]9.1114[/C][C]0[/C][/ROW]
[ROW][C]10[/C][C]0.81611[/C][C]8.94[/C][C]0[/C][/ROW]
[ROW][C]11[/C][C]0.801825[/C][C]8.7836[/C][C]0[/C][/ROW]
[ROW][C]12[/C][C]0.782382[/C][C]8.5706[/C][C]0[/C][/ROW]
[ROW][C]13[/C][C]0.75241[/C][C]8.2422[/C][C]0[/C][/ROW]
[ROW][C]14[/C][C]0.722632[/C][C]7.916[/C][C]0[/C][/ROW]
[ROW][C]15[/C][C]0.696374[/C][C]7.6284[/C][C]0[/C][/ROW]
[ROW][C]16[/C][C]0.669556[/C][C]7.3346[/C][C]0[/C][/ROW]
[ROW][C]17[/C][C]0.640497[/C][C]7.0163[/C][C]0[/C][/ROW]
[ROW][C]18[/C][C]0.61027[/C][C]6.6852[/C][C]0[/C][/ROW]
[ROW][C]19[/C][C]0.584333[/C][C]6.401[/C][C]0[/C][/ROW]
[ROW][C]20[/C][C]0.56048[/C][C]6.1398[/C][C]0[/C][/ROW]
[ROW][C]21[/C][C]0.534341[/C][C]5.8534[/C][C]0[/C][/ROW]
[ROW][C]22[/C][C]0.510138[/C][C]5.5883[/C][C]0[/C][/ROW]
[ROW][C]23[/C][C]0.488866[/C][C]5.3553[/C][C]0[/C][/ROW]
[ROW][C]24[/C][C]0.462512[/C][C]5.0666[/C][C]1e-06[/C][/ROW]
[ROW][C]25[/C][C]0.429527[/C][C]4.7052[/C][C]3e-06[/C][/ROW]
[ROW][C]26[/C][C]0.397718[/C][C]4.3568[/C][C]1.4e-05[/C][/ROW]
[ROW][C]27[/C][C]0.369059[/C][C]4.0428[/C][C]4.7e-05[/C][/ROW]
[ROW][C]28[/C][C]0.339647[/C][C]3.7206[/C][C]0.000152[/C][/ROW]
[ROW][C]29[/C][C]0.307989[/C][C]3.3739[/C][C]0.000499[/C][/ROW]
[ROW][C]30[/C][C]0.274758[/C][C]3.0098[/C][C]0.001593[/C][/ROW]
[ROW][C]31[/C][C]0.245793[/C][C]2.6925[/C][C]0.004053[/C][/ROW]
[ROW][C]32[/C][C]0.218906[/C][C]2.398[/C][C]0.009013[/C][/ROW]
[ROW][C]33[/C][C]0.191995[/C][C]2.1032[/C][C]0.018769[/C][/ROW]
[ROW][C]34[/C][C]0.166347[/C][C]1.8222[/C][C]0.035454[/C][/ROW]
[ROW][C]35[/C][C]0.144367[/C][C]1.5815[/C][C]0.058203[/C][/ROW]
[ROW][C]36[/C][C]0.120542[/C][C]1.3205[/C][C]0.094595[/C][/ROW]
[ROW][C]37[/C][C]0.091943[/C][C]1.0072[/C][C]0.157936[/C][/ROW]
[ROW][C]38[/C][C]0.06391[/C][C]0.7001[/C][C]0.242609[/C][/ROW]
[ROW][C]39[/C][C]0.03891[/C][C]0.4262[/C][C]0.335349[/C][/ROW]
[ROW][C]40[/C][C]0.013207[/C][C]0.1447[/C][C]0.442606[/C][/ROW]
[ROW][C]41[/C][C]-0.015332[/C][C]-0.168[/C][C]0.43345[/C][/ROW]
[ROW][C]42[/C][C]-0.045933[/C][C]-0.5032[/C][C]0.307883[/C][/ROW]
[ROW][C]43[/C][C]-0.070215[/C][C]-0.7692[/C][C]0.221652[/C][/ROW]
[ROW][C]44[/C][C]-0.092142[/C][C]-1.0094[/C][C]0.157415[/C][/ROW]
[ROW][C]45[/C][C]-0.114844[/C][C]-1.2581[/C][C]0.105407[/C][/ROW]
[ROW][C]46[/C][C]-0.135949[/C][C]-1.4893[/C][C]0.069522[/C][/ROW]
[ROW][C]47[/C][C]-0.153201[/C][C]-1.6782[/C][C]0.047952[/C][/ROW]
[ROW][C]48[/C][C]-0.170516[/C][C]-1.8679[/C][C]0.032107[/C][/ROW]
[ROW][C]49[/C][C]-0.190236[/C][C]-2.0839[/C][C]0.019644[/C][/ROW]
[ROW][C]50[/C][C]-0.20834[/C][C]-2.2822[/C][C]0.012118[/C][/ROW]
[ROW][C]51[/C][C]-0.224443[/C][C]-2.4586[/C][C]0.007687[/C][/ROW]
[ROW][C]52[/C][C]-0.239694[/C][C]-2.6257[/C][C]0.004886[/C][/ROW]
[ROW][C]53[/C][C]-0.258427[/C][C]-2.8309[/C][C]0.002722[/C][/ROW]
[ROW][C]54[/C][C]-0.27896[/C][C]-3.0559[/C][C]0.001383[/C][/ROW]
[ROW][C]55[/C][C]-0.293741[/C][C]-3.2178[/C][C]0.000831[/C][/ROW]
[ROW][C]56[/C][C]-0.305948[/C][C]-3.3515[/C][C]0.000538[/C][/ROW]
[ROW][C]57[/C][C]-0.318929[/C][C]-3.4937[/C][C]0.000334[/C][/ROW]
[ROW][C]58[/C][C]-0.331225[/C][C]-3.6284[/C][C]0.00021[/C][/ROW]
[ROW][C]59[/C][C]-0.339992[/C][C]-3.7244[/C][C]0.00015[/C][/ROW]
[ROW][C]60[/C][C]-0.349134[/C][C]-3.8246[/C][C]0.000105[/C][/ROW]
[/TABLE]
Source: https://freestatistics.org/blog/index.php?pk=296240&T=1

Globally Unique Identifier (entire table): ba.freestatistics.org/blog/index.php?pk=296240&T=1

As an alternative you can also use a QR Code:  

The GUIDs for individual cells are displayed in the table below:

Autocorrelation Function
Time lag kACF(k)T-STATP-value
10.97755810.70860
20.95635610.47640
30.93892610.28540
40.92222110.10240
50.9022389.88350
60.8817269.65880
70.8647369.47270
80.8496549.30750
90.8317559.11140
100.816118.940
110.8018258.78360
120.7823828.57060
130.752418.24220
140.7226327.9160
150.6963747.62840
160.6695567.33460
170.6404977.01630
180.610276.68520
190.5843336.4010
200.560486.13980
210.5343415.85340
220.5101385.58830
230.4888665.35530
240.4625125.06661e-06
250.4295274.70523e-06
260.3977184.35681.4e-05
270.3690594.04284.7e-05
280.3396473.72060.000152
290.3079893.37390.000499
300.2747583.00980.001593
310.2457932.69250.004053
320.2189062.3980.009013
330.1919952.10320.018769
340.1663471.82220.035454
350.1443671.58150.058203
360.1205421.32050.094595
370.0919431.00720.157936
380.063910.70010.242609
390.038910.42620.335349
400.0132070.14470.442606
41-0.015332-0.1680.43345
42-0.045933-0.50320.307883
43-0.070215-0.76920.221652
44-0.092142-1.00940.157415
45-0.114844-1.25810.105407
46-0.135949-1.48930.069522
47-0.153201-1.67820.047952
48-0.170516-1.86790.032107
49-0.190236-2.08390.019644
50-0.20834-2.28220.012118
51-0.224443-2.45860.007687
52-0.239694-2.62570.004886
53-0.258427-2.83090.002722
54-0.27896-3.05590.001383
55-0.293741-3.21780.000831
56-0.305948-3.35150.000538
57-0.318929-3.49370.000334
58-0.331225-3.62840.00021
59-0.339992-3.72440.00015
60-0.349134-3.82460.000105


Partial Autocorrelation Function
Time lag kPACF(k)T-STATP-value
10.97755810.70860
20.0165920.18180.428042
30.0749230.82070.206712
40.012150.13310.447171
5-0.074812-0.81950.207056
6-0.023522-0.25770.398553
70.0576240.63120.264541
80.0342830.37560.353957
9-0.054419-0.59610.276106
100.0494170.54130.294642
110.0094150.10310.459012
12-0.126698-1.38790.083868
13-0.246913-2.70480.003914
14-0.05006-0.54840.292224
150.0167730.18370.427264
16-0.017788-0.19490.422919
17-0.020279-0.22210.412288
18-0.058051-0.63590.26302
190.0267630.29320.384946
200.0205740.22540.411036
21-0.041031-0.44950.326951
220.0154110.16880.433112
230.0489240.53590.296498
24-0.078675-0.86180.195247
25-0.116574-1.2770.102033
26-0.017612-0.19290.423672
27-0.001899-0.02080.49172
28-0.0181-0.19830.421582
29-0.015032-0.16470.434741
30-0.07461-0.81730.207686
31-0.004405-0.04830.480797
320.0117360.12860.44896
330.0090310.09890.46068
34-0.013164-0.14420.442791
350.0570050.62450.266754
360.0062340.06830.472834
37-0.076341-0.83630.202331
38-0.030975-0.33930.367482
39-0.002742-0.030.488042
40-0.020652-0.22620.410701
41-0.024774-0.27140.393279
42-0.07178-0.78630.216616
430.0366210.40120.344506
440.0119880.13130.447868
45-0.014051-0.15390.438965
46-0.015053-0.16490.43465
470.0320130.35070.363222
480.0186760.20460.419121
49-0.015475-0.16950.432835
500.0158150.17320.431376
51-0.016746-0.18340.427378
520.0278650.30520.380353
53-0.026465-0.28990.386194
54-0.060984-0.6680.252695
550.0167650.18370.427298
560.0152840.16740.433657
570.0004470.00490.49805
58-0.033018-0.36170.359107
590.010380.11370.454829
60-0.033323-0.3650.357863

\begin{tabular}{lllllllll}
\hline
Partial Autocorrelation Function \tabularnewline
Time lag k & PACF(k) & T-STAT & P-value \tabularnewline
1 & 0.977558 & 10.7086 & 0 \tabularnewline
2 & 0.016592 & 0.1818 & 0.428042 \tabularnewline
3 & 0.074923 & 0.8207 & 0.206712 \tabularnewline
4 & 0.01215 & 0.1331 & 0.447171 \tabularnewline
5 & -0.074812 & -0.8195 & 0.207056 \tabularnewline
6 & -0.023522 & -0.2577 & 0.398553 \tabularnewline
7 & 0.057624 & 0.6312 & 0.264541 \tabularnewline
8 & 0.034283 & 0.3756 & 0.353957 \tabularnewline
9 & -0.054419 & -0.5961 & 0.276106 \tabularnewline
10 & 0.049417 & 0.5413 & 0.294642 \tabularnewline
11 & 0.009415 & 0.1031 & 0.459012 \tabularnewline
12 & -0.126698 & -1.3879 & 0.083868 \tabularnewline
13 & -0.246913 & -2.7048 & 0.003914 \tabularnewline
14 & -0.05006 & -0.5484 & 0.292224 \tabularnewline
15 & 0.016773 & 0.1837 & 0.427264 \tabularnewline
16 & -0.017788 & -0.1949 & 0.422919 \tabularnewline
17 & -0.020279 & -0.2221 & 0.412288 \tabularnewline
18 & -0.058051 & -0.6359 & 0.26302 \tabularnewline
19 & 0.026763 & 0.2932 & 0.384946 \tabularnewline
20 & 0.020574 & 0.2254 & 0.411036 \tabularnewline
21 & -0.041031 & -0.4495 & 0.326951 \tabularnewline
22 & 0.015411 & 0.1688 & 0.433112 \tabularnewline
23 & 0.048924 & 0.5359 & 0.296498 \tabularnewline
24 & -0.078675 & -0.8618 & 0.195247 \tabularnewline
25 & -0.116574 & -1.277 & 0.102033 \tabularnewline
26 & -0.017612 & -0.1929 & 0.423672 \tabularnewline
27 & -0.001899 & -0.0208 & 0.49172 \tabularnewline
28 & -0.0181 & -0.1983 & 0.421582 \tabularnewline
29 & -0.015032 & -0.1647 & 0.434741 \tabularnewline
30 & -0.07461 & -0.8173 & 0.207686 \tabularnewline
31 & -0.004405 & -0.0483 & 0.480797 \tabularnewline
32 & 0.011736 & 0.1286 & 0.44896 \tabularnewline
33 & 0.009031 & 0.0989 & 0.46068 \tabularnewline
34 & -0.013164 & -0.1442 & 0.442791 \tabularnewline
35 & 0.057005 & 0.6245 & 0.266754 \tabularnewline
36 & 0.006234 & 0.0683 & 0.472834 \tabularnewline
37 & -0.076341 & -0.8363 & 0.202331 \tabularnewline
38 & -0.030975 & -0.3393 & 0.367482 \tabularnewline
39 & -0.002742 & -0.03 & 0.488042 \tabularnewline
40 & -0.020652 & -0.2262 & 0.410701 \tabularnewline
41 & -0.024774 & -0.2714 & 0.393279 \tabularnewline
42 & -0.07178 & -0.7863 & 0.216616 \tabularnewline
43 & 0.036621 & 0.4012 & 0.344506 \tabularnewline
44 & 0.011988 & 0.1313 & 0.447868 \tabularnewline
45 & -0.014051 & -0.1539 & 0.438965 \tabularnewline
46 & -0.015053 & -0.1649 & 0.43465 \tabularnewline
47 & 0.032013 & 0.3507 & 0.363222 \tabularnewline
48 & 0.018676 & 0.2046 & 0.419121 \tabularnewline
49 & -0.015475 & -0.1695 & 0.432835 \tabularnewline
50 & 0.015815 & 0.1732 & 0.431376 \tabularnewline
51 & -0.016746 & -0.1834 & 0.427378 \tabularnewline
52 & 0.027865 & 0.3052 & 0.380353 \tabularnewline
53 & -0.026465 & -0.2899 & 0.386194 \tabularnewline
54 & -0.060984 & -0.668 & 0.252695 \tabularnewline
55 & 0.016765 & 0.1837 & 0.427298 \tabularnewline
56 & 0.015284 & 0.1674 & 0.433657 \tabularnewline
57 & 0.000447 & 0.0049 & 0.49805 \tabularnewline
58 & -0.033018 & -0.3617 & 0.359107 \tabularnewline
59 & 0.01038 & 0.1137 & 0.454829 \tabularnewline
60 & -0.033323 & -0.365 & 0.357863 \tabularnewline
\hline
\end{tabular}
%Source: https://freestatistics.org/blog/index.php?pk=296240&T=2

[TABLE]
[ROW][C]Partial Autocorrelation Function[/C][/ROW]
[ROW][C]Time lag k[/C][C]PACF(k)[/C][C]T-STAT[/C][C]P-value[/C][/ROW]
[ROW][C]1[/C][C]0.977558[/C][C]10.7086[/C][C]0[/C][/ROW]
[ROW][C]2[/C][C]0.016592[/C][C]0.1818[/C][C]0.428042[/C][/ROW]
[ROW][C]3[/C][C]0.074923[/C][C]0.8207[/C][C]0.206712[/C][/ROW]
[ROW][C]4[/C][C]0.01215[/C][C]0.1331[/C][C]0.447171[/C][/ROW]
[ROW][C]5[/C][C]-0.074812[/C][C]-0.8195[/C][C]0.207056[/C][/ROW]
[ROW][C]6[/C][C]-0.023522[/C][C]-0.2577[/C][C]0.398553[/C][/ROW]
[ROW][C]7[/C][C]0.057624[/C][C]0.6312[/C][C]0.264541[/C][/ROW]
[ROW][C]8[/C][C]0.034283[/C][C]0.3756[/C][C]0.353957[/C][/ROW]
[ROW][C]9[/C][C]-0.054419[/C][C]-0.5961[/C][C]0.276106[/C][/ROW]
[ROW][C]10[/C][C]0.049417[/C][C]0.5413[/C][C]0.294642[/C][/ROW]
[ROW][C]11[/C][C]0.009415[/C][C]0.1031[/C][C]0.459012[/C][/ROW]
[ROW][C]12[/C][C]-0.126698[/C][C]-1.3879[/C][C]0.083868[/C][/ROW]
[ROW][C]13[/C][C]-0.246913[/C][C]-2.7048[/C][C]0.003914[/C][/ROW]
[ROW][C]14[/C][C]-0.05006[/C][C]-0.5484[/C][C]0.292224[/C][/ROW]
[ROW][C]15[/C][C]0.016773[/C][C]0.1837[/C][C]0.427264[/C][/ROW]
[ROW][C]16[/C][C]-0.017788[/C][C]-0.1949[/C][C]0.422919[/C][/ROW]
[ROW][C]17[/C][C]-0.020279[/C][C]-0.2221[/C][C]0.412288[/C][/ROW]
[ROW][C]18[/C][C]-0.058051[/C][C]-0.6359[/C][C]0.26302[/C][/ROW]
[ROW][C]19[/C][C]0.026763[/C][C]0.2932[/C][C]0.384946[/C][/ROW]
[ROW][C]20[/C][C]0.020574[/C][C]0.2254[/C][C]0.411036[/C][/ROW]
[ROW][C]21[/C][C]-0.041031[/C][C]-0.4495[/C][C]0.326951[/C][/ROW]
[ROW][C]22[/C][C]0.015411[/C][C]0.1688[/C][C]0.433112[/C][/ROW]
[ROW][C]23[/C][C]0.048924[/C][C]0.5359[/C][C]0.296498[/C][/ROW]
[ROW][C]24[/C][C]-0.078675[/C][C]-0.8618[/C][C]0.195247[/C][/ROW]
[ROW][C]25[/C][C]-0.116574[/C][C]-1.277[/C][C]0.102033[/C][/ROW]
[ROW][C]26[/C][C]-0.017612[/C][C]-0.1929[/C][C]0.423672[/C][/ROW]
[ROW][C]27[/C][C]-0.001899[/C][C]-0.0208[/C][C]0.49172[/C][/ROW]
[ROW][C]28[/C][C]-0.0181[/C][C]-0.1983[/C][C]0.421582[/C][/ROW]
[ROW][C]29[/C][C]-0.015032[/C][C]-0.1647[/C][C]0.434741[/C][/ROW]
[ROW][C]30[/C][C]-0.07461[/C][C]-0.8173[/C][C]0.207686[/C][/ROW]
[ROW][C]31[/C][C]-0.004405[/C][C]-0.0483[/C][C]0.480797[/C][/ROW]
[ROW][C]32[/C][C]0.011736[/C][C]0.1286[/C][C]0.44896[/C][/ROW]
[ROW][C]33[/C][C]0.009031[/C][C]0.0989[/C][C]0.46068[/C][/ROW]
[ROW][C]34[/C][C]-0.013164[/C][C]-0.1442[/C][C]0.442791[/C][/ROW]
[ROW][C]35[/C][C]0.057005[/C][C]0.6245[/C][C]0.266754[/C][/ROW]
[ROW][C]36[/C][C]0.006234[/C][C]0.0683[/C][C]0.472834[/C][/ROW]
[ROW][C]37[/C][C]-0.076341[/C][C]-0.8363[/C][C]0.202331[/C][/ROW]
[ROW][C]38[/C][C]-0.030975[/C][C]-0.3393[/C][C]0.367482[/C][/ROW]
[ROW][C]39[/C][C]-0.002742[/C][C]-0.03[/C][C]0.488042[/C][/ROW]
[ROW][C]40[/C][C]-0.020652[/C][C]-0.2262[/C][C]0.410701[/C][/ROW]
[ROW][C]41[/C][C]-0.024774[/C][C]-0.2714[/C][C]0.393279[/C][/ROW]
[ROW][C]42[/C][C]-0.07178[/C][C]-0.7863[/C][C]0.216616[/C][/ROW]
[ROW][C]43[/C][C]0.036621[/C][C]0.4012[/C][C]0.344506[/C][/ROW]
[ROW][C]44[/C][C]0.011988[/C][C]0.1313[/C][C]0.447868[/C][/ROW]
[ROW][C]45[/C][C]-0.014051[/C][C]-0.1539[/C][C]0.438965[/C][/ROW]
[ROW][C]46[/C][C]-0.015053[/C][C]-0.1649[/C][C]0.43465[/C][/ROW]
[ROW][C]47[/C][C]0.032013[/C][C]0.3507[/C][C]0.363222[/C][/ROW]
[ROW][C]48[/C][C]0.018676[/C][C]0.2046[/C][C]0.419121[/C][/ROW]
[ROW][C]49[/C][C]-0.015475[/C][C]-0.1695[/C][C]0.432835[/C][/ROW]
[ROW][C]50[/C][C]0.015815[/C][C]0.1732[/C][C]0.431376[/C][/ROW]
[ROW][C]51[/C][C]-0.016746[/C][C]-0.1834[/C][C]0.427378[/C][/ROW]
[ROW][C]52[/C][C]0.027865[/C][C]0.3052[/C][C]0.380353[/C][/ROW]
[ROW][C]53[/C][C]-0.026465[/C][C]-0.2899[/C][C]0.386194[/C][/ROW]
[ROW][C]54[/C][C]-0.060984[/C][C]-0.668[/C][C]0.252695[/C][/ROW]
[ROW][C]55[/C][C]0.016765[/C][C]0.1837[/C][C]0.427298[/C][/ROW]
[ROW][C]56[/C][C]0.015284[/C][C]0.1674[/C][C]0.433657[/C][/ROW]
[ROW][C]57[/C][C]0.000447[/C][C]0.0049[/C][C]0.49805[/C][/ROW]
[ROW][C]58[/C][C]-0.033018[/C][C]-0.3617[/C][C]0.359107[/C][/ROW]
[ROW][C]59[/C][C]0.01038[/C][C]0.1137[/C][C]0.454829[/C][/ROW]
[ROW][C]60[/C][C]-0.033323[/C][C]-0.365[/C][C]0.357863[/C][/ROW]
[/TABLE]
Source: https://freestatistics.org/blog/index.php?pk=296240&T=2

Globally Unique Identifier (entire table): ba.freestatistics.org/blog/index.php?pk=296240&T=2

As an alternative you can also use a QR Code:  

The GUIDs for individual cells are displayed in the table below:

Partial Autocorrelation Function
Time lag kPACF(k)T-STATP-value
10.97755810.70860
20.0165920.18180.428042
30.0749230.82070.206712
40.012150.13310.447171
5-0.074812-0.81950.207056
6-0.023522-0.25770.398553
70.0576240.63120.264541
80.0342830.37560.353957
9-0.054419-0.59610.276106
100.0494170.54130.294642
110.0094150.10310.459012
12-0.126698-1.38790.083868
13-0.246913-2.70480.003914
14-0.05006-0.54840.292224
150.0167730.18370.427264
16-0.017788-0.19490.422919
17-0.020279-0.22210.412288
18-0.058051-0.63590.26302
190.0267630.29320.384946
200.0205740.22540.411036
21-0.041031-0.44950.326951
220.0154110.16880.433112
230.0489240.53590.296498
24-0.078675-0.86180.195247
25-0.116574-1.2770.102033
26-0.017612-0.19290.423672
27-0.001899-0.02080.49172
28-0.0181-0.19830.421582
29-0.015032-0.16470.434741
30-0.07461-0.81730.207686
31-0.004405-0.04830.480797
320.0117360.12860.44896
330.0090310.09890.46068
34-0.013164-0.14420.442791
350.0570050.62450.266754
360.0062340.06830.472834
37-0.076341-0.83630.202331
38-0.030975-0.33930.367482
39-0.002742-0.030.488042
40-0.020652-0.22620.410701
41-0.024774-0.27140.393279
42-0.07178-0.78630.216616
430.0366210.40120.344506
440.0119880.13130.447868
45-0.014051-0.15390.438965
46-0.015053-0.16490.43465
470.0320130.35070.363222
480.0186760.20460.419121
49-0.015475-0.16950.432835
500.0158150.17320.431376
51-0.016746-0.18340.427378
520.0278650.30520.380353
53-0.026465-0.28990.386194
54-0.060984-0.6680.252695
550.0167650.18370.427298
560.0152840.16740.433657
570.0004470.00490.49805
58-0.033018-0.36170.359107
590.010380.11370.454829
60-0.033323-0.3650.357863


Parameters (Session):
par1 = 60 ; par2 = 1 ; par3 = 0 ; par4 = 0 ; par5 = 12 ; par6 = White Noise ; par7 = 0.95 ;
Parameters (R input):
par1 = 60 ; par2 = 1 ; par3 = 0 ; par4 = 0 ; par5 = 12 ; par6 = White Noise ; par7 = 0.95 ; par8 = ;
R code (references can be found in the software module):
if (par1 == 'Default') {
par1 = 10*log10(length(x))
} else {
par1 <- as.numeric(par1)
}
par2 <- as.numeric(par2)
par3 <- as.numeric(par3)
par4 <- as.numeric(par4)
par5 <- as.numeric(par5)
if (par6 == 'White Noise') par6 <- 'white' else par6 <- 'ma'
par7 <- as.numeric(par7)
if (par8 != '') par8 <- as.numeric(par8)
x <- na.omit(x)
ox <- x
if (par8 == '') {
if (par2 == 0) {
x <- log(x)
} else {
x <- (x ^ par2 - 1) / par2
}
} else {
x <- log(x,base=par8)
}
if (par3 > 0) x <- diff(x,lag=1,difference=par3)
if (par4 > 0) x <- diff(x,lag=par5,difference=par4)
bitmap(file='picts.png')
op <- par(mfrow=c(2,1))
plot(ox,type='l',main='Original Time Series',xlab='time',ylab='value')
if (par8=='') {
mytitle <- paste('Working Time Series (lambda=',par2,', d=',par3,', D=',par4,')',sep='')
mysub <- paste('(lambda=',par2,', d=',par3,', D=',par4,', CI=', par7, ', CI type=',par6,')',sep='')
} else {
mytitle <- paste('Working Time Series (base=',par8,', d=',par3,', D=',par4,')',sep='')
mysub <- paste('(base=',par8,', d=',par3,', D=',par4,', CI=', par7, ', CI type=',par6,')',sep='')
}
plot(x,type='l', main=mytitle,xlab='time',ylab='value')
par(op)
dev.off()
bitmap(file='pic1.png')
racf <- acf(x, par1, main='Autocorrelation', xlab='time lag', ylab='ACF', ci.type=par6, ci=par7, sub=mysub)
dev.off()
bitmap(file='pic2.png')
rpacf <- pacf(x,par1,main='Partial Autocorrelation',xlab='lags',ylab='PACF',sub=mysub)
dev.off()
(myacf <- c(racf$acf))
(mypacf <- c(rpacf$acf))
lengthx <- length(x)
sqrtn <- sqrt(lengthx)
load(file='createtable')
a<-table.start()
a<-table.row.start(a)
a<-table.element(a,'Autocorrelation Function',4,TRUE)
a<-table.row.end(a)
a<-table.row.start(a)
a<-table.element(a,'Time lag k',header=TRUE)
a<-table.element(a,hyperlink('basics.htm','ACF(k)','click here for more information about the Autocorrelation Function'),header=TRUE)
a<-table.element(a,'T-STAT',header=TRUE)
a<-table.element(a,'P-value',header=TRUE)
a<-table.row.end(a)
for (i in 2:(par1+1)) {
a<-table.row.start(a)
a<-table.element(a,i-1,header=TRUE)
a<-table.element(a,round(myacf[i],6))
mytstat <- myacf[i]*sqrtn
a<-table.element(a,round(mytstat,4))
a<-table.element(a,round(1-pt(abs(mytstat),lengthx),6))
a<-table.row.end(a)
}
a<-table.end(a)
table.save(a,file='mytable.tab')
a<-table.start()
a<-table.row.start(a)
a<-table.element(a,'Partial Autocorrelation Function',4,TRUE)
a<-table.row.end(a)
a<-table.row.start(a)
a<-table.element(a,'Time lag k',header=TRUE)
a<-table.element(a,hyperlink('basics.htm','PACF(k)','click here for more information about the Partial Autocorrelation Function'),header=TRUE)
a<-table.element(a,'T-STAT',header=TRUE)
a<-table.element(a,'P-value',header=TRUE)
a<-table.row.end(a)
for (i in 1:par1) {
a<-table.row.start(a)
a<-table.element(a,i,header=TRUE)
a<-table.element(a,round(mypacf[i],6))
mytstat <- mypacf[i]*sqrtn
a<-table.element(a,round(mytstat,4))
a<-table.element(a,round(1-pt(abs(mytstat),lengthx),6))
a<-table.row.end(a)
}
a<-table.end(a)
table.save(a,file='mytable1.tab')