Free Statistics

of Irreproducible Research!

Author's title

Author*Unverified author*
R Software Modulerwasp_smp.wasp
Title produced by softwareStandard Deviation-Mean Plot
Date of computationThu, 11 Aug 2016 01:08:38 +0100
Cite this page as followsStatistical Computations at FreeStatistics.org, Office for Research Development and Education, URL https://freestatistics.org/blog/index.php?v=date/2016/Aug/11/t1470874202oqcxgjck4gl4bmo.htm/, Retrieved Sun, 05 May 2024 13:06:42 +0000
Statistical Computations at FreeStatistics.org, Office for Research Development and Education, URL https://freestatistics.org/blog/index.php?pk=296285, Retrieved Sun, 05 May 2024 13:06:42 +0000
QR Codes:

Original text written by user:
IsPrivate?No (this computation is public)
User-defined keywords
Estimated Impact102
Family? (F = Feedback message, R = changed R code, M = changed R Module, P = changed Parameters, D = changed Data)
-       [Standard Deviation-Mean Plot] [] [2016-08-11 00:08:38] [dce1b7f6243247e331d0750a8103b593] [Current]
Feedback Forum

Post a new message
Dataseries X:
840
880
930
920
940
880
980
860
900
930
870
1000
870
860
930
980
1010
860
1140
880
800
900
900
1000
890
890
870
1000
1050
790
1160
830
730
950
980
910
840
860
880
1030
1060
770
1140
890
740
860
1050
840
810
830
920
1070
1040
740
1250
850
790
810
1080
760
840
820
900
1010
1080
780
1150
820
790
820
1130
800
890
810
950
1090
1090
850
1200
790
800
850
1230
800
930
700
1030
1040
1000
830
1190
720
810
870
1190
800
970
690
1010
1030
950
830
1150
750
840
880
1210
830


Summary of computational transaction
Raw Inputview raw input (R code)
Raw Outputview raw output of R engine
Computing time1 seconds
R Server'Sir Ronald Aylmer Fisher' @ fisher.wessa.net

\begin{tabular}{lllllllll}
\hline
Summary of computational transaction \tabularnewline
Raw Input & view raw input (R code)  \tabularnewline
Raw Output & view raw output of R engine  \tabularnewline
Computing time & 1 seconds \tabularnewline
R Server & 'Sir Ronald Aylmer Fisher' @ fisher.wessa.net \tabularnewline
\hline
\end{tabular}
%Source: https://freestatistics.org/blog/index.php?pk=296285&T=0

[TABLE]
[ROW][C]Summary of computational transaction[/C][/ROW]
[ROW][C]Raw Input[/C][C]view raw input (R code) [/C][/ROW]
[ROW][C]Raw Output[/C][C]view raw output of R engine [/C][/ROW]
[ROW][C]Computing time[/C][C]1 seconds[/C][/ROW]
[ROW][C]R Server[/C][C]'Sir Ronald Aylmer Fisher' @ fisher.wessa.net[/C][/ROW]
[/TABLE]
Source: https://freestatistics.org/blog/index.php?pk=296285&T=0

Globally Unique Identifier (entire table): ba.freestatistics.org/blog/index.php?pk=296285&T=0

As an alternative you can also use a QR Code:  

The GUIDs for individual cells are displayed in the table below:

Summary of computational transaction
Raw Inputview raw input (R code)
Raw Outputview raw output of R engine
Computing time1 seconds
R Server'Sir Ronald Aylmer Fisher' @ fisher.wessa.net


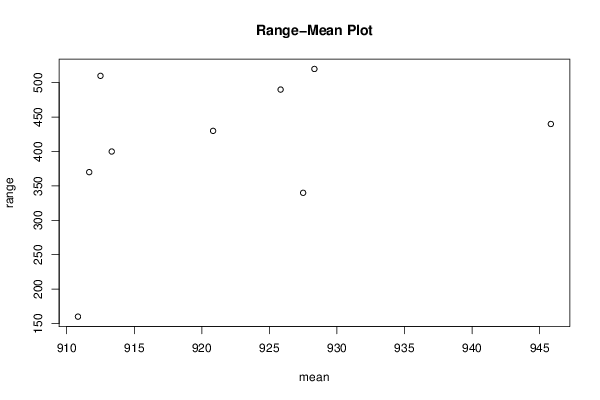
Standard Deviation-Mean Plot
SectionMeanStandard DeviationRange
1910.83333333333348.3281083905222160
2927.591.663911804334340
3920.833333333333117.1214081303430
4913.333333333333125.722156384866400
5912.5160.347633709898510
6911.666666666667140.637078605849370
7945.833333333333163.399028223066440
8925.833333333333166.212259329795490
9928.333333333333155.436823374019520

\begin{tabular}{lllllllll}
\hline
Standard Deviation-Mean Plot \tabularnewline
Section & Mean & Standard Deviation & Range \tabularnewline
1 & 910.833333333333 & 48.3281083905222 & 160 \tabularnewline
2 & 927.5 & 91.663911804334 & 340 \tabularnewline
3 & 920.833333333333 & 117.1214081303 & 430 \tabularnewline
4 & 913.333333333333 & 125.722156384866 & 400 \tabularnewline
5 & 912.5 & 160.347633709898 & 510 \tabularnewline
6 & 911.666666666667 & 140.637078605849 & 370 \tabularnewline
7 & 945.833333333333 & 163.399028223066 & 440 \tabularnewline
8 & 925.833333333333 & 166.212259329795 & 490 \tabularnewline
9 & 928.333333333333 & 155.436823374019 & 520 \tabularnewline
\hline
\end{tabular}
%Source: https://freestatistics.org/blog/index.php?pk=296285&T=1

[TABLE]
[ROW][C]Standard Deviation-Mean Plot[/C][/ROW]
[ROW][C]Section[/C][C]Mean[/C][C]Standard Deviation[/C][C]Range[/C][/ROW]
[ROW][C]1[/C][C]910.833333333333[/C][C]48.3281083905222[/C][C]160[/C][/ROW]
[ROW][C]2[/C][C]927.5[/C][C]91.663911804334[/C][C]340[/C][/ROW]
[ROW][C]3[/C][C]920.833333333333[/C][C]117.1214081303[/C][C]430[/C][/ROW]
[ROW][C]4[/C][C]913.333333333333[/C][C]125.722156384866[/C][C]400[/C][/ROW]
[ROW][C]5[/C][C]912.5[/C][C]160.347633709898[/C][C]510[/C][/ROW]
[ROW][C]6[/C][C]911.666666666667[/C][C]140.637078605849[/C][C]370[/C][/ROW]
[ROW][C]7[/C][C]945.833333333333[/C][C]163.399028223066[/C][C]440[/C][/ROW]
[ROW][C]8[/C][C]925.833333333333[/C][C]166.212259329795[/C][C]490[/C][/ROW]
[ROW][C]9[/C][C]928.333333333333[/C][C]155.436823374019[/C][C]520[/C][/ROW]
[/TABLE]
Source: https://freestatistics.org/blog/index.php?pk=296285&T=1

Globally Unique Identifier (entire table): ba.freestatistics.org/blog/index.php?pk=296285&T=1

As an alternative you can also use a QR Code:  

The GUIDs for individual cells are displayed in the table below:

Standard Deviation-Mean Plot
SectionMeanStandard DeviationRange
1910.83333333333348.3281083905222160
2927.591.663911804334340
3920.833333333333117.1214081303430
4913.333333333333125.722156384866400
5912.5160.347633709898510
6911.666666666667140.637078605849370
7945.833333333333163.399028223066440
8925.833333333333166.212259329795490
9928.333333333333155.436823374019520


Regression: S.E.(k) = alpha + beta * Mean(k)
alpha-1142.5446707739
beta1.3802857105164
S.D.1.19059382885874
T-STAT1.15932543665164
p-value0.284336677029027

\begin{tabular}{lllllllll}
\hline
Regression: S.E.(k) = alpha + beta * Mean(k) \tabularnewline
alpha & -1142.5446707739 \tabularnewline
beta & 1.3802857105164 \tabularnewline
S.D. & 1.19059382885874 \tabularnewline
T-STAT & 1.15932543665164 \tabularnewline
p-value & 0.284336677029027 \tabularnewline
\hline
\end{tabular}
%Source: https://freestatistics.org/blog/index.php?pk=296285&T=2

[TABLE]
[ROW][C]Regression: S.E.(k) = alpha + beta * Mean(k)[/C][/ROW]
[ROW][C]alpha[/C][C]-1142.5446707739[/C][/ROW]
[ROW][C]beta[/C][C]1.3802857105164[/C][/ROW]
[ROW][C]S.D.[/C][C]1.19059382885874[/C][/ROW]
[ROW][C]T-STAT[/C][C]1.15932543665164[/C][/ROW]
[ROW][C]p-value[/C][C]0.284336677029027[/C][/ROW]
[/TABLE]
Source: https://freestatistics.org/blog/index.php?pk=296285&T=2

Globally Unique Identifier (entire table): ba.freestatistics.org/blog/index.php?pk=296285&T=2

As an alternative you can also use a QR Code:  

The GUIDs for individual cells are displayed in the table below:

Regression: S.E.(k) = alpha + beta * Mean(k)
alpha-1142.5446707739
beta1.3802857105164
S.D.1.19059382885874
T-STAT1.15932543665164
p-value0.284336677029027


Regression: ln S.E.(k) = alpha + beta * ln Mean(k)
alpha-80.6635871049896
beta12.5209052904113
S.D.11.2503470773501
T-STAT1.11293502363311
p-value0.302489256378107
Lambda-11.5209052904113

\begin{tabular}{lllllllll}
\hline
Regression: ln S.E.(k) = alpha + beta * ln Mean(k) \tabularnewline
alpha & -80.6635871049896 \tabularnewline
beta & 12.5209052904113 \tabularnewline
S.D. & 11.2503470773501 \tabularnewline
T-STAT & 1.11293502363311 \tabularnewline
p-value & 0.302489256378107 \tabularnewline
Lambda & -11.5209052904113 \tabularnewline
\hline
\end{tabular}
%Source: https://freestatistics.org/blog/index.php?pk=296285&T=3

[TABLE]
[ROW][C]Regression: ln S.E.(k) = alpha + beta * ln Mean(k)[/C][/ROW]
[ROW][C]alpha[/C][C]-80.6635871049896[/C][/ROW]
[ROW][C]beta[/C][C]12.5209052904113[/C][/ROW]
[ROW][C]S.D.[/C][C]11.2503470773501[/C][/ROW]
[ROW][C]T-STAT[/C][C]1.11293502363311[/C][/ROW]
[ROW][C]p-value[/C][C]0.302489256378107[/C][/ROW]
[ROW][C]Lambda[/C][C]-11.5209052904113[/C][/ROW]
[/TABLE]
Source: https://freestatistics.org/blog/index.php?pk=296285&T=3

Globally Unique Identifier (entire table): ba.freestatistics.org/blog/index.php?pk=296285&T=3

As an alternative you can also use a QR Code:  

The GUIDs for individual cells are displayed in the table below:

Regression: ln S.E.(k) = alpha + beta * ln Mean(k)
alpha-80.6635871049896
beta12.5209052904113
S.D.11.2503470773501
T-STAT1.11293502363311
p-value0.302489256378107
Lambda-11.5209052904113


Parameters (Session):
par1 = 12 ;
Parameters (R input):
par1 = 12 ;
R code (references can be found in the software module):
par1 <- as.numeric(par1)
(n <- length(x))
(np <- floor(n / par1))
arr <- array(NA,dim=c(par1,np))
j <- 0
k <- 1
for (i in 1:(np*par1))
{
j = j + 1
arr[j,k] <- x[i]
if (j == par1) {
j = 0
k=k+1
}
}
arr
arr.mean <- array(NA,dim=np)
arr.sd <- array(NA,dim=np)
arr.range <- array(NA,dim=np)
for (j in 1:np)
{
arr.mean[j] <- mean(arr[,j],na.rm=TRUE)
arr.sd[j] <- sd(arr[,j],na.rm=TRUE)
arr.range[j] <- max(arr[,j],na.rm=TRUE) - min(arr[,j],na.rm=TRUE)
}
arr.mean
arr.sd
arr.range
(lm1 <- lm(arr.sd~arr.mean))
(lnlm1 <- lm(log(arr.sd)~log(arr.mean)))
(lm2 <- lm(arr.range~arr.mean))
bitmap(file='test1.png')
plot(arr.mean,arr.sd,main='Standard Deviation-Mean Plot',xlab='mean',ylab='standard deviation')
dev.off()
bitmap(file='test2.png')
plot(arr.mean,arr.range,main='Range-Mean Plot',xlab='mean',ylab='range')
dev.off()
load(file='createtable')
a<-table.start()
a<-table.row.start(a)
a<-table.element(a,'Standard Deviation-Mean Plot',4,TRUE)
a<-table.row.end(a)
a<-table.row.start(a)
a<-table.element(a,'Section',header=TRUE)
a<-table.element(a,'Mean',header=TRUE)
a<-table.element(a,'Standard Deviation',header=TRUE)
a<-table.element(a,'Range',header=TRUE)
a<-table.row.end(a)
for (j in 1:np) {
a<-table.row.start(a)
a<-table.element(a,j,header=TRUE)
a<-table.element(a,arr.mean[j])
a<-table.element(a,arr.sd[j] )
a<-table.element(a,arr.range[j] )
a<-table.row.end(a)
}
a<-table.end(a)
table.save(a,file='mytable.tab')
a<-table.start()
a<-table.row.start(a)
a<-table.element(a,'Regression: S.E.(k) = alpha + beta * Mean(k)',2,TRUE)
a<-table.row.end(a)
a<-table.row.start(a)
a<-table.element(a,'alpha',header=TRUE)
a<-table.element(a,lm1$coefficients[[1]])
a<-table.row.end(a)
a<-table.row.start(a)
a<-table.element(a,'beta',header=TRUE)
a<-table.element(a,lm1$coefficients[[2]])
a<-table.row.end(a)
a<-table.row.start(a)
a<-table.element(a,'S.D.',header=TRUE)
a<-table.element(a,summary(lm1)$coefficients[2,2])
a<-table.row.end(a)
a<-table.row.start(a)
a<-table.element(a,'T-STAT',header=TRUE)
a<-table.element(a,summary(lm1)$coefficients[2,3])
a<-table.row.end(a)
a<-table.row.start(a)
a<-table.element(a,'p-value',header=TRUE)
a<-table.element(a,summary(lm1)$coefficients[2,4])
a<-table.row.end(a)
a<-table.end(a)
table.save(a,file='mytable1.tab')
a<-table.start()
a<-table.row.start(a)
a<-table.element(a,'Regression: ln S.E.(k) = alpha + beta * ln Mean(k)',2,TRUE)
a<-table.row.end(a)
a<-table.row.start(a)
a<-table.element(a,'alpha',header=TRUE)
a<-table.element(a,lnlm1$coefficients[[1]])
a<-table.row.end(a)
a<-table.row.start(a)
a<-table.element(a,'beta',header=TRUE)
a<-table.element(a,lnlm1$coefficients[[2]])
a<-table.row.end(a)
a<-table.row.start(a)
a<-table.element(a,'S.D.',header=TRUE)
a<-table.element(a,summary(lnlm1)$coefficients[2,2])
a<-table.row.end(a)
a<-table.row.start(a)
a<-table.element(a,'T-STAT',header=TRUE)
a<-table.element(a,summary(lnlm1)$coefficients[2,3])
a<-table.row.end(a)
a<-table.row.start(a)
a<-table.element(a,'p-value',header=TRUE)
a<-table.element(a,summary(lnlm1)$coefficients[2,4])
a<-table.row.end(a)
a<-table.row.start(a)
a<-table.element(a,'Lambda',header=TRUE)
a<-table.element(a,1-lnlm1$coefficients[[2]])
a<-table.row.end(a)
a<-table.end(a)
table.save(a,file='mytable2.tab')