Free Statistics

of Irreproducible Research!

Author's title

Author*Unverified author*
R Software Modulerwasp_autocorrelation.wasp
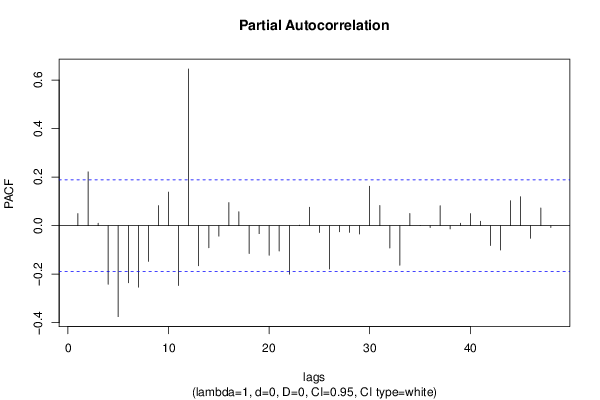
Title produced by software(Partial) Autocorrelation Function
Date of computationFri, 12 Aug 2016 09:54:26 +0100
Cite this page as followsStatistical Computations at FreeStatistics.org, Office for Research Development and Education, URL https://freestatistics.org/blog/index.php?v=date/2016/Aug/12/t1470992092lag65gsu1cni8q2.htm/, Retrieved Sun, 05 May 2024 10:09:05 +0000
Statistical Computations at FreeStatistics.org, Office for Research Development and Education, URL https://freestatistics.org/blog/index.php?pk=296405, Retrieved Sun, 05 May 2024 10:09:05 +0000
QR Codes:

Original text written by user:
IsPrivate?No (this computation is public)
User-defined keywords
Estimated Impact108
Family? (F = Feedback message, R = changed R code, M = changed R Module, P = changed Parameters, D = changed Data)
-       [(Partial) Autocorrelation Function] [Reeks B stap 17] [2016-08-12 08:54:26] [d41d8cd98f00b204e9800998ecf8427e] [Current]
Feedback Forum

Post a new message
Dataseries X:
1410
1425
1380
1395
1395
1350
1410
1260
1335
1275
1245
1410
1440
1350
1410
1380
1395
1455
1395
1170
1215
1305
1080
1320
1380
1380
1425
1425
1335
1440
1170
1170
1140
1290
1110
1530
1335
1560
1380
1350
1425
1485
1260
1110
1260
1440
1185
1515
1350
1455
1380
1470
1335
1500
1320
1110
1290
1410
1140
1515
1305
1470
1380
1425
1320
1470
1365
1095
1320
1230
1035
1485
1200
1440
1365
1425
1410
1515
1335
990
1290
1260
1110
1470
1230
1620
1395
1455
1395
1515
1320
1110
1290
1215
1125
1335
1185
1500
1335
1455
1350
1485
1365
1095
1275
1260
1245
1425


Summary of computational transaction
Raw Inputview raw input (R code)
Raw Outputview raw output of R engine
Computing time1 seconds
R Server'Sir Ronald Aylmer Fisher' @ fisher.wessa.net

\begin{tabular}{lllllllll}
\hline
Summary of computational transaction \tabularnewline
Raw Input & view raw input (R code)  \tabularnewline
Raw Output & view raw output of R engine  \tabularnewline
Computing time & 1 seconds \tabularnewline
R Server & 'Sir Ronald Aylmer Fisher' @ fisher.wessa.net \tabularnewline
\hline
\end{tabular}
%Source: https://freestatistics.org/blog/index.php?pk=296405&T=0

[TABLE]
[ROW][C]Summary of computational transaction[/C][/ROW]
[ROW][C]Raw Input[/C][C]view raw input (R code) [/C][/ROW]
[ROW][C]Raw Output[/C][C]view raw output of R engine [/C][/ROW]
[ROW][C]Computing time[/C][C]1 seconds[/C][/ROW]
[ROW][C]R Server[/C][C]'Sir Ronald Aylmer Fisher' @ fisher.wessa.net[/C][/ROW]
[/TABLE]
Source: https://freestatistics.org/blog/index.php?pk=296405&T=0

Globally Unique Identifier (entire table): ba.freestatistics.org/blog/index.php?pk=296405&T=0

As an alternative you can also use a QR Code:  

The GUIDs for individual cells are displayed in the table below:

Summary of computational transaction
Raw Inputview raw input (R code)
Raw Outputview raw output of R engine
Computing time1 seconds
R Server'Sir Ronald Aylmer Fisher' @ fisher.wessa.net


Autocorrelation Function
Time lag kACF(k)T-STATP-value
10.0497540.51710.303086
20.2235122.32280.011032
30.029130.30270.381339
4-0.17786-1.84840.033642
5-0.341658-3.55060.000285
6-0.279037-2.89980.002262
7-0.352349-3.66170.000195
8-0.164452-1.7090.045159
90.0705460.73310.232533
100.1753641.82240.035578
110.0526480.54710.292707
120.7781718.0870
13-0.010195-0.1060.457909
140.203272.11240.018476
15-0.026025-0.27050.393663
16-0.144526-1.5020.068013
17-0.282297-2.93370.002046
18-0.262412-2.72710.00373
19-0.318328-3.30820.000638
20-0.176693-1.83620.034536
210.0505190.5250.300326
220.060580.62960.265155
230.0509330.52930.298837
240.6270216.51620
25-0.011123-0.11560.454095
260.1868931.94220.027356
27-0.019446-0.20210.420114
28-0.106626-1.10810.135142
29-0.2222-2.30920.011418
30-0.17372-1.80540.036903
31-0.257437-2.67540.004313
32-0.17337-1.80170.03719
330.0467070.48540.314189
340.0178470.18550.426602
350.0439370.45660.324434
360.5004515.20080
370.0160860.16720.433774
380.1726771.79450.037765
390.0358570.37260.355076
40-0.006778-0.07040.471987
41-0.152271-1.58240.058236
42-0.132736-1.37940.085305
43-0.250436-2.60260.005275
44-0.153432-1.59450.056872
450.0366920.38130.351861
46-0.031375-0.32610.372505
470.0765560.79560.214007
480.4013454.17093.1e-05

\begin{tabular}{lllllllll}
\hline
Autocorrelation Function \tabularnewline
Time lag k & ACF(k) & T-STAT & P-value \tabularnewline
1 & 0.049754 & 0.5171 & 0.303086 \tabularnewline
2 & 0.223512 & 2.3228 & 0.011032 \tabularnewline
3 & 0.02913 & 0.3027 & 0.381339 \tabularnewline
4 & -0.17786 & -1.8484 & 0.033642 \tabularnewline
5 & -0.341658 & -3.5506 & 0.000285 \tabularnewline
6 & -0.279037 & -2.8998 & 0.002262 \tabularnewline
7 & -0.352349 & -3.6617 & 0.000195 \tabularnewline
8 & -0.164452 & -1.709 & 0.045159 \tabularnewline
9 & 0.070546 & 0.7331 & 0.232533 \tabularnewline
10 & 0.175364 & 1.8224 & 0.035578 \tabularnewline
11 & 0.052648 & 0.5471 & 0.292707 \tabularnewline
12 & 0.778171 & 8.087 & 0 \tabularnewline
13 & -0.010195 & -0.106 & 0.457909 \tabularnewline
14 & 0.20327 & 2.1124 & 0.018476 \tabularnewline
15 & -0.026025 & -0.2705 & 0.393663 \tabularnewline
16 & -0.144526 & -1.502 & 0.068013 \tabularnewline
17 & -0.282297 & -2.9337 & 0.002046 \tabularnewline
18 & -0.262412 & -2.7271 & 0.00373 \tabularnewline
19 & -0.318328 & -3.3082 & 0.000638 \tabularnewline
20 & -0.176693 & -1.8362 & 0.034536 \tabularnewline
21 & 0.050519 & 0.525 & 0.300326 \tabularnewline
22 & 0.06058 & 0.6296 & 0.265155 \tabularnewline
23 & 0.050933 & 0.5293 & 0.298837 \tabularnewline
24 & 0.627021 & 6.5162 & 0 \tabularnewline
25 & -0.011123 & -0.1156 & 0.454095 \tabularnewline
26 & 0.186893 & 1.9422 & 0.027356 \tabularnewline
27 & -0.019446 & -0.2021 & 0.420114 \tabularnewline
28 & -0.106626 & -1.1081 & 0.135142 \tabularnewline
29 & -0.2222 & -2.3092 & 0.011418 \tabularnewline
30 & -0.17372 & -1.8054 & 0.036903 \tabularnewline
31 & -0.257437 & -2.6754 & 0.004313 \tabularnewline
32 & -0.17337 & -1.8017 & 0.03719 \tabularnewline
33 & 0.046707 & 0.4854 & 0.314189 \tabularnewline
34 & 0.017847 & 0.1855 & 0.426602 \tabularnewline
35 & 0.043937 & 0.4566 & 0.324434 \tabularnewline
36 & 0.500451 & 5.2008 & 0 \tabularnewline
37 & 0.016086 & 0.1672 & 0.433774 \tabularnewline
38 & 0.172677 & 1.7945 & 0.037765 \tabularnewline
39 & 0.035857 & 0.3726 & 0.355076 \tabularnewline
40 & -0.006778 & -0.0704 & 0.471987 \tabularnewline
41 & -0.152271 & -1.5824 & 0.058236 \tabularnewline
42 & -0.132736 & -1.3794 & 0.085305 \tabularnewline
43 & -0.250436 & -2.6026 & 0.005275 \tabularnewline
44 & -0.153432 & -1.5945 & 0.056872 \tabularnewline
45 & 0.036692 & 0.3813 & 0.351861 \tabularnewline
46 & -0.031375 & -0.3261 & 0.372505 \tabularnewline
47 & 0.076556 & 0.7956 & 0.214007 \tabularnewline
48 & 0.401345 & 4.1709 & 3.1e-05 \tabularnewline
\hline
\end{tabular}
%Source: https://freestatistics.org/blog/index.php?pk=296405&T=1

[TABLE]
[ROW][C]Autocorrelation Function[/C][/ROW]
[ROW][C]Time lag k[/C][C]ACF(k)[/C][C]T-STAT[/C][C]P-value[/C][/ROW]
[ROW][C]1[/C][C]0.049754[/C][C]0.5171[/C][C]0.303086[/C][/ROW]
[ROW][C]2[/C][C]0.223512[/C][C]2.3228[/C][C]0.011032[/C][/ROW]
[ROW][C]3[/C][C]0.02913[/C][C]0.3027[/C][C]0.381339[/C][/ROW]
[ROW][C]4[/C][C]-0.17786[/C][C]-1.8484[/C][C]0.033642[/C][/ROW]
[ROW][C]5[/C][C]-0.341658[/C][C]-3.5506[/C][C]0.000285[/C][/ROW]
[ROW][C]6[/C][C]-0.279037[/C][C]-2.8998[/C][C]0.002262[/C][/ROW]
[ROW][C]7[/C][C]-0.352349[/C][C]-3.6617[/C][C]0.000195[/C][/ROW]
[ROW][C]8[/C][C]-0.164452[/C][C]-1.709[/C][C]0.045159[/C][/ROW]
[ROW][C]9[/C][C]0.070546[/C][C]0.7331[/C][C]0.232533[/C][/ROW]
[ROW][C]10[/C][C]0.175364[/C][C]1.8224[/C][C]0.035578[/C][/ROW]
[ROW][C]11[/C][C]0.052648[/C][C]0.5471[/C][C]0.292707[/C][/ROW]
[ROW][C]12[/C][C]0.778171[/C][C]8.087[/C][C]0[/C][/ROW]
[ROW][C]13[/C][C]-0.010195[/C][C]-0.106[/C][C]0.457909[/C][/ROW]
[ROW][C]14[/C][C]0.20327[/C][C]2.1124[/C][C]0.018476[/C][/ROW]
[ROW][C]15[/C][C]-0.026025[/C][C]-0.2705[/C][C]0.393663[/C][/ROW]
[ROW][C]16[/C][C]-0.144526[/C][C]-1.502[/C][C]0.068013[/C][/ROW]
[ROW][C]17[/C][C]-0.282297[/C][C]-2.9337[/C][C]0.002046[/C][/ROW]
[ROW][C]18[/C][C]-0.262412[/C][C]-2.7271[/C][C]0.00373[/C][/ROW]
[ROW][C]19[/C][C]-0.318328[/C][C]-3.3082[/C][C]0.000638[/C][/ROW]
[ROW][C]20[/C][C]-0.176693[/C][C]-1.8362[/C][C]0.034536[/C][/ROW]
[ROW][C]21[/C][C]0.050519[/C][C]0.525[/C][C]0.300326[/C][/ROW]
[ROW][C]22[/C][C]0.06058[/C][C]0.6296[/C][C]0.265155[/C][/ROW]
[ROW][C]23[/C][C]0.050933[/C][C]0.5293[/C][C]0.298837[/C][/ROW]
[ROW][C]24[/C][C]0.627021[/C][C]6.5162[/C][C]0[/C][/ROW]
[ROW][C]25[/C][C]-0.011123[/C][C]-0.1156[/C][C]0.454095[/C][/ROW]
[ROW][C]26[/C][C]0.186893[/C][C]1.9422[/C][C]0.027356[/C][/ROW]
[ROW][C]27[/C][C]-0.019446[/C][C]-0.2021[/C][C]0.420114[/C][/ROW]
[ROW][C]28[/C][C]-0.106626[/C][C]-1.1081[/C][C]0.135142[/C][/ROW]
[ROW][C]29[/C][C]-0.2222[/C][C]-2.3092[/C][C]0.011418[/C][/ROW]
[ROW][C]30[/C][C]-0.17372[/C][C]-1.8054[/C][C]0.036903[/C][/ROW]
[ROW][C]31[/C][C]-0.257437[/C][C]-2.6754[/C][C]0.004313[/C][/ROW]
[ROW][C]32[/C][C]-0.17337[/C][C]-1.8017[/C][C]0.03719[/C][/ROW]
[ROW][C]33[/C][C]0.046707[/C][C]0.4854[/C][C]0.314189[/C][/ROW]
[ROW][C]34[/C][C]0.017847[/C][C]0.1855[/C][C]0.426602[/C][/ROW]
[ROW][C]35[/C][C]0.043937[/C][C]0.4566[/C][C]0.324434[/C][/ROW]
[ROW][C]36[/C][C]0.500451[/C][C]5.2008[/C][C]0[/C][/ROW]
[ROW][C]37[/C][C]0.016086[/C][C]0.1672[/C][C]0.433774[/C][/ROW]
[ROW][C]38[/C][C]0.172677[/C][C]1.7945[/C][C]0.037765[/C][/ROW]
[ROW][C]39[/C][C]0.035857[/C][C]0.3726[/C][C]0.355076[/C][/ROW]
[ROW][C]40[/C][C]-0.006778[/C][C]-0.0704[/C][C]0.471987[/C][/ROW]
[ROW][C]41[/C][C]-0.152271[/C][C]-1.5824[/C][C]0.058236[/C][/ROW]
[ROW][C]42[/C][C]-0.132736[/C][C]-1.3794[/C][C]0.085305[/C][/ROW]
[ROW][C]43[/C][C]-0.250436[/C][C]-2.6026[/C][C]0.005275[/C][/ROW]
[ROW][C]44[/C][C]-0.153432[/C][C]-1.5945[/C][C]0.056872[/C][/ROW]
[ROW][C]45[/C][C]0.036692[/C][C]0.3813[/C][C]0.351861[/C][/ROW]
[ROW][C]46[/C][C]-0.031375[/C][C]-0.3261[/C][C]0.372505[/C][/ROW]
[ROW][C]47[/C][C]0.076556[/C][C]0.7956[/C][C]0.214007[/C][/ROW]
[ROW][C]48[/C][C]0.401345[/C][C]4.1709[/C][C]3.1e-05[/C][/ROW]
[/TABLE]
Source: https://freestatistics.org/blog/index.php?pk=296405&T=1

Globally Unique Identifier (entire table): ba.freestatistics.org/blog/index.php?pk=296405&T=1

As an alternative you can also use a QR Code:  

The GUIDs for individual cells are displayed in the table below:

Autocorrelation Function
Time lag kACF(k)T-STATP-value
10.0497540.51710.303086
20.2235122.32280.011032
30.029130.30270.381339
4-0.17786-1.84840.033642
5-0.341658-3.55060.000285
6-0.279037-2.89980.002262
7-0.352349-3.66170.000195
8-0.164452-1.7090.045159
90.0705460.73310.232533
100.1753641.82240.035578
110.0526480.54710.292707
120.7781718.0870
13-0.010195-0.1060.457909
140.203272.11240.018476
15-0.026025-0.27050.393663
16-0.144526-1.5020.068013
17-0.282297-2.93370.002046
18-0.262412-2.72710.00373
19-0.318328-3.30820.000638
20-0.176693-1.83620.034536
210.0505190.5250.300326
220.060580.62960.265155
230.0509330.52930.298837
240.6270216.51620
25-0.011123-0.11560.454095
260.1868931.94220.027356
27-0.019446-0.20210.420114
28-0.106626-1.10810.135142
29-0.2222-2.30920.011418
30-0.17372-1.80540.036903
31-0.257437-2.67540.004313
32-0.17337-1.80170.03719
330.0467070.48540.314189
340.0178470.18550.426602
350.0439370.45660.324434
360.5004515.20080
370.0160860.16720.433774
380.1726771.79450.037765
390.0358570.37260.355076
40-0.006778-0.07040.471987
41-0.152271-1.58240.058236
42-0.132736-1.37940.085305
43-0.250436-2.60260.005275
44-0.153432-1.59450.056872
450.0366920.38130.351861
46-0.031375-0.32610.372505
470.0765560.79560.214007
480.4013454.17093.1e-05


Partial Autocorrelation Function
Time lag kPACF(k)T-STATP-value
10.0497540.51710.303086
20.2215852.30280.011604
30.0099620.10350.45887
4-0.241299-2.50760.006821
5-0.374958-3.89678.5e-05
6-0.235501-2.44740.008001
7-0.253409-2.63350.004845
8-0.147288-1.53070.064389
90.0824550.85690.196699
100.1381141.43530.077043
11-0.24666-2.56340.005871
120.6457846.71120
13-0.165401-1.71890.044249
14-0.090992-0.94560.173227
15-0.04331-0.45010.326775
160.0948480.98570.163244
170.0573290.59580.276285
18-0.115069-1.19580.11719
19-0.032747-0.34030.367138
20-0.122025-1.26810.10374
21-0.104311-1.0840.140382
22-0.199898-2.07740.020068
230.00210.02180.491313
240.0756690.78640.216683
25-0.028346-0.29460.38444
26-0.178291-1.85290.033317
27-0.024985-0.25970.397812
28-0.027858-0.28950.386374
29-0.034314-0.35660.361042
300.1626941.69080.046883
310.0830560.86310.194986
32-0.091863-0.95470.170939
33-0.163258-1.69660.046323
340.0504990.52480.300399
354.2e-054e-040.499825
36-0.007552-0.07850.468796
370.0819530.85170.198138
38-0.013251-0.13770.445366
390.0102160.10620.457824
400.04960.51550.303642
410.0179870.18690.426036
42-0.081459-0.84650.19956
43-0.100345-1.04280.149681
440.1028651.0690.143725
450.1189471.23610.109545
46-0.051997-0.54040.295029
470.0725150.75360.226364
48-0.007438-0.07730.469264

\begin{tabular}{lllllllll}
\hline
Partial Autocorrelation Function \tabularnewline
Time lag k & PACF(k) & T-STAT & P-value \tabularnewline
1 & 0.049754 & 0.5171 & 0.303086 \tabularnewline
2 & 0.221585 & 2.3028 & 0.011604 \tabularnewline
3 & 0.009962 & 0.1035 & 0.45887 \tabularnewline
4 & -0.241299 & -2.5076 & 0.006821 \tabularnewline
5 & -0.374958 & -3.8967 & 8.5e-05 \tabularnewline
6 & -0.235501 & -2.4474 & 0.008001 \tabularnewline
7 & -0.253409 & -2.6335 & 0.004845 \tabularnewline
8 & -0.147288 & -1.5307 & 0.064389 \tabularnewline
9 & 0.082455 & 0.8569 & 0.196699 \tabularnewline
10 & 0.138114 & 1.4353 & 0.077043 \tabularnewline
11 & -0.24666 & -2.5634 & 0.005871 \tabularnewline
12 & 0.645784 & 6.7112 & 0 \tabularnewline
13 & -0.165401 & -1.7189 & 0.044249 \tabularnewline
14 & -0.090992 & -0.9456 & 0.173227 \tabularnewline
15 & -0.04331 & -0.4501 & 0.326775 \tabularnewline
16 & 0.094848 & 0.9857 & 0.163244 \tabularnewline
17 & 0.057329 & 0.5958 & 0.276285 \tabularnewline
18 & -0.115069 & -1.1958 & 0.11719 \tabularnewline
19 & -0.032747 & -0.3403 & 0.367138 \tabularnewline
20 & -0.122025 & -1.2681 & 0.10374 \tabularnewline
21 & -0.104311 & -1.084 & 0.140382 \tabularnewline
22 & -0.199898 & -2.0774 & 0.020068 \tabularnewline
23 & 0.0021 & 0.0218 & 0.491313 \tabularnewline
24 & 0.075669 & 0.7864 & 0.216683 \tabularnewline
25 & -0.028346 & -0.2946 & 0.38444 \tabularnewline
26 & -0.178291 & -1.8529 & 0.033317 \tabularnewline
27 & -0.024985 & -0.2597 & 0.397812 \tabularnewline
28 & -0.027858 & -0.2895 & 0.386374 \tabularnewline
29 & -0.034314 & -0.3566 & 0.361042 \tabularnewline
30 & 0.162694 & 1.6908 & 0.046883 \tabularnewline
31 & 0.083056 & 0.8631 & 0.194986 \tabularnewline
32 & -0.091863 & -0.9547 & 0.170939 \tabularnewline
33 & -0.163258 & -1.6966 & 0.046323 \tabularnewline
34 & 0.050499 & 0.5248 & 0.300399 \tabularnewline
35 & 4.2e-05 & 4e-04 & 0.499825 \tabularnewline
36 & -0.007552 & -0.0785 & 0.468796 \tabularnewline
37 & 0.081953 & 0.8517 & 0.198138 \tabularnewline
38 & -0.013251 & -0.1377 & 0.445366 \tabularnewline
39 & 0.010216 & 0.1062 & 0.457824 \tabularnewline
40 & 0.0496 & 0.5155 & 0.303642 \tabularnewline
41 & 0.017987 & 0.1869 & 0.426036 \tabularnewline
42 & -0.081459 & -0.8465 & 0.19956 \tabularnewline
43 & -0.100345 & -1.0428 & 0.149681 \tabularnewline
44 & 0.102865 & 1.069 & 0.143725 \tabularnewline
45 & 0.118947 & 1.2361 & 0.109545 \tabularnewline
46 & -0.051997 & -0.5404 & 0.295029 \tabularnewline
47 & 0.072515 & 0.7536 & 0.226364 \tabularnewline
48 & -0.007438 & -0.0773 & 0.469264 \tabularnewline
\hline
\end{tabular}
%Source: https://freestatistics.org/blog/index.php?pk=296405&T=2

[TABLE]
[ROW][C]Partial Autocorrelation Function[/C][/ROW]
[ROW][C]Time lag k[/C][C]PACF(k)[/C][C]T-STAT[/C][C]P-value[/C][/ROW]
[ROW][C]1[/C][C]0.049754[/C][C]0.5171[/C][C]0.303086[/C][/ROW]
[ROW][C]2[/C][C]0.221585[/C][C]2.3028[/C][C]0.011604[/C][/ROW]
[ROW][C]3[/C][C]0.009962[/C][C]0.1035[/C][C]0.45887[/C][/ROW]
[ROW][C]4[/C][C]-0.241299[/C][C]-2.5076[/C][C]0.006821[/C][/ROW]
[ROW][C]5[/C][C]-0.374958[/C][C]-3.8967[/C][C]8.5e-05[/C][/ROW]
[ROW][C]6[/C][C]-0.235501[/C][C]-2.4474[/C][C]0.008001[/C][/ROW]
[ROW][C]7[/C][C]-0.253409[/C][C]-2.6335[/C][C]0.004845[/C][/ROW]
[ROW][C]8[/C][C]-0.147288[/C][C]-1.5307[/C][C]0.064389[/C][/ROW]
[ROW][C]9[/C][C]0.082455[/C][C]0.8569[/C][C]0.196699[/C][/ROW]
[ROW][C]10[/C][C]0.138114[/C][C]1.4353[/C][C]0.077043[/C][/ROW]
[ROW][C]11[/C][C]-0.24666[/C][C]-2.5634[/C][C]0.005871[/C][/ROW]
[ROW][C]12[/C][C]0.645784[/C][C]6.7112[/C][C]0[/C][/ROW]
[ROW][C]13[/C][C]-0.165401[/C][C]-1.7189[/C][C]0.044249[/C][/ROW]
[ROW][C]14[/C][C]-0.090992[/C][C]-0.9456[/C][C]0.173227[/C][/ROW]
[ROW][C]15[/C][C]-0.04331[/C][C]-0.4501[/C][C]0.326775[/C][/ROW]
[ROW][C]16[/C][C]0.094848[/C][C]0.9857[/C][C]0.163244[/C][/ROW]
[ROW][C]17[/C][C]0.057329[/C][C]0.5958[/C][C]0.276285[/C][/ROW]
[ROW][C]18[/C][C]-0.115069[/C][C]-1.1958[/C][C]0.11719[/C][/ROW]
[ROW][C]19[/C][C]-0.032747[/C][C]-0.3403[/C][C]0.367138[/C][/ROW]
[ROW][C]20[/C][C]-0.122025[/C][C]-1.2681[/C][C]0.10374[/C][/ROW]
[ROW][C]21[/C][C]-0.104311[/C][C]-1.084[/C][C]0.140382[/C][/ROW]
[ROW][C]22[/C][C]-0.199898[/C][C]-2.0774[/C][C]0.020068[/C][/ROW]
[ROW][C]23[/C][C]0.0021[/C][C]0.0218[/C][C]0.491313[/C][/ROW]
[ROW][C]24[/C][C]0.075669[/C][C]0.7864[/C][C]0.216683[/C][/ROW]
[ROW][C]25[/C][C]-0.028346[/C][C]-0.2946[/C][C]0.38444[/C][/ROW]
[ROW][C]26[/C][C]-0.178291[/C][C]-1.8529[/C][C]0.033317[/C][/ROW]
[ROW][C]27[/C][C]-0.024985[/C][C]-0.2597[/C][C]0.397812[/C][/ROW]
[ROW][C]28[/C][C]-0.027858[/C][C]-0.2895[/C][C]0.386374[/C][/ROW]
[ROW][C]29[/C][C]-0.034314[/C][C]-0.3566[/C][C]0.361042[/C][/ROW]
[ROW][C]30[/C][C]0.162694[/C][C]1.6908[/C][C]0.046883[/C][/ROW]
[ROW][C]31[/C][C]0.083056[/C][C]0.8631[/C][C]0.194986[/C][/ROW]
[ROW][C]32[/C][C]-0.091863[/C][C]-0.9547[/C][C]0.170939[/C][/ROW]
[ROW][C]33[/C][C]-0.163258[/C][C]-1.6966[/C][C]0.046323[/C][/ROW]
[ROW][C]34[/C][C]0.050499[/C][C]0.5248[/C][C]0.300399[/C][/ROW]
[ROW][C]35[/C][C]4.2e-05[/C][C]4e-04[/C][C]0.499825[/C][/ROW]
[ROW][C]36[/C][C]-0.007552[/C][C]-0.0785[/C][C]0.468796[/C][/ROW]
[ROW][C]37[/C][C]0.081953[/C][C]0.8517[/C][C]0.198138[/C][/ROW]
[ROW][C]38[/C][C]-0.013251[/C][C]-0.1377[/C][C]0.445366[/C][/ROW]
[ROW][C]39[/C][C]0.010216[/C][C]0.1062[/C][C]0.457824[/C][/ROW]
[ROW][C]40[/C][C]0.0496[/C][C]0.5155[/C][C]0.303642[/C][/ROW]
[ROW][C]41[/C][C]0.017987[/C][C]0.1869[/C][C]0.426036[/C][/ROW]
[ROW][C]42[/C][C]-0.081459[/C][C]-0.8465[/C][C]0.19956[/C][/ROW]
[ROW][C]43[/C][C]-0.100345[/C][C]-1.0428[/C][C]0.149681[/C][/ROW]
[ROW][C]44[/C][C]0.102865[/C][C]1.069[/C][C]0.143725[/C][/ROW]
[ROW][C]45[/C][C]0.118947[/C][C]1.2361[/C][C]0.109545[/C][/ROW]
[ROW][C]46[/C][C]-0.051997[/C][C]-0.5404[/C][C]0.295029[/C][/ROW]
[ROW][C]47[/C][C]0.072515[/C][C]0.7536[/C][C]0.226364[/C][/ROW]
[ROW][C]48[/C][C]-0.007438[/C][C]-0.0773[/C][C]0.469264[/C][/ROW]
[/TABLE]
Source: https://freestatistics.org/blog/index.php?pk=296405&T=2

Globally Unique Identifier (entire table): ba.freestatistics.org/blog/index.php?pk=296405&T=2

As an alternative you can also use a QR Code:  

The GUIDs for individual cells are displayed in the table below:

Partial Autocorrelation Function
Time lag kPACF(k)T-STATP-value
10.0497540.51710.303086
20.2215852.30280.011604
30.0099620.10350.45887
4-0.241299-2.50760.006821
5-0.374958-3.89678.5e-05
6-0.235501-2.44740.008001
7-0.253409-2.63350.004845
8-0.147288-1.53070.064389
90.0824550.85690.196699
100.1381141.43530.077043
11-0.24666-2.56340.005871
120.6457846.71120
13-0.165401-1.71890.044249
14-0.090992-0.94560.173227
15-0.04331-0.45010.326775
160.0948480.98570.163244
170.0573290.59580.276285
18-0.115069-1.19580.11719
19-0.032747-0.34030.367138
20-0.122025-1.26810.10374
21-0.104311-1.0840.140382
22-0.199898-2.07740.020068
230.00210.02180.491313
240.0756690.78640.216683
25-0.028346-0.29460.38444
26-0.178291-1.85290.033317
27-0.024985-0.25970.397812
28-0.027858-0.28950.386374
29-0.034314-0.35660.361042
300.1626941.69080.046883
310.0830560.86310.194986
32-0.091863-0.95470.170939
33-0.163258-1.69660.046323
340.0504990.52480.300399
354.2e-054e-040.499825
36-0.007552-0.07850.468796
370.0819530.85170.198138
38-0.013251-0.13770.445366
390.0102160.10620.457824
400.04960.51550.303642
410.0179870.18690.426036
42-0.081459-0.84650.19956
43-0.100345-1.04280.149681
440.1028651.0690.143725
450.1189471.23610.109545
46-0.051997-0.54040.295029
470.0725150.75360.226364
48-0.007438-0.07730.469264


Parameters (Session):
par1 = 48 ; par2 = 1 ; par3 = 0 ; par4 = 0 ; par5 = 12 ; par6 = White Noise ; par7 = 0.95 ;
Parameters (R input):
par1 = 48 ; par2 = 1 ; par3 = 0 ; par4 = 0 ; par5 = 12 ; par6 = White Noise ; par7 = 0.95 ; par8 = ;
R code (references can be found in the software module):
if (par1 == 'Default') {
par1 = 10*log10(length(x))
} else {
par1 <- as.numeric(par1)
}
par2 <- as.numeric(par2)
par3 <- as.numeric(par3)
par4 <- as.numeric(par4)
par5 <- as.numeric(par5)
if (par6 == 'White Noise') par6 <- 'white' else par6 <- 'ma'
par7 <- as.numeric(par7)
if (par8 != '') par8 <- as.numeric(par8)
x <- na.omit(x)
ox <- x
if (par8 == '') {
if (par2 == 0) {
x <- log(x)
} else {
x <- (x ^ par2 - 1) / par2
}
} else {
x <- log(x,base=par8)
}
if (par3 > 0) x <- diff(x,lag=1,difference=par3)
if (par4 > 0) x <- diff(x,lag=par5,difference=par4)
bitmap(file='picts.png')
op <- par(mfrow=c(2,1))
plot(ox,type='l',main='Original Time Series',xlab='time',ylab='value')
if (par8=='') {
mytitle <- paste('Working Time Series (lambda=',par2,', d=',par3,', D=',par4,')',sep='')
mysub <- paste('(lambda=',par2,', d=',par3,', D=',par4,', CI=', par7, ', CI type=',par6,')',sep='')
} else {
mytitle <- paste('Working Time Series (base=',par8,', d=',par3,', D=',par4,')',sep='')
mysub <- paste('(base=',par8,', d=',par3,', D=',par4,', CI=', par7, ', CI type=',par6,')',sep='')
}
plot(x,type='l', main=mytitle,xlab='time',ylab='value')
par(op)
dev.off()
bitmap(file='pic1.png')
racf <- acf(x, par1, main='Autocorrelation', xlab='time lag', ylab='ACF', ci.type=par6, ci=par7, sub=mysub)
dev.off()
bitmap(file='pic2.png')
rpacf <- pacf(x,par1,main='Partial Autocorrelation',xlab='lags',ylab='PACF',sub=mysub)
dev.off()
(myacf <- c(racf$acf))
(mypacf <- c(rpacf$acf))
lengthx <- length(x)
sqrtn <- sqrt(lengthx)
load(file='createtable')
a<-table.start()
a<-table.row.start(a)
a<-table.element(a,'Autocorrelation Function',4,TRUE)
a<-table.row.end(a)
a<-table.row.start(a)
a<-table.element(a,'Time lag k',header=TRUE)
a<-table.element(a,hyperlink('basics.htm','ACF(k)','click here for more information about the Autocorrelation Function'),header=TRUE)
a<-table.element(a,'T-STAT',header=TRUE)
a<-table.element(a,'P-value',header=TRUE)
a<-table.row.end(a)
for (i in 2:(par1+1)) {
a<-table.row.start(a)
a<-table.element(a,i-1,header=TRUE)
a<-table.element(a,round(myacf[i],6))
mytstat <- myacf[i]*sqrtn
a<-table.element(a,round(mytstat,4))
a<-table.element(a,round(1-pt(abs(mytstat),lengthx),6))
a<-table.row.end(a)
}
a<-table.end(a)
table.save(a,file='mytable.tab')
a<-table.start()
a<-table.row.start(a)
a<-table.element(a,'Partial Autocorrelation Function',4,TRUE)
a<-table.row.end(a)
a<-table.row.start(a)
a<-table.element(a,'Time lag k',header=TRUE)
a<-table.element(a,hyperlink('basics.htm','PACF(k)','click here for more information about the Partial Autocorrelation Function'),header=TRUE)
a<-table.element(a,'T-STAT',header=TRUE)
a<-table.element(a,'P-value',header=TRUE)
a<-table.row.end(a)
for (i in 1:par1) {
a<-table.row.start(a)
a<-table.element(a,i,header=TRUE)
a<-table.element(a,round(mypacf[i],6))
mytstat <- mypacf[i]*sqrtn
a<-table.element(a,round(mytstat,4))
a<-table.element(a,round(1-pt(abs(mytstat),lengthx),6))
a<-table.row.end(a)
}
a<-table.end(a)
table.save(a,file='mytable1.tab')