\begin{tabular}{lllllllll}
\hline
Summary of computational transaction \tabularnewline
Raw Input & view raw input (R code)  \tabularnewline
Raw Output & view raw output of R engine  \tabularnewline
Computing time & 1 seconds \tabularnewline
R Server & 'George Udny Yule' @ yule.wessa.net \tabularnewline
\hline
\end{tabular}
%Source: https://freestatistics.org/blog/index.php?pk=296420&T=0
[TABLE]
[ROW][C]Summary of computational transaction[/C][/ROW]
[ROW][C]Raw Input[/C][C]view raw input (R code) [/C][/ROW]
[ROW][C]Raw Output[/C][C]view raw output of R engine [/C][/ROW]
[ROW][C]Computing time[/C][C]1 seconds[/C][/ROW]
[ROW][C]R Server[/C][C]'George Udny Yule' @ yule.wessa.net[/C][/ROW]
[/TABLE]
Source: https://freestatistics.org/blog/index.php?pk=296420&T=0
If you paste this QR Code into your document, anyone with a smartphone or tablet will be able to scan it and view this table in a browser.
If you paste this QR Code into your document, anyone with a smartphone or tablet will be able to scan it and view this table in a browser.
If you paste this QR Code into your document, anyone with a smartphone or tablet will be able to scan it and view this table in a browser.
If you paste this QR Code into your document, anyone with a smartphone or tablet will be able to scan it and view this table in a browser.
If you paste this QR Code into your document, anyone with a smartphone or tablet will be able to scan it and view this table in a browser.
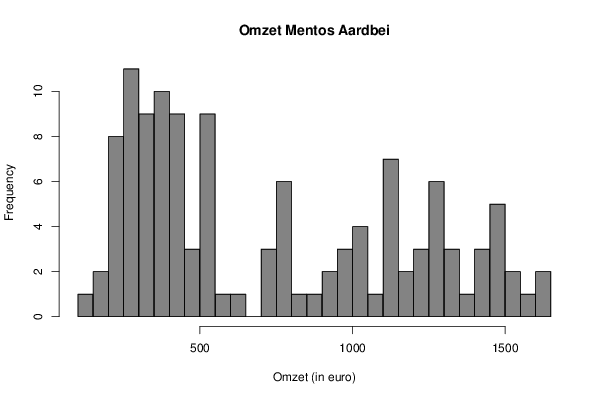
| Frequency Table (Histogram) | | Bins | Midpoint | Abs. Frequency | Rel. Frequency | Cumul. Rel. Freq. | Density | | [100,150[ | 125 | 1 | 0.008333 | 0.008333 | 0.000167 | | [150,200[ | 175 | 2 | 0.016667 | 0.025 | 0.000333 | | [200,250[ | 225 | 8 | 0.066667 | 0.091667 | 0.001333 | | [250,300[ | 275 | 11 | 0.091667 | 0.183333 | 0.001833 | | [300,350[ | 325 | 9 | 0.075 | 0.258333 | 0.0015 | | [350,400[ | 375 | 10 | 0.083333 | 0.341667 | 0.001667 | | [400,450[ | 425 | 9 | 0.075 | 0.416667 | 0.0015 | | [450,500[ | 475 | 3 | 0.025 | 0.441667 | 5e-04 | | [500,550[ | 525 | 9 | 0.075 | 0.516667 | 0.0015 | | [550,600[ | 575 | 1 | 0.008333 | 0.525 | 0.000167 | | [600,650[ | 625 | 1 | 0.008333 | 0.533333 | 0.000167 | | [650,700[ | 675 | 0 | 0 | 0.533333 | 0 | | [700,750[ | 725 | 3 | 0.025 | 0.558333 | 5e-04 | | [750,800[ | 775 | 6 | 0.05 | 0.608333 | 0.001 | | [800,850[ | 825 | 1 | 0.008333 | 0.616667 | 0.000167 | | [850,900[ | 875 | 1 | 0.008333 | 0.625 | 0.000167 | | [900,950[ | 925 | 2 | 0.016667 | 0.641667 | 0.000333 | | [950,1000[ | 975 | 3 | 0.025 | 0.666667 | 5e-04 | | [1000,1050[ | 1025 | 4 | 0.033333 | 0.7 | 0.000667 | | [1050,1100[ | 1075 | 1 | 0.008333 | 0.708333 | 0.000167 | | [1100,1150[ | 1125 | 7 | 0.058333 | 0.766667 | 0.001167 | | [1150,1200[ | 1175 | 2 | 0.016667 | 0.783333 | 0.000333 | | [1200,1250[ | 1225 | 3 | 0.025 | 0.808333 | 5e-04 | | [1250,1300[ | 1275 | 6 | 0.05 | 0.858333 | 0.001 | | [1300,1350[ | 1325 | 3 | 0.025 | 0.883333 | 5e-04 | | [1350,1400[ | 1375 | 1 | 0.008333 | 0.891667 | 0.000167 | | [1400,1450[ | 1425 | 3 | 0.025 | 0.916667 | 5e-04 | | [1450,1500[ | 1475 | 5 | 0.041667 | 0.958333 | 0.000833 | | [1500,1550[ | 1525 | 2 | 0.016667 | 0.975 | 0.000333 | | [1550,1600[ | 1575 | 1 | 0.008333 | 0.983333 | 0.000167 | | [1600,1650] | 1625 | 2 | 0.016667 | 1 | 0.000333 |
\begin{tabular}{lllllllll}
\hline
Frequency Table (Histogram) \tabularnewline
Bins & Midpoint & Abs. Frequency & Rel. Frequency & Cumul. Rel. Freq. & Density \tabularnewline
[100,150[ & 125 & 1 & 0.008333 & 0.008333 & 0.000167 \tabularnewline
[150,200[ & 175 & 2 & 0.016667 & 0.025 & 0.000333 \tabularnewline
[200,250[ & 225 & 8 & 0.066667 & 0.091667 & 0.001333 \tabularnewline
[250,300[ & 275 & 11 & 0.091667 & 0.183333 & 0.001833 \tabularnewline
[300,350[ & 325 & 9 & 0.075 & 0.258333 & 0.0015 \tabularnewline
[350,400[ & 375 & 10 & 0.083333 & 0.341667 & 0.001667 \tabularnewline
[400,450[ & 425 & 9 & 0.075 & 0.416667 & 0.0015 \tabularnewline
[450,500[ & 475 & 3 & 0.025 & 0.441667 & 5e-04 \tabularnewline
[500,550[ & 525 & 9 & 0.075 & 0.516667 & 0.0015 \tabularnewline
[550,600[ & 575 & 1 & 0.008333 & 0.525 & 0.000167 \tabularnewline
[600,650[ & 625 & 1 & 0.008333 & 0.533333 & 0.000167 \tabularnewline
[650,700[ & 675 & 0 & 0 & 0.533333 & 0 \tabularnewline
[700,750[ & 725 & 3 & 0.025 & 0.558333 & 5e-04 \tabularnewline
[750,800[ & 775 & 6 & 0.05 & 0.608333 & 0.001 \tabularnewline
[800,850[ & 825 & 1 & 0.008333 & 0.616667 & 0.000167 \tabularnewline
[850,900[ & 875 & 1 & 0.008333 & 0.625 & 0.000167 \tabularnewline
[900,950[ & 925 & 2 & 0.016667 & 0.641667 & 0.000333 \tabularnewline
[950,1000[ & 975 & 3 & 0.025 & 0.666667 & 5e-04 \tabularnewline
[1000,1050[ & 1025 & 4 & 0.033333 & 0.7 & 0.000667 \tabularnewline
[1050,1100[ & 1075 & 1 & 0.008333 & 0.708333 & 0.000167 \tabularnewline
[1100,1150[ & 1125 & 7 & 0.058333 & 0.766667 & 0.001167 \tabularnewline
[1150,1200[ & 1175 & 2 & 0.016667 & 0.783333 & 0.000333 \tabularnewline
[1200,1250[ & 1225 & 3 & 0.025 & 0.808333 & 5e-04 \tabularnewline
[1250,1300[ & 1275 & 6 & 0.05 & 0.858333 & 0.001 \tabularnewline
[1300,1350[ & 1325 & 3 & 0.025 & 0.883333 & 5e-04 \tabularnewline
[1350,1400[ & 1375 & 1 & 0.008333 & 0.891667 & 0.000167 \tabularnewline
[1400,1450[ & 1425 & 3 & 0.025 & 0.916667 & 5e-04 \tabularnewline
[1450,1500[ & 1475 & 5 & 0.041667 & 0.958333 & 0.000833 \tabularnewline
[1500,1550[ & 1525 & 2 & 0.016667 & 0.975 & 0.000333 \tabularnewline
[1550,1600[ & 1575 & 1 & 0.008333 & 0.983333 & 0.000167 \tabularnewline
[1600,1650] & 1625 & 2 & 0.016667 & 1 & 0.000333 \tabularnewline
\hline
\end{tabular}
%Source: https://freestatistics.org/blog/index.php?pk=296420&T=1
[TABLE]
[ROW][C]Frequency Table (Histogram)[/C][/ROW]
[ROW][C]Bins[/C][C]Midpoint[/C][C]Abs. Frequency[/C][C]Rel. Frequency[/C][C]Cumul. Rel. Freq.[/C][C]Density[/C][/ROW]
[ROW][C][100,150[[/C][C]125[/C][C]1[/C][C]0.008333[/C][C]0.008333[/C][C]0.000167[/C][/ROW]
[ROW][C][150,200[[/C][C]175[/C][C]2[/C][C]0.016667[/C][C]0.025[/C][C]0.000333[/C][/ROW]
[ROW][C][200,250[[/C][C]225[/C][C]8[/C][C]0.066667[/C][C]0.091667[/C][C]0.001333[/C][/ROW]
[ROW][C][250,300[[/C][C]275[/C][C]11[/C][C]0.091667[/C][C]0.183333[/C][C]0.001833[/C][/ROW]
[ROW][C][300,350[[/C][C]325[/C][C]9[/C][C]0.075[/C][C]0.258333[/C][C]0.0015[/C][/ROW]
[ROW][C][350,400[[/C][C]375[/C][C]10[/C][C]0.083333[/C][C]0.341667[/C][C]0.001667[/C][/ROW]
[ROW][C][400,450[[/C][C]425[/C][C]9[/C][C]0.075[/C][C]0.416667[/C][C]0.0015[/C][/ROW]
[ROW][C][450,500[[/C][C]475[/C][C]3[/C][C]0.025[/C][C]0.441667[/C][C]5e-04[/C][/ROW]
[ROW][C][500,550[[/C][C]525[/C][C]9[/C][C]0.075[/C][C]0.516667[/C][C]0.0015[/C][/ROW]
[ROW][C][550,600[[/C][C]575[/C][C]1[/C][C]0.008333[/C][C]0.525[/C][C]0.000167[/C][/ROW]
[ROW][C][600,650[[/C][C]625[/C][C]1[/C][C]0.008333[/C][C]0.533333[/C][C]0.000167[/C][/ROW]
[ROW][C][650,700[[/C][C]675[/C][C]0[/C][C]0[/C][C]0.533333[/C][C]0[/C][/ROW]
[ROW][C][700,750[[/C][C]725[/C][C]3[/C][C]0.025[/C][C]0.558333[/C][C]5e-04[/C][/ROW]
[ROW][C][750,800[[/C][C]775[/C][C]6[/C][C]0.05[/C][C]0.608333[/C][C]0.001[/C][/ROW]
[ROW][C][800,850[[/C][C]825[/C][C]1[/C][C]0.008333[/C][C]0.616667[/C][C]0.000167[/C][/ROW]
[ROW][C][850,900[[/C][C]875[/C][C]1[/C][C]0.008333[/C][C]0.625[/C][C]0.000167[/C][/ROW]
[ROW][C][900,950[[/C][C]925[/C][C]2[/C][C]0.016667[/C][C]0.641667[/C][C]0.000333[/C][/ROW]
[ROW][C][950,1000[[/C][C]975[/C][C]3[/C][C]0.025[/C][C]0.666667[/C][C]5e-04[/C][/ROW]
[ROW][C][1000,1050[[/C][C]1025[/C][C]4[/C][C]0.033333[/C][C]0.7[/C][C]0.000667[/C][/ROW]
[ROW][C][1050,1100[[/C][C]1075[/C][C]1[/C][C]0.008333[/C][C]0.708333[/C][C]0.000167[/C][/ROW]
[ROW][C][1100,1150[[/C][C]1125[/C][C]7[/C][C]0.058333[/C][C]0.766667[/C][C]0.001167[/C][/ROW]
[ROW][C][1150,1200[[/C][C]1175[/C][C]2[/C][C]0.016667[/C][C]0.783333[/C][C]0.000333[/C][/ROW]
[ROW][C][1200,1250[[/C][C]1225[/C][C]3[/C][C]0.025[/C][C]0.808333[/C][C]5e-04[/C][/ROW]
[ROW][C][1250,1300[[/C][C]1275[/C][C]6[/C][C]0.05[/C][C]0.858333[/C][C]0.001[/C][/ROW]
[ROW][C][1300,1350[[/C][C]1325[/C][C]3[/C][C]0.025[/C][C]0.883333[/C][C]5e-04[/C][/ROW]
[ROW][C][1350,1400[[/C][C]1375[/C][C]1[/C][C]0.008333[/C][C]0.891667[/C][C]0.000167[/C][/ROW]
[ROW][C][1400,1450[[/C][C]1425[/C][C]3[/C][C]0.025[/C][C]0.916667[/C][C]5e-04[/C][/ROW]
[ROW][C][1450,1500[[/C][C]1475[/C][C]5[/C][C]0.041667[/C][C]0.958333[/C][C]0.000833[/C][/ROW]
[ROW][C][1500,1550[[/C][C]1525[/C][C]2[/C][C]0.016667[/C][C]0.975[/C][C]0.000333[/C][/ROW]
[ROW][C][1550,1600[[/C][C]1575[/C][C]1[/C][C]0.008333[/C][C]0.983333[/C][C]0.000167[/C][/ROW]
[ROW][C][1600,1650][/C][C]1625[/C][C]2[/C][C]0.016667[/C][C]1[/C][C]0.000333[/C][/ROW]
[/TABLE]
Source: https://freestatistics.org/blog/index.php?pk=296420&T=1
Globally Unique Identifier (entire table): ba.freestatistics.org/blog/index.php?pk=296420&T=1
As an alternative you can also use a QR Code:
The GUIDs for individual cells are displayed in the table below:
| Frequency Table (Histogram) | | Bins | Midpoint | Abs. Frequency | Rel. Frequency | Cumul. Rel. Freq. | Density | | [100,150[ | 125 | 1 | 0.008333 | 0.008333 | 0.000167 | | [150,200[ | 175 | 2 | 0.016667 | 0.025 | 0.000333 | | [200,250[ | 225 | 8 | 0.066667 | 0.091667 | 0.001333 | | [250,300[ | 275 | 11 | 0.091667 | 0.183333 | 0.001833 | | [300,350[ | 325 | 9 | 0.075 | 0.258333 | 0.0015 | | [350,400[ | 375 | 10 | 0.083333 | 0.341667 | 0.001667 | | [400,450[ | 425 | 9 | 0.075 | 0.416667 | 0.0015 | | [450,500[ | 475 | 3 | 0.025 | 0.441667 | 5e-04 | | [500,550[ | 525 | 9 | 0.075 | 0.516667 | 0.0015 | | [550,600[ | 575 | 1 | 0.008333 | 0.525 | 0.000167 | | [600,650[ | 625 | 1 | 0.008333 | 0.533333 | 0.000167 | | [650,700[ | 675 | 0 | 0 | 0.533333 | 0 | | [700,750[ | 725 | 3 | 0.025 | 0.558333 | 5e-04 | | [750,800[ | 775 | 6 | 0.05 | 0.608333 | 0.001 | | [800,850[ | 825 | 1 | 0.008333 | 0.616667 | 0.000167 | | [850,900[ | 875 | 1 | 0.008333 | 0.625 | 0.000167 | | [900,950[ | 925 | 2 | 0.016667 | 0.641667 | 0.000333 | | [950,1000[ | 975 | 3 | 0.025 | 0.666667 | 5e-04 | | [1000,1050[ | 1025 | 4 | 0.033333 | 0.7 | 0.000667 | | [1050,1100[ | 1075 | 1 | 0.008333 | 0.708333 | 0.000167 | | [1100,1150[ | 1125 | 7 | 0.058333 | 0.766667 | 0.001167 | | [1150,1200[ | 1175 | 2 | 0.016667 | 0.783333 | 0.000333 | | [1200,1250[ | 1225 | 3 | 0.025 | 0.808333 | 5e-04 | | [1250,1300[ | 1275 | 6 | 0.05 | 0.858333 | 0.001 | | [1300,1350[ | 1325 | 3 | 0.025 | 0.883333 | 5e-04 | | [1350,1400[ | 1375 | 1 | 0.008333 | 0.891667 | 0.000167 | | [1400,1450[ | 1425 | 3 | 0.025 | 0.916667 | 5e-04 | | [1450,1500[ | 1475 | 5 | 0.041667 | 0.958333 | 0.000833 | | [1500,1550[ | 1525 | 2 | 0.016667 | 0.975 | 0.000333 | | [1550,1600[ | 1575 | 1 | 0.008333 | 0.983333 | 0.000167 | | [1600,1650] | 1625 | 2 | 0.016667 | 1 | 0.000333 |
If you paste this QR Code into your document, anyone with a smartphone or tablet will be able to scan it and view this table in a browser.
If you paste this QR Code into your document, anyone with a smartphone or tablet will be able to scan it and view this table in a browser.
If you paste this QR Code into your document, anyone with a smartphone or tablet will be able to scan it and view this table in a browser.
If you paste this QR Code into your document, anyone with a smartphone or tablet will be able to scan it and view this table in a browser.
If you paste this QR Code into your document, anyone with a smartphone or tablet will be able to scan it and view this table in a browser.
|