Free Statistics

of Irreproducible Research!

Author's title

Author*Unverified author*
R Software Modulerwasp_density.wasp
Title produced by softwareKernel Density Estimation
Date of computationFri, 12 Aug 2016 12:05:45 +0100
Cite this page as followsStatistical Computations at FreeStatistics.org, Office for Research Development and Education, URL https://freestatistics.org/blog/index.php?v=date/2016/Aug/12/t1471000340wzh280006pq1s2d.htm/, Retrieved Sun, 05 May 2024 10:10:09 +0000
Statistical Computations at FreeStatistics.org, Office for Research Development and Education, URL https://freestatistics.org/blog/index.php?pk=296421, Retrieved Sun, 05 May 2024 10:10:09 +0000
QR Codes:

Original text written by user:
IsPrivate?No (this computation is public)
User-defined keywords
Estimated Impact115
Family? (F = Feedback message, R = changed R code, M = changed R Module, P = changed Parameters, D = changed Data)
-     [Univariate Data Series] [Omzet Mentos Aardbei] [2016-07-17 11:11:37] [74be16979710d4c4e7c6647856088456]
-   P   [Univariate Data Series] [Omzet Mentos Aardbei] [2016-08-02 12:13:56] [74be16979710d4c4e7c6647856088456]
-   P     [Univariate Data Series] [] [2016-08-12 10:07:18] [74be16979710d4c4e7c6647856088456]
- R  D      [Univariate Data Series] [] [2016-08-12 10:23:50] [74be16979710d4c4e7c6647856088456]
- RMP         [Histogram] [] [2016-08-12 10:31:52] [74be16979710d4c4e7c6647856088456]
- RMP             [Kernel Density Estimation] [] [2016-08-12 11:05:45] [d41d8cd98f00b204e9800998ecf8427e] [Current]
Feedback Forum

Post a new message
Dataseries X:
425.25
417.75
410.25
395.25
546.75
539.25
425.25
349.50
357.00
357.00
364.50
380.25
334.50
288.75
251.25
251.25
395.25
410.25
296.25
167.25
235.50
235.50
288.75
319.50
312.00
235.50
273.75
258.75
387.75
357.00
235.50
144.75
228.00
251.25
273.75
303.75
243.00
190.50
213.00
220.50
417.75
417.75
303.75
288.75
334.50
312.00
372.75
448.50
463.50
357.00
327.00
296.25
501.75
516.75
478.50
516.75
509.25
448.50
516.75
592.50
623.25
531.75
471.00
516.75
714.00
774.75
759.75
789.75
782.25
706.50
835.50
866.25
911.25
774.75
721.50
782.25
927.00
1056.00
1025.25
1025.25
1040.25
987.75
1124.25
1124.25
1101.00
972.00
995.25
1010.25
1109.25
1238.25
1146.75
1192.50
1154.25
1131.75
1306.50
1268.25
1215.00
1139.25
1215.00
1253.25
1299.00
1359.75
1299.00
1336.50
1290.75
1283.25
1473.00
1488.75
1428.00
1321.50
1412.25
1450.50
1496.25
1564.50
1496.25
1549.50
1526.25
1443.00
1617.75
1617.75


Summary of computational transaction
Raw Inputview raw input (R code)
Raw Outputview raw output of R engine
Computing time3 seconds
R Server'Sir Ronald Aylmer Fisher' @ fisher.wessa.net

\begin{tabular}{lllllllll}
\hline
Summary of computational transaction \tabularnewline
Raw Input & view raw input (R code)  \tabularnewline
Raw Output & view raw output of R engine  \tabularnewline
Computing time & 3 seconds \tabularnewline
R Server & 'Sir Ronald Aylmer Fisher' @ fisher.wessa.net \tabularnewline
\hline
\end{tabular}
%Source: https://freestatistics.org/blog/index.php?pk=296421&T=0

[TABLE]
[ROW][C]Summary of computational transaction[/C][/ROW]
[ROW][C]Raw Input[/C][C]view raw input (R code) [/C][/ROW]
[ROW][C]Raw Output[/C][C]view raw output of R engine [/C][/ROW]
[ROW][C]Computing time[/C][C]3 seconds[/C][/ROW]
[ROW][C]R Server[/C][C]'Sir Ronald Aylmer Fisher' @ fisher.wessa.net[/C][/ROW]
[/TABLE]
Source: https://freestatistics.org/blog/index.php?pk=296421&T=0

Globally Unique Identifier (entire table): ba.freestatistics.org/blog/index.php?pk=296421&T=0

As an alternative you can also use a QR Code:  

The GUIDs for individual cells are displayed in the table below:

Summary of computational transaction
Raw Inputview raw input (R code)
Raw Outputview raw output of R engine
Computing time3 seconds
R Server'Sir Ronald Aylmer Fisher' @ fisher.wessa.net


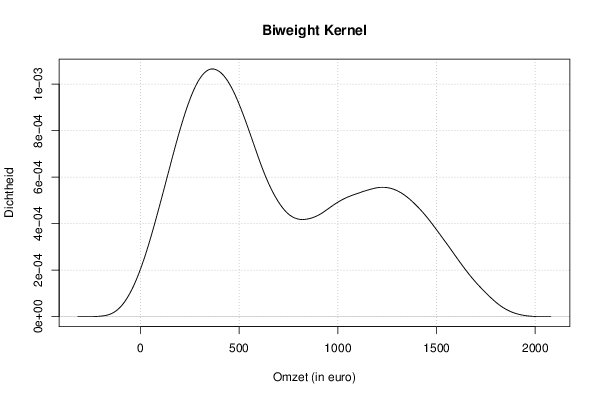
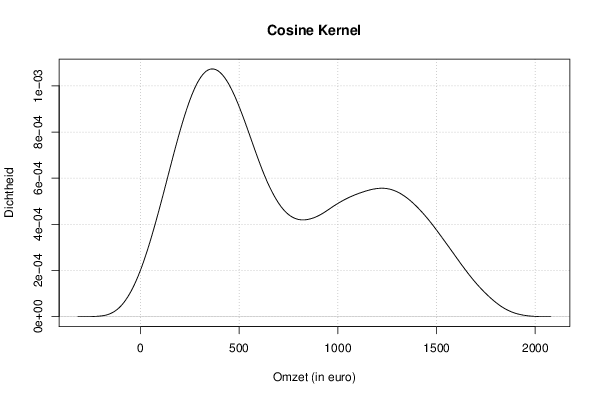
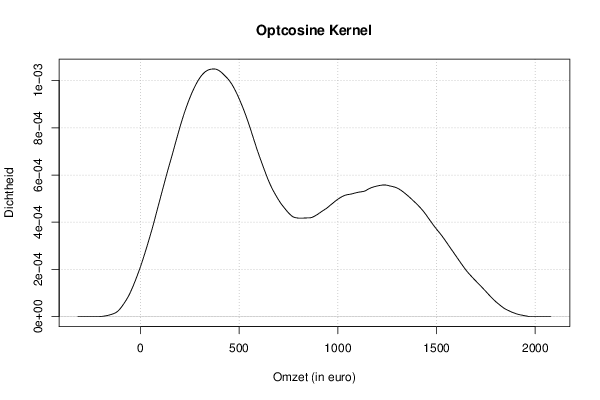
Properties of Density Trace
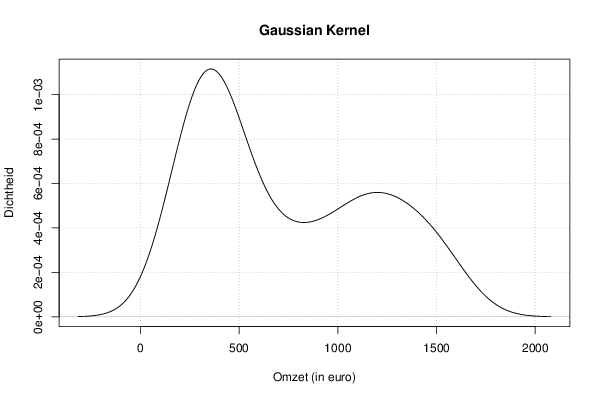
Bandwidth153.845771490301
#Observations120

\begin{tabular}{lllllllll}
\hline
Properties of Density Trace \tabularnewline
Bandwidth & 153.845771490301 \tabularnewline
#Observations & 120 \tabularnewline
\hline
\end{tabular}
%Source: https://freestatistics.org/blog/index.php?pk=296421&T=1

[TABLE]
[ROW][C]Properties of Density Trace[/C][/ROW]
[ROW][C]Bandwidth[/C][C]153.845771490301[/C][/ROW]
[ROW][C]#Observations[/C][C]120[/C][/ROW]
[/TABLE]
Source: https://freestatistics.org/blog/index.php?pk=296421&T=1

Globally Unique Identifier (entire table): ba.freestatistics.org/blog/index.php?pk=296421&T=1

As an alternative you can also use a QR Code:  

The GUIDs for individual cells are displayed in the table below:

Properties of Density Trace
Bandwidth153.845771490301
#Observations120


Maximum Density Values
Kernelx-valuemax. density
Gaussian358.4274537631870.00111602628709264
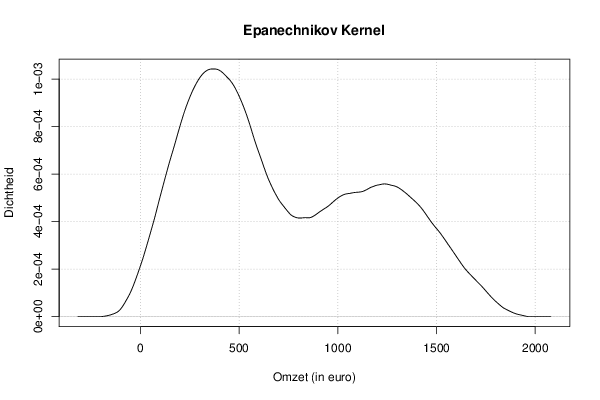
Epanechnikov367.8054366553270.00104246282683254
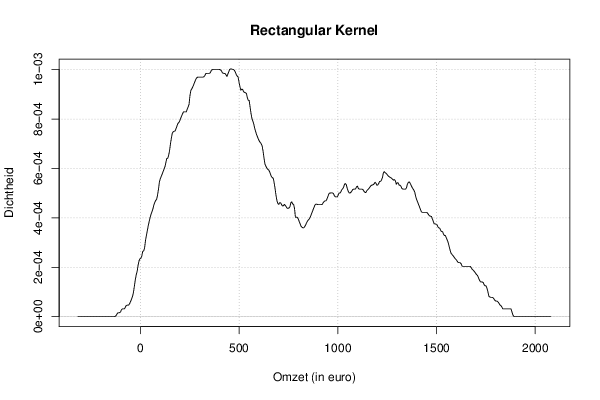
Rectangular456.8962741306580.00100275183826388
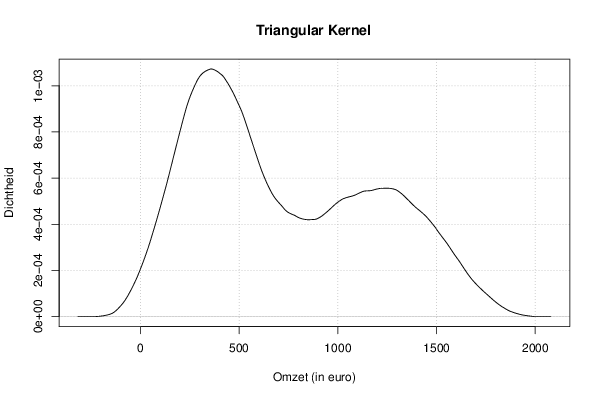
Triangular358.4274537631870.00107285806700127
Biweight363.1164452092570.00106558894373265
Cosine363.1164452092570.00107315975279902
Optcosine372.4944281013970.00104937624691161

\begin{tabular}{lllllllll}
\hline
Maximum Density Values \tabularnewline
Kernel & x-value & max. density \tabularnewline
Gaussian & 358.427453763187 & 0.00111602628709264 \tabularnewline
Epanechnikov & 367.805436655327 & 0.00104246282683254 \tabularnewline
Rectangular & 456.896274130658 & 0.00100275183826388 \tabularnewline
Triangular & 358.427453763187 & 0.00107285806700127 \tabularnewline
Biweight & 363.116445209257 & 0.00106558894373265 \tabularnewline
Cosine & 363.116445209257 & 0.00107315975279902 \tabularnewline
Optcosine & 372.494428101397 & 0.00104937624691161 \tabularnewline
\hline
\end{tabular}
%Source: https://freestatistics.org/blog/index.php?pk=296421&T=2

[TABLE]
[ROW][C]Maximum Density Values[/C][/ROW]
[ROW][C]Kernel[/C][C]x-value[/C][C]max. density[/C][/ROW]
[ROW][C]Gaussian[/C][C]358.427453763187[/C][C]0.00111602628709264[/C][/ROW]
[ROW][C]Epanechnikov[/C][C]367.805436655327[/C][C]0.00104246282683254[/C][/ROW]
[ROW][C]Rectangular[/C][C]456.896274130658[/C][C]0.00100275183826388[/C][/ROW]
[ROW][C]Triangular[/C][C]358.427453763187[/C][C]0.00107285806700127[/C][/ROW]
[ROW][C]Biweight[/C][C]363.116445209257[/C][C]0.00106558894373265[/C][/ROW]
[ROW][C]Cosine[/C][C]363.116445209257[/C][C]0.00107315975279902[/C][/ROW]
[ROW][C]Optcosine[/C][C]372.494428101397[/C][C]0.00104937624691161[/C][/ROW]
[/TABLE]
Source: https://freestatistics.org/blog/index.php?pk=296421&T=2

Globally Unique Identifier (entire table): ba.freestatistics.org/blog/index.php?pk=296421&T=2

As an alternative you can also use a QR Code:  

The GUIDs for individual cells are displayed in the table below:

Maximum Density Values
Kernelx-valuemax. density
Gaussian358.4274537631870.00111602628709264
Epanechnikov367.8054366553270.00104246282683254
Rectangular456.8962741306580.00100275183826388
Triangular358.4274537631870.00107285806700127
Biweight363.1164452092570.00106558894373265
Cosine363.1164452092570.00107315975279902
Optcosine372.4944281013970.00104937624691161


Kernel Density Values
x-valueGaussianEpanechnikovRectangularTriangularBiweightCosineOptcosine
Kernel Density Values are not shown

\begin{tabular}{lllllllll}
\hline
Kernel Density Values \tabularnewline
x-value & Gaussian & Epanechnikov & Rectangular & Triangular & Biweight & Cosine & Optcosine \tabularnewline
Kernel Density Values are not shown \tabularnewline
\hline
\end{tabular}
%Source: https://freestatistics.org/blog/index.php?pk=296421&T=3

[TABLE]
[ROW][C]Kernel Density Values[/C][/ROW]
[ROW][C]x-value[/C][C]Gaussian[/C][C]Epanechnikov[/C][C]Rectangular[/C][C]Triangular[/C][C]Biweight[/C][C]Cosine[/C][C]Optcosine[/C][/ROW]
[ROW][C]Kernel Density Values are not shown[/C][/ROW]
[/TABLE]
Source: https://freestatistics.org/blog/index.php?pk=296421&T=3

Globally Unique Identifier (entire table): ba.freestatistics.org/blog/index.php?pk=296421&T=3

As an alternative you can also use a QR Code:  

The GUIDs for individual cells are displayed in the table below:

Kernel Density Values
x-valueGaussianEpanechnikovRectangularTriangularBiweightCosineOptcosine
Kernel Density Values are not shown


Parameters (Session):
par1 = 0 ; par2 = no ; par3 = 512 ;
Parameters (R input):
par1 = 0 ; par2 = no ; par3 = 512 ;
R code (references can be found in the software module):
if (par1 == '0') bw <- 'nrd0'
if (par1 != '0') bw <- as.numeric(par1)
par3 <- as.numeric(par3)
mydensity <- array(NA, dim=c(par3,8))
bitmap(file='density1.png')
mydensity1<-density(x,bw=bw,kernel='gaussian',na.rm=TRUE)
mydensity[,8] = signif(mydensity1$x,3)
mydensity[,1] = signif(mydensity1$y,3)
plot(mydensity1,main='Gaussian Kernel',xlab=xlab,ylab=ylab)
grid()
dev.off()
mydensity1
bitmap(file='density2.png')
mydensity2<-density(x,bw=bw,kernel='epanechnikov',na.rm=TRUE)
mydensity[,2] = signif(mydensity2$y,3)
plot(mydensity2,main='Epanechnikov Kernel',xlab=xlab,ylab=ylab)
grid()
dev.off()
bitmap(file='density3.png')
mydensity3<-density(x,bw=bw,kernel='rectangular',na.rm=TRUE)
mydensity[,3] = signif(mydensity3$y,3)
plot(mydensity3,main='Rectangular Kernel',xlab=xlab,ylab=ylab)
grid()
dev.off()
bitmap(file='density4.png')
mydensity4<-density(x,bw=bw,kernel='triangular',na.rm=TRUE)
mydensity[,4] = signif(mydensity4$y,3)
plot(mydensity4,main='Triangular Kernel',xlab=xlab,ylab=ylab)
grid()
dev.off()
bitmap(file='density5.png')
mydensity5<-density(x,bw=bw,kernel='biweight',na.rm=TRUE)
mydensity[,5] = signif(mydensity5$y,3)
plot(mydensity5,main='Biweight Kernel',xlab=xlab,ylab=ylab)
grid()
dev.off()
bitmap(file='density6.png')
mydensity6<-density(x,bw=bw,kernel='cosine',na.rm=TRUE)
mydensity[,6] = signif(mydensity6$y,3)
plot(mydensity6,main='Cosine Kernel',xlab=xlab,ylab=ylab)
grid()
dev.off()
bitmap(file='density7.png')
mydensity7<-density(x,bw=bw,kernel='optcosine',na.rm=TRUE)
mydensity[,7] = signif(mydensity7$y,3)
plot(mydensity7,main='Optcosine Kernel',xlab=xlab,ylab=ylab)
grid()
dev.off()
load(file='createtable')
ab<-table.start()
ab<-table.row.start(ab)
ab<-table.element(ab,'Properties of Density Trace',2,TRUE)
ab<-table.row.end(ab)
ab<-table.row.start(ab)
ab<-table.element(ab,'Bandwidth',header=TRUE)
ab<-table.element(ab,mydensity1$bw)
ab<-table.row.end(ab)
ab<-table.row.start(ab)
ab<-table.element(ab,'#Observations',header=TRUE)
ab<-table.element(ab,mydensity1$n)
ab<-table.row.end(ab)
ab<-table.end(ab)
a <- ab
table.save(ab,file='mytable123.tab')
b<-table.start()
b<-table.row.start(b)
b<-table.element(b,'Maximum Density Values',3,TRUE)
b<-table.row.end(b)
b<-table.row.start(b)
b<-table.element(b,'Kernel',1,TRUE)
b<-table.element(b,'x-value',1,TRUE)
b<-table.element(b,'max. density',1,TRUE)
b<-table.row.end(b)
b<-table.row.start(b)
b<-table.element(b,'Gaussian',1,TRUE)
b<-table.element(b,mydensity1$x[mydensity1$y==max(mydensity1$y)],1)
b<-table.element(b,mydensity1$y[mydensity1$y==max(mydensity1$y)],1)
b<-table.row.end(b)
b<-table.row.start(b)
b<-table.element(b,'Epanechnikov',1,TRUE)
b<-table.element(b,mydensity2$x[mydensity2$y==max(mydensity2$y)],1)
b<-table.element(b,mydensity2$y[mydensity2$y==max(mydensity2$y)],1)
b<-table.row.end(b)
b<-table.row.start(b)
b<-table.element(b,'Rectangular',1,TRUE)
b<-table.element(b,mydensity3$x[mydensity3$y==max(mydensity3$y)],1)
b<-table.element(b,mydensity3$y[mydensity3$y==max(mydensity3$y)],1)
b<-table.row.end(b)
b<-table.row.start(b)
b<-table.element(b,'Triangular',1,TRUE)
b<-table.element(b,mydensity4$x[mydensity4$y==max(mydensity4$y)],1)
b<-table.element(b,mydensity4$y[mydensity4$y==max(mydensity4$y)],1)
b<-table.row.end(b)
b<-table.row.start(b)
b<-table.element(b,'Biweight',1,TRUE)
b<-table.element(b,mydensity5$x[mydensity5$y==max(mydensity5$y)],1)
b<-table.element(b,mydensity5$y[mydensity5$y==max(mydensity5$y)],1)
b<-table.row.end(b)
b<-table.row.start(b)
b<-table.element(b,'Cosine',1,TRUE)
b<-table.element(b,mydensity6$x[mydensity6$y==max(mydensity6$y)],1)
b<-table.element(b,mydensity6$y[mydensity6$y==max(mydensity6$y)],1)
b<-table.row.end(b)
b<-table.row.start(b)
b<-table.element(b,'Optcosine',1,TRUE)
b<-table.element(b,mydensity7$x[mydensity7$y==max(mydensity7$y)],1)
b<-table.element(b,mydensity7$y[mydensity7$y==max(mydensity7$y)],1)
b<-table.row.end(b)
b<-table.end(b)
a <- b[1]
table.save(b,file='mytable2a.tab')
a<-table.start()
a<-table.row.start(a)
a<-table.element(a,'Kernel Density Values',8,TRUE)
a<-table.row.end(a)
a<-table.row.start(a)
a<-table.element(a,'x-value',1,TRUE)
a<-table.element(a,'Gaussian',1,TRUE)
a<-table.element(a,'Epanechnikov',1,TRUE)
a<-table.element(a,'Rectangular',1,TRUE)
a<-table.element(a,'Triangular',1,TRUE)
a<-table.element(a,'Biweight',1,TRUE)
a<-table.element(a,'Cosine',1,TRUE)
a<-table.element(a,'Optcosine',1,TRUE)
a<-table.row.end(a)
if (par2=='yes') {
for(i in 1:par3) {
a<-table.row.start(a)
a<-table.element(a,mydensity[i,8],1,TRUE)
for(j in 1:7) {
a<-table.element(a,mydensity[i,j],1)
}
a<-table.row.end(a)
}
} else {
a<-table.row.start(a)
a<-table.element(a,'Kernel Density Values are not shown',8)
a<-table.row.end(a)
}
a<-table.end(a)
table.save(a,file='mytable1.tab')