Free Statistics

of Irreproducible Research!

Author's title

Author*Unverified author*
R Software Modulerwasp_autocorrelation.wasp
Title produced by software(Partial) Autocorrelation Function
Date of computationFri, 12 Aug 2016 20:43:28 +0100
Cite this page as followsStatistical Computations at FreeStatistics.org, Office for Research Development and Education, URL https://freestatistics.org/blog/index.php?v=date/2016/Aug/12/t14710310433t1o6izk1wb8fol.htm/, Retrieved Sun, 05 May 2024 11:13:38 +0000
Statistical Computations at FreeStatistics.org, Office for Research Development and Education, URL https://freestatistics.org/blog/index.php?pk=296469, Retrieved Sun, 05 May 2024 11:13:38 +0000
QR Codes:

Original text written by user:
IsPrivate?No (this computation is public)
User-defined keywords
Estimated Impact59
Family? (F = Feedback message, R = changed R code, M = changed R Module, P = changed Parameters, D = changed Data)
-       [(Partial) Autocorrelation Function] [] [2016-08-12 19:43:28] [517bf63cbd197750110a40d4d2cd39d6] [Current]
Feedback Forum

Post a new message
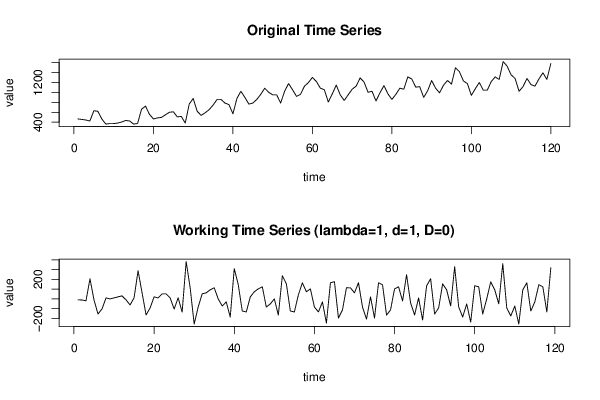
Dataseries X:
465
455
444
424
630
620
465
362
372
372
382
403
434
424
362
372
661
723
558
465
486
496
548
599
610
506
517
382
765
878
620
537
589
651
744
858
858
785
754
568
878
1023
899
765
785
858
961
1085
1002
951
951
785
1023
1178
1054
920
961
1126
1199
1302
1219
1085
1054
806
971
1147
951
837
951
1064
1126
1292
1209
1002
1023
827
992
1137
971
858
961
1085
1064
1312
1271
1106
1116
899
1033
1240
1085
992
1147
1240
1168
1498
1416
1230
1178
940
1075
1199
1044
1044
1219
1312
1261
1622
1529
1354
1281
1023
1116
1281
1157
1126
1271
1395
1261
1581


Summary of computational transaction
Raw Inputview raw input (R code)
Raw Outputview raw output of R engine
Computing time1 seconds
R Server'Gertrude Mary Cox' @ cox.wessa.net

\begin{tabular}{lllllllll}
\hline
Summary of computational transaction \tabularnewline
Raw Input & view raw input (R code)  \tabularnewline
Raw Output & view raw output of R engine  \tabularnewline
Computing time & 1 seconds \tabularnewline
R Server & 'Gertrude Mary Cox' @ cox.wessa.net \tabularnewline
\hline
\end{tabular}
%Source: https://freestatistics.org/blog/index.php?pk=296469&T=0

[TABLE]
[ROW][C]Summary of computational transaction[/C][/ROW]
[ROW][C]Raw Input[/C][C]view raw input (R code) [/C][/ROW]
[ROW][C]Raw Output[/C][C]view raw output of R engine [/C][/ROW]
[ROW][C]Computing time[/C][C]1 seconds[/C][/ROW]
[ROW][C]R Server[/C][C]'Gertrude Mary Cox' @ cox.wessa.net[/C][/ROW]
[/TABLE]
Source: https://freestatistics.org/blog/index.php?pk=296469&T=0

Globally Unique Identifier (entire table): ba.freestatistics.org/blog/index.php?pk=296469&T=0

As an alternative you can also use a QR Code:  

The GUIDs for individual cells are displayed in the table below:

Summary of computational transaction
Raw Inputview raw input (R code)
Raw Outputview raw output of R engine
Computing time1 seconds
R Server'Gertrude Mary Cox' @ cox.wessa.net


Autocorrelation Function
Time lag kACF(k)T-STATP-value
1-0.047312-0.51610.303366
2-0.343736-3.74970.000137
3-0.000311-0.00340.498648
4-0.184701-2.01490.023087
5-0.024697-0.26940.394038
60.2530382.76030.003345
70.0448720.48950.312696
8-0.223126-2.4340.008209
9-0.006983-0.07620.469705
10-0.33374-3.64070.000202
11-0.09157-0.99890.159933
120.8598059.37940
130.0102230.11150.455694
14-0.311297-3.39580.000465
15-0.02605-0.28420.388385
16-0.148872-1.6240.05351
17-0.04419-0.48210.315325
180.2438042.65960.004451
190.0990541.08060.141041
20-0.210924-2.30090.011569
21-0.009144-0.09970.460356
22-0.288268-3.14460.00105
23-0.112614-1.22850.110847
240.7193477.84720
250.039520.43110.333584
26-0.281803-3.07410.001309
27-0.040777-0.44480.328628
28-0.121328-1.32350.094098
29-0.066612-0.72670.234433
300.2098912.28960.011902
310.1456371.58870.05739
32-0.198538-2.16580.016161
33-0.015106-0.16480.434696
34-0.215108-2.34650.010301
35-0.117534-1.28210.101142
360.5664256.1790
370.0731660.79810.213187
38-0.231031-2.52020.006526
39-0.042755-0.46640.320889
40-0.084586-0.92270.17901
41-0.080666-0.880.190326
420.1700951.85550.032999
430.1812021.97670.025195
44-0.192188-2.09650.019077
45-0.031175-0.34010.367198
46-0.159464-1.73950.042262
47-0.118838-1.29640.098678
480.4338544.73283e-06
490.0868210.94710.172752
50-0.213864-2.3330.010664
51-0.045159-0.49260.311594
52-0.029742-0.32440.373084
53-0.079497-0.86720.193787
540.1201841.31110.096181
550.2109972.30170.011546
56-0.146448-1.59760.056396
57-0.045306-0.49420.311027
58-0.120366-1.3130.095847
59-0.114821-1.25250.106413
600.3185943.47540.000356

\begin{tabular}{lllllllll}
\hline
Autocorrelation Function \tabularnewline
Time lag k & ACF(k) & T-STAT & P-value \tabularnewline
1 & -0.047312 & -0.5161 & 0.303366 \tabularnewline
2 & -0.343736 & -3.7497 & 0.000137 \tabularnewline
3 & -0.000311 & -0.0034 & 0.498648 \tabularnewline
4 & -0.184701 & -2.0149 & 0.023087 \tabularnewline
5 & -0.024697 & -0.2694 & 0.394038 \tabularnewline
6 & 0.253038 & 2.7603 & 0.003345 \tabularnewline
7 & 0.044872 & 0.4895 & 0.312696 \tabularnewline
8 & -0.223126 & -2.434 & 0.008209 \tabularnewline
9 & -0.006983 & -0.0762 & 0.469705 \tabularnewline
10 & -0.33374 & -3.6407 & 0.000202 \tabularnewline
11 & -0.09157 & -0.9989 & 0.159933 \tabularnewline
12 & 0.859805 & 9.3794 & 0 \tabularnewline
13 & 0.010223 & 0.1115 & 0.455694 \tabularnewline
14 & -0.311297 & -3.3958 & 0.000465 \tabularnewline
15 & -0.02605 & -0.2842 & 0.388385 \tabularnewline
16 & -0.148872 & -1.624 & 0.05351 \tabularnewline
17 & -0.04419 & -0.4821 & 0.315325 \tabularnewline
18 & 0.243804 & 2.6596 & 0.004451 \tabularnewline
19 & 0.099054 & 1.0806 & 0.141041 \tabularnewline
20 & -0.210924 & -2.3009 & 0.011569 \tabularnewline
21 & -0.009144 & -0.0997 & 0.460356 \tabularnewline
22 & -0.288268 & -3.1446 & 0.00105 \tabularnewline
23 & -0.112614 & -1.2285 & 0.110847 \tabularnewline
24 & 0.719347 & 7.8472 & 0 \tabularnewline
25 & 0.03952 & 0.4311 & 0.333584 \tabularnewline
26 & -0.281803 & -3.0741 & 0.001309 \tabularnewline
27 & -0.040777 & -0.4448 & 0.328628 \tabularnewline
28 & -0.121328 & -1.3235 & 0.094098 \tabularnewline
29 & -0.066612 & -0.7267 & 0.234433 \tabularnewline
30 & 0.209891 & 2.2896 & 0.011902 \tabularnewline
31 & 0.145637 & 1.5887 & 0.05739 \tabularnewline
32 & -0.198538 & -2.1658 & 0.016161 \tabularnewline
33 & -0.015106 & -0.1648 & 0.434696 \tabularnewline
34 & -0.215108 & -2.3465 & 0.010301 \tabularnewline
35 & -0.117534 & -1.2821 & 0.101142 \tabularnewline
36 & 0.566425 & 6.179 & 0 \tabularnewline
37 & 0.073166 & 0.7981 & 0.213187 \tabularnewline
38 & -0.231031 & -2.5202 & 0.006526 \tabularnewline
39 & -0.042755 & -0.4664 & 0.320889 \tabularnewline
40 & -0.084586 & -0.9227 & 0.17901 \tabularnewline
41 & -0.080666 & -0.88 & 0.190326 \tabularnewline
42 & 0.170095 & 1.8555 & 0.032999 \tabularnewline
43 & 0.181202 & 1.9767 & 0.025195 \tabularnewline
44 & -0.192188 & -2.0965 & 0.019077 \tabularnewline
45 & -0.031175 & -0.3401 & 0.367198 \tabularnewline
46 & -0.159464 & -1.7395 & 0.042262 \tabularnewline
47 & -0.118838 & -1.2964 & 0.098678 \tabularnewline
48 & 0.433854 & 4.7328 & 3e-06 \tabularnewline
49 & 0.086821 & 0.9471 & 0.172752 \tabularnewline
50 & -0.213864 & -2.333 & 0.010664 \tabularnewline
51 & -0.045159 & -0.4926 & 0.311594 \tabularnewline
52 & -0.029742 & -0.3244 & 0.373084 \tabularnewline
53 & -0.079497 & -0.8672 & 0.193787 \tabularnewline
54 & 0.120184 & 1.3111 & 0.096181 \tabularnewline
55 & 0.210997 & 2.3017 & 0.011546 \tabularnewline
56 & -0.146448 & -1.5976 & 0.056396 \tabularnewline
57 & -0.045306 & -0.4942 & 0.311027 \tabularnewline
58 & -0.120366 & -1.313 & 0.095847 \tabularnewline
59 & -0.114821 & -1.2525 & 0.106413 \tabularnewline
60 & 0.318594 & 3.4754 & 0.000356 \tabularnewline
\hline
\end{tabular}
%Source: https://freestatistics.org/blog/index.php?pk=296469&T=1

[TABLE]
[ROW][C]Autocorrelation Function[/C][/ROW]
[ROW][C]Time lag k[/C][C]ACF(k)[/C][C]T-STAT[/C][C]P-value[/C][/ROW]
[ROW][C]1[/C][C]-0.047312[/C][C]-0.5161[/C][C]0.303366[/C][/ROW]
[ROW][C]2[/C][C]-0.343736[/C][C]-3.7497[/C][C]0.000137[/C][/ROW]
[ROW][C]3[/C][C]-0.000311[/C][C]-0.0034[/C][C]0.498648[/C][/ROW]
[ROW][C]4[/C][C]-0.184701[/C][C]-2.0149[/C][C]0.023087[/C][/ROW]
[ROW][C]5[/C][C]-0.024697[/C][C]-0.2694[/C][C]0.394038[/C][/ROW]
[ROW][C]6[/C][C]0.253038[/C][C]2.7603[/C][C]0.003345[/C][/ROW]
[ROW][C]7[/C][C]0.044872[/C][C]0.4895[/C][C]0.312696[/C][/ROW]
[ROW][C]8[/C][C]-0.223126[/C][C]-2.434[/C][C]0.008209[/C][/ROW]
[ROW][C]9[/C][C]-0.006983[/C][C]-0.0762[/C][C]0.469705[/C][/ROW]
[ROW][C]10[/C][C]-0.33374[/C][C]-3.6407[/C][C]0.000202[/C][/ROW]
[ROW][C]11[/C][C]-0.09157[/C][C]-0.9989[/C][C]0.159933[/C][/ROW]
[ROW][C]12[/C][C]0.859805[/C][C]9.3794[/C][C]0[/C][/ROW]
[ROW][C]13[/C][C]0.010223[/C][C]0.1115[/C][C]0.455694[/C][/ROW]
[ROW][C]14[/C][C]-0.311297[/C][C]-3.3958[/C][C]0.000465[/C][/ROW]
[ROW][C]15[/C][C]-0.02605[/C][C]-0.2842[/C][C]0.388385[/C][/ROW]
[ROW][C]16[/C][C]-0.148872[/C][C]-1.624[/C][C]0.05351[/C][/ROW]
[ROW][C]17[/C][C]-0.04419[/C][C]-0.4821[/C][C]0.315325[/C][/ROW]
[ROW][C]18[/C][C]0.243804[/C][C]2.6596[/C][C]0.004451[/C][/ROW]
[ROW][C]19[/C][C]0.099054[/C][C]1.0806[/C][C]0.141041[/C][/ROW]
[ROW][C]20[/C][C]-0.210924[/C][C]-2.3009[/C][C]0.011569[/C][/ROW]
[ROW][C]21[/C][C]-0.009144[/C][C]-0.0997[/C][C]0.460356[/C][/ROW]
[ROW][C]22[/C][C]-0.288268[/C][C]-3.1446[/C][C]0.00105[/C][/ROW]
[ROW][C]23[/C][C]-0.112614[/C][C]-1.2285[/C][C]0.110847[/C][/ROW]
[ROW][C]24[/C][C]0.719347[/C][C]7.8472[/C][C]0[/C][/ROW]
[ROW][C]25[/C][C]0.03952[/C][C]0.4311[/C][C]0.333584[/C][/ROW]
[ROW][C]26[/C][C]-0.281803[/C][C]-3.0741[/C][C]0.001309[/C][/ROW]
[ROW][C]27[/C][C]-0.040777[/C][C]-0.4448[/C][C]0.328628[/C][/ROW]
[ROW][C]28[/C][C]-0.121328[/C][C]-1.3235[/C][C]0.094098[/C][/ROW]
[ROW][C]29[/C][C]-0.066612[/C][C]-0.7267[/C][C]0.234433[/C][/ROW]
[ROW][C]30[/C][C]0.209891[/C][C]2.2896[/C][C]0.011902[/C][/ROW]
[ROW][C]31[/C][C]0.145637[/C][C]1.5887[/C][C]0.05739[/C][/ROW]
[ROW][C]32[/C][C]-0.198538[/C][C]-2.1658[/C][C]0.016161[/C][/ROW]
[ROW][C]33[/C][C]-0.015106[/C][C]-0.1648[/C][C]0.434696[/C][/ROW]
[ROW][C]34[/C][C]-0.215108[/C][C]-2.3465[/C][C]0.010301[/C][/ROW]
[ROW][C]35[/C][C]-0.117534[/C][C]-1.2821[/C][C]0.101142[/C][/ROW]
[ROW][C]36[/C][C]0.566425[/C][C]6.179[/C][C]0[/C][/ROW]
[ROW][C]37[/C][C]0.073166[/C][C]0.7981[/C][C]0.213187[/C][/ROW]
[ROW][C]38[/C][C]-0.231031[/C][C]-2.5202[/C][C]0.006526[/C][/ROW]
[ROW][C]39[/C][C]-0.042755[/C][C]-0.4664[/C][C]0.320889[/C][/ROW]
[ROW][C]40[/C][C]-0.084586[/C][C]-0.9227[/C][C]0.17901[/C][/ROW]
[ROW][C]41[/C][C]-0.080666[/C][C]-0.88[/C][C]0.190326[/C][/ROW]
[ROW][C]42[/C][C]0.170095[/C][C]1.8555[/C][C]0.032999[/C][/ROW]
[ROW][C]43[/C][C]0.181202[/C][C]1.9767[/C][C]0.025195[/C][/ROW]
[ROW][C]44[/C][C]-0.192188[/C][C]-2.0965[/C][C]0.019077[/C][/ROW]
[ROW][C]45[/C][C]-0.031175[/C][C]-0.3401[/C][C]0.367198[/C][/ROW]
[ROW][C]46[/C][C]-0.159464[/C][C]-1.7395[/C][C]0.042262[/C][/ROW]
[ROW][C]47[/C][C]-0.118838[/C][C]-1.2964[/C][C]0.098678[/C][/ROW]
[ROW][C]48[/C][C]0.433854[/C][C]4.7328[/C][C]3e-06[/C][/ROW]
[ROW][C]49[/C][C]0.086821[/C][C]0.9471[/C][C]0.172752[/C][/ROW]
[ROW][C]50[/C][C]-0.213864[/C][C]-2.333[/C][C]0.010664[/C][/ROW]
[ROW][C]51[/C][C]-0.045159[/C][C]-0.4926[/C][C]0.311594[/C][/ROW]
[ROW][C]52[/C][C]-0.029742[/C][C]-0.3244[/C][C]0.373084[/C][/ROW]
[ROW][C]53[/C][C]-0.079497[/C][C]-0.8672[/C][C]0.193787[/C][/ROW]
[ROW][C]54[/C][C]0.120184[/C][C]1.3111[/C][C]0.096181[/C][/ROW]
[ROW][C]55[/C][C]0.210997[/C][C]2.3017[/C][C]0.011546[/C][/ROW]
[ROW][C]56[/C][C]-0.146448[/C][C]-1.5976[/C][C]0.056396[/C][/ROW]
[ROW][C]57[/C][C]-0.045306[/C][C]-0.4942[/C][C]0.311027[/C][/ROW]
[ROW][C]58[/C][C]-0.120366[/C][C]-1.313[/C][C]0.095847[/C][/ROW]
[ROW][C]59[/C][C]-0.114821[/C][C]-1.2525[/C][C]0.106413[/C][/ROW]
[ROW][C]60[/C][C]0.318594[/C][C]3.4754[/C][C]0.000356[/C][/ROW]
[/TABLE]
Source: https://freestatistics.org/blog/index.php?pk=296469&T=1

Globally Unique Identifier (entire table): ba.freestatistics.org/blog/index.php?pk=296469&T=1

As an alternative you can also use a QR Code:  

The GUIDs for individual cells are displayed in the table below:

Autocorrelation Function
Time lag kACF(k)T-STATP-value
1-0.047312-0.51610.303366
2-0.343736-3.74970.000137
3-0.000311-0.00340.498648
4-0.184701-2.01490.023087
5-0.024697-0.26940.394038
60.2530382.76030.003345
70.0448720.48950.312696
8-0.223126-2.4340.008209
9-0.006983-0.07620.469705
10-0.33374-3.64070.000202
11-0.09157-0.99890.159933
120.8598059.37940
130.0102230.11150.455694
14-0.311297-3.39580.000465
15-0.02605-0.28420.388385
16-0.148872-1.6240.05351
17-0.04419-0.48210.315325
180.2438042.65960.004451
190.0990541.08060.141041
20-0.210924-2.30090.011569
21-0.009144-0.09970.460356
22-0.288268-3.14460.00105
23-0.112614-1.22850.110847
240.7193477.84720
250.039520.43110.333584
26-0.281803-3.07410.001309
27-0.040777-0.44480.328628
28-0.121328-1.32350.094098
29-0.066612-0.72670.234433
300.2098912.28960.011902
310.1456371.58870.05739
32-0.198538-2.16580.016161
33-0.015106-0.16480.434696
34-0.215108-2.34650.010301
35-0.117534-1.28210.101142
360.5664256.1790
370.0731660.79810.213187
38-0.231031-2.52020.006526
39-0.042755-0.46640.320889
40-0.084586-0.92270.17901
41-0.080666-0.880.190326
420.1700951.85550.032999
430.1812021.97670.025195
44-0.192188-2.09650.019077
45-0.031175-0.34010.367198
46-0.159464-1.73950.042262
47-0.118838-1.29640.098678
480.4338544.73283e-06
490.0868210.94710.172752
50-0.213864-2.3330.010664
51-0.045159-0.49260.311594
52-0.029742-0.32440.373084
53-0.079497-0.86720.193787
540.1201841.31110.096181
550.2109972.30170.011546
56-0.146448-1.59760.056396
57-0.045306-0.49420.311027
58-0.120366-1.3130.095847
59-0.114821-1.25250.106413
600.3185943.47540.000356


Partial Autocorrelation Function
Time lag kPACF(k)T-STATP-value
1-0.047312-0.51610.303366
2-0.346751-3.78260.000122
3-0.043995-0.47990.316078
4-0.350374-3.82210.000106
5-0.108632-1.1850.119181
60.0421420.45970.323279
70.0138090.15060.44026
8-0.197638-2.1560.016549
9-0.036438-0.39750.345858
10-0.564524-6.15820
11-0.401237-4.3771.3e-05
120.6755957.36990
13-0.008378-0.09140.463669
140.0670730.73170.232902
15-0.144503-1.57630.058801
16-0.06006-0.65520.256809
170.0615150.6710.251746
18-0.052401-0.57160.284325
19-0.02331-0.25430.399858
200.0343630.37490.354217
21-0.009671-0.10550.458078
220.1361391.48510.070081
230.0209010.2280.410018
24-0.047781-0.52120.301588
25-0.08545-0.93210.176575
26-0.072003-0.78550.216872
270.0326030.35570.361364
28000.499999
29-0.042628-0.4650.321385
30-0.100288-1.0940.138079
31-0.002888-0.03150.487458
32-0.042164-0.460.323195
33-0.027173-0.29640.383712
340.0623630.68030.248817
35-0.025916-0.28270.388944
36-0.144823-1.57980.0584
37-0.006756-0.07370.470689
38-0.003992-0.04350.48267
390.0912590.99550.160752
400.0223050.24330.404087
41-0.040807-0.44520.328509
420.0085180.09290.463063
430.0543650.59310.277136
44-0.020592-0.22460.411326
45-0.007086-0.07730.469259
46-0.094486-1.03070.15238
47-0.028405-0.30990.378602
480.010440.11390.454758
490.001220.01330.494704
50-0.151435-1.6520.05059
51-0.08769-0.95660.170359
52-0.009225-0.10060.460007
530.050750.55360.29044
54-0.059433-0.64830.259007
55-0.057068-0.62250.267391
560.0617090.67320.251072
570.0296920.32390.37329
58-0.049015-0.53470.296929
59-0.076626-0.83590.202445
60-0.096869-1.05670.146391

\begin{tabular}{lllllllll}
\hline
Partial Autocorrelation Function \tabularnewline
Time lag k & PACF(k) & T-STAT & P-value \tabularnewline
1 & -0.047312 & -0.5161 & 0.303366 \tabularnewline
2 & -0.346751 & -3.7826 & 0.000122 \tabularnewline
3 & -0.043995 & -0.4799 & 0.316078 \tabularnewline
4 & -0.350374 & -3.8221 & 0.000106 \tabularnewline
5 & -0.108632 & -1.185 & 0.119181 \tabularnewline
6 & 0.042142 & 0.4597 & 0.323279 \tabularnewline
7 & 0.013809 & 0.1506 & 0.44026 \tabularnewline
8 & -0.197638 & -2.156 & 0.016549 \tabularnewline
9 & -0.036438 & -0.3975 & 0.345858 \tabularnewline
10 & -0.564524 & -6.1582 & 0 \tabularnewline
11 & -0.401237 & -4.377 & 1.3e-05 \tabularnewline
12 & 0.675595 & 7.3699 & 0 \tabularnewline
13 & -0.008378 & -0.0914 & 0.463669 \tabularnewline
14 & 0.067073 & 0.7317 & 0.232902 \tabularnewline
15 & -0.144503 & -1.5763 & 0.058801 \tabularnewline
16 & -0.06006 & -0.6552 & 0.256809 \tabularnewline
17 & 0.061515 & 0.671 & 0.251746 \tabularnewline
18 & -0.052401 & -0.5716 & 0.284325 \tabularnewline
19 & -0.02331 & -0.2543 & 0.399858 \tabularnewline
20 & 0.034363 & 0.3749 & 0.354217 \tabularnewline
21 & -0.009671 & -0.1055 & 0.458078 \tabularnewline
22 & 0.136139 & 1.4851 & 0.070081 \tabularnewline
23 & 0.020901 & 0.228 & 0.410018 \tabularnewline
24 & -0.047781 & -0.5212 & 0.301588 \tabularnewline
25 & -0.08545 & -0.9321 & 0.176575 \tabularnewline
26 & -0.072003 & -0.7855 & 0.216872 \tabularnewline
27 & 0.032603 & 0.3557 & 0.361364 \tabularnewline
28 & 0 & 0 & 0.499999 \tabularnewline
29 & -0.042628 & -0.465 & 0.321385 \tabularnewline
30 & -0.100288 & -1.094 & 0.138079 \tabularnewline
31 & -0.002888 & -0.0315 & 0.487458 \tabularnewline
32 & -0.042164 & -0.46 & 0.323195 \tabularnewline
33 & -0.027173 & -0.2964 & 0.383712 \tabularnewline
34 & 0.062363 & 0.6803 & 0.248817 \tabularnewline
35 & -0.025916 & -0.2827 & 0.388944 \tabularnewline
36 & -0.144823 & -1.5798 & 0.0584 \tabularnewline
37 & -0.006756 & -0.0737 & 0.470689 \tabularnewline
38 & -0.003992 & -0.0435 & 0.48267 \tabularnewline
39 & 0.091259 & 0.9955 & 0.160752 \tabularnewline
40 & 0.022305 & 0.2433 & 0.404087 \tabularnewline
41 & -0.040807 & -0.4452 & 0.328509 \tabularnewline
42 & 0.008518 & 0.0929 & 0.463063 \tabularnewline
43 & 0.054365 & 0.5931 & 0.277136 \tabularnewline
44 & -0.020592 & -0.2246 & 0.411326 \tabularnewline
45 & -0.007086 & -0.0773 & 0.469259 \tabularnewline
46 & -0.094486 & -1.0307 & 0.15238 \tabularnewline
47 & -0.028405 & -0.3099 & 0.378602 \tabularnewline
48 & 0.01044 & 0.1139 & 0.454758 \tabularnewline
49 & 0.00122 & 0.0133 & 0.494704 \tabularnewline
50 & -0.151435 & -1.652 & 0.05059 \tabularnewline
51 & -0.08769 & -0.9566 & 0.170359 \tabularnewline
52 & -0.009225 & -0.1006 & 0.460007 \tabularnewline
53 & 0.05075 & 0.5536 & 0.29044 \tabularnewline
54 & -0.059433 & -0.6483 & 0.259007 \tabularnewline
55 & -0.057068 & -0.6225 & 0.267391 \tabularnewline
56 & 0.061709 & 0.6732 & 0.251072 \tabularnewline
57 & 0.029692 & 0.3239 & 0.37329 \tabularnewline
58 & -0.049015 & -0.5347 & 0.296929 \tabularnewline
59 & -0.076626 & -0.8359 & 0.202445 \tabularnewline
60 & -0.096869 & -1.0567 & 0.146391 \tabularnewline
\hline
\end{tabular}
%Source: https://freestatistics.org/blog/index.php?pk=296469&T=2

[TABLE]
[ROW][C]Partial Autocorrelation Function[/C][/ROW]
[ROW][C]Time lag k[/C][C]PACF(k)[/C][C]T-STAT[/C][C]P-value[/C][/ROW]
[ROW][C]1[/C][C]-0.047312[/C][C]-0.5161[/C][C]0.303366[/C][/ROW]
[ROW][C]2[/C][C]-0.346751[/C][C]-3.7826[/C][C]0.000122[/C][/ROW]
[ROW][C]3[/C][C]-0.043995[/C][C]-0.4799[/C][C]0.316078[/C][/ROW]
[ROW][C]4[/C][C]-0.350374[/C][C]-3.8221[/C][C]0.000106[/C][/ROW]
[ROW][C]5[/C][C]-0.108632[/C][C]-1.185[/C][C]0.119181[/C][/ROW]
[ROW][C]6[/C][C]0.042142[/C][C]0.4597[/C][C]0.323279[/C][/ROW]
[ROW][C]7[/C][C]0.013809[/C][C]0.1506[/C][C]0.44026[/C][/ROW]
[ROW][C]8[/C][C]-0.197638[/C][C]-2.156[/C][C]0.016549[/C][/ROW]
[ROW][C]9[/C][C]-0.036438[/C][C]-0.3975[/C][C]0.345858[/C][/ROW]
[ROW][C]10[/C][C]-0.564524[/C][C]-6.1582[/C][C]0[/C][/ROW]
[ROW][C]11[/C][C]-0.401237[/C][C]-4.377[/C][C]1.3e-05[/C][/ROW]
[ROW][C]12[/C][C]0.675595[/C][C]7.3699[/C][C]0[/C][/ROW]
[ROW][C]13[/C][C]-0.008378[/C][C]-0.0914[/C][C]0.463669[/C][/ROW]
[ROW][C]14[/C][C]0.067073[/C][C]0.7317[/C][C]0.232902[/C][/ROW]
[ROW][C]15[/C][C]-0.144503[/C][C]-1.5763[/C][C]0.058801[/C][/ROW]
[ROW][C]16[/C][C]-0.06006[/C][C]-0.6552[/C][C]0.256809[/C][/ROW]
[ROW][C]17[/C][C]0.061515[/C][C]0.671[/C][C]0.251746[/C][/ROW]
[ROW][C]18[/C][C]-0.052401[/C][C]-0.5716[/C][C]0.284325[/C][/ROW]
[ROW][C]19[/C][C]-0.02331[/C][C]-0.2543[/C][C]0.399858[/C][/ROW]
[ROW][C]20[/C][C]0.034363[/C][C]0.3749[/C][C]0.354217[/C][/ROW]
[ROW][C]21[/C][C]-0.009671[/C][C]-0.1055[/C][C]0.458078[/C][/ROW]
[ROW][C]22[/C][C]0.136139[/C][C]1.4851[/C][C]0.070081[/C][/ROW]
[ROW][C]23[/C][C]0.020901[/C][C]0.228[/C][C]0.410018[/C][/ROW]
[ROW][C]24[/C][C]-0.047781[/C][C]-0.5212[/C][C]0.301588[/C][/ROW]
[ROW][C]25[/C][C]-0.08545[/C][C]-0.9321[/C][C]0.176575[/C][/ROW]
[ROW][C]26[/C][C]-0.072003[/C][C]-0.7855[/C][C]0.216872[/C][/ROW]
[ROW][C]27[/C][C]0.032603[/C][C]0.3557[/C][C]0.361364[/C][/ROW]
[ROW][C]28[/C][C]0[/C][C]0[/C][C]0.499999[/C][/ROW]
[ROW][C]29[/C][C]-0.042628[/C][C]-0.465[/C][C]0.321385[/C][/ROW]
[ROW][C]30[/C][C]-0.100288[/C][C]-1.094[/C][C]0.138079[/C][/ROW]
[ROW][C]31[/C][C]-0.002888[/C][C]-0.0315[/C][C]0.487458[/C][/ROW]
[ROW][C]32[/C][C]-0.042164[/C][C]-0.46[/C][C]0.323195[/C][/ROW]
[ROW][C]33[/C][C]-0.027173[/C][C]-0.2964[/C][C]0.383712[/C][/ROW]
[ROW][C]34[/C][C]0.062363[/C][C]0.6803[/C][C]0.248817[/C][/ROW]
[ROW][C]35[/C][C]-0.025916[/C][C]-0.2827[/C][C]0.388944[/C][/ROW]
[ROW][C]36[/C][C]-0.144823[/C][C]-1.5798[/C][C]0.0584[/C][/ROW]
[ROW][C]37[/C][C]-0.006756[/C][C]-0.0737[/C][C]0.470689[/C][/ROW]
[ROW][C]38[/C][C]-0.003992[/C][C]-0.0435[/C][C]0.48267[/C][/ROW]
[ROW][C]39[/C][C]0.091259[/C][C]0.9955[/C][C]0.160752[/C][/ROW]
[ROW][C]40[/C][C]0.022305[/C][C]0.2433[/C][C]0.404087[/C][/ROW]
[ROW][C]41[/C][C]-0.040807[/C][C]-0.4452[/C][C]0.328509[/C][/ROW]
[ROW][C]42[/C][C]0.008518[/C][C]0.0929[/C][C]0.463063[/C][/ROW]
[ROW][C]43[/C][C]0.054365[/C][C]0.5931[/C][C]0.277136[/C][/ROW]
[ROW][C]44[/C][C]-0.020592[/C][C]-0.2246[/C][C]0.411326[/C][/ROW]
[ROW][C]45[/C][C]-0.007086[/C][C]-0.0773[/C][C]0.469259[/C][/ROW]
[ROW][C]46[/C][C]-0.094486[/C][C]-1.0307[/C][C]0.15238[/C][/ROW]
[ROW][C]47[/C][C]-0.028405[/C][C]-0.3099[/C][C]0.378602[/C][/ROW]
[ROW][C]48[/C][C]0.01044[/C][C]0.1139[/C][C]0.454758[/C][/ROW]
[ROW][C]49[/C][C]0.00122[/C][C]0.0133[/C][C]0.494704[/C][/ROW]
[ROW][C]50[/C][C]-0.151435[/C][C]-1.652[/C][C]0.05059[/C][/ROW]
[ROW][C]51[/C][C]-0.08769[/C][C]-0.9566[/C][C]0.170359[/C][/ROW]
[ROW][C]52[/C][C]-0.009225[/C][C]-0.1006[/C][C]0.460007[/C][/ROW]
[ROW][C]53[/C][C]0.05075[/C][C]0.5536[/C][C]0.29044[/C][/ROW]
[ROW][C]54[/C][C]-0.059433[/C][C]-0.6483[/C][C]0.259007[/C][/ROW]
[ROW][C]55[/C][C]-0.057068[/C][C]-0.6225[/C][C]0.267391[/C][/ROW]
[ROW][C]56[/C][C]0.061709[/C][C]0.6732[/C][C]0.251072[/C][/ROW]
[ROW][C]57[/C][C]0.029692[/C][C]0.3239[/C][C]0.37329[/C][/ROW]
[ROW][C]58[/C][C]-0.049015[/C][C]-0.5347[/C][C]0.296929[/C][/ROW]
[ROW][C]59[/C][C]-0.076626[/C][C]-0.8359[/C][C]0.202445[/C][/ROW]
[ROW][C]60[/C][C]-0.096869[/C][C]-1.0567[/C][C]0.146391[/C][/ROW]
[/TABLE]
Source: https://freestatistics.org/blog/index.php?pk=296469&T=2

Globally Unique Identifier (entire table): ba.freestatistics.org/blog/index.php?pk=296469&T=2

As an alternative you can also use a QR Code:  

The GUIDs for individual cells are displayed in the table below:

Partial Autocorrelation Function
Time lag kPACF(k)T-STATP-value
1-0.047312-0.51610.303366
2-0.346751-3.78260.000122
3-0.043995-0.47990.316078
4-0.350374-3.82210.000106
5-0.108632-1.1850.119181
60.0421420.45970.323279
70.0138090.15060.44026
8-0.197638-2.1560.016549
9-0.036438-0.39750.345858
10-0.564524-6.15820
11-0.401237-4.3771.3e-05
120.6755957.36990
13-0.008378-0.09140.463669
140.0670730.73170.232902
15-0.144503-1.57630.058801
16-0.06006-0.65520.256809
170.0615150.6710.251746
18-0.052401-0.57160.284325
19-0.02331-0.25430.399858
200.0343630.37490.354217
21-0.009671-0.10550.458078
220.1361391.48510.070081
230.0209010.2280.410018
24-0.047781-0.52120.301588
25-0.08545-0.93210.176575
26-0.072003-0.78550.216872
270.0326030.35570.361364
28000.499999
29-0.042628-0.4650.321385
30-0.100288-1.0940.138079
31-0.002888-0.03150.487458
32-0.042164-0.460.323195
33-0.027173-0.29640.383712
340.0623630.68030.248817
35-0.025916-0.28270.388944
36-0.144823-1.57980.0584
37-0.006756-0.07370.470689
38-0.003992-0.04350.48267
390.0912590.99550.160752
400.0223050.24330.404087
41-0.040807-0.44520.328509
420.0085180.09290.463063
430.0543650.59310.277136
44-0.020592-0.22460.411326
45-0.007086-0.07730.469259
46-0.094486-1.03070.15238
47-0.028405-0.30990.378602
480.010440.11390.454758
490.001220.01330.494704
50-0.151435-1.6520.05059
51-0.08769-0.95660.170359
52-0.009225-0.10060.460007
530.050750.55360.29044
54-0.059433-0.64830.259007
55-0.057068-0.62250.267391
560.0617090.67320.251072
570.0296920.32390.37329
58-0.049015-0.53470.296929
59-0.076626-0.83590.202445
60-0.096869-1.05670.146391


Parameters (Session):
par1 = 60 ; par2 = 1 ; par3 = 0 ; par4 = 0 ; par5 = 12 ; par6 = White Noise ; par7 = 0.95 ;
Parameters (R input):
par1 = 60 ; par2 = 1 ; par3 = 1 ; par4 = 0 ; par5 = 12 ; par6 = White Noise ; par7 = 0.95 ; par8 = ;
R code (references can be found in the software module):
par8 <- ''
par7 <- '0.95'
par6 <- 'White Noise'
par5 <- '12'
par4 <- '0'
par3 <- '0'
par2 <- '1'
par1 <- '48'
if (par1 == 'Default') {
par1 = 10*log10(length(x))
} else {
par1 <- as.numeric(par1)
}
par2 <- as.numeric(par2)
par3 <- as.numeric(par3)
par4 <- as.numeric(par4)
par5 <- as.numeric(par5)
if (par6 == 'White Noise') par6 <- 'white' else par6 <- 'ma'
par7 <- as.numeric(par7)
if (par8 != '') par8 <- as.numeric(par8)
x <- na.omit(x)
ox <- x
if (par8 == '') {
if (par2 == 0) {
x <- log(x)
} else {
x <- (x ^ par2 - 1) / par2
}
} else {
x <- log(x,base=par8)
}
if (par3 > 0) x <- diff(x,lag=1,difference=par3)
if (par4 > 0) x <- diff(x,lag=par5,difference=par4)
bitmap(file='picts.png')
op <- par(mfrow=c(2,1))
plot(ox,type='l',main='Original Time Series',xlab='time',ylab='value')
if (par8=='') {
mytitle <- paste('Working Time Series (lambda=',par2,', d=',par3,', D=',par4,')',sep='')
mysub <- paste('(lambda=',par2,', d=',par3,', D=',par4,', CI=', par7, ', CI type=',par6,')',sep='')
} else {
mytitle <- paste('Working Time Series (base=',par8,', d=',par3,', D=',par4,')',sep='')
mysub <- paste('(base=',par8,', d=',par3,', D=',par4,', CI=', par7, ', CI type=',par6,')',sep='')
}
plot(x,type='l', main=mytitle,xlab='time',ylab='value')
par(op)
dev.off()
bitmap(file='pic1.png')
racf <- acf(x, par1, main='Autocorrelation', xlab='time lag', ylab='ACF', ci.type=par6, ci=par7, sub=mysub)
dev.off()
bitmap(file='pic2.png')
rpacf <- pacf(x,par1,main='Partial Autocorrelation',xlab='lags',ylab='PACF',sub=mysub)
dev.off()
(myacf <- c(racf$acf))
(mypacf <- c(rpacf$acf))
lengthx <- length(x)
sqrtn <- sqrt(lengthx)
load(file='createtable')
a<-table.start()
a<-table.row.start(a)
a<-table.element(a,'Autocorrelation Function',4,TRUE)
a<-table.row.end(a)
a<-table.row.start(a)
a<-table.element(a,'Time lag k',header=TRUE)
a<-table.element(a,hyperlink('basics.htm','ACF(k)','click here for more information about the Autocorrelation Function'),header=TRUE)
a<-table.element(a,'T-STAT',header=TRUE)
a<-table.element(a,'P-value',header=TRUE)
a<-table.row.end(a)
for (i in 2:(par1+1)) {
a<-table.row.start(a)
a<-table.element(a,i-1,header=TRUE)
a<-table.element(a,round(myacf[i],6))
mytstat <- myacf[i]*sqrtn
a<-table.element(a,round(mytstat,4))
a<-table.element(a,round(1-pt(abs(mytstat),lengthx),6))
a<-table.row.end(a)
}
a<-table.end(a)
table.save(a,file='mytable.tab')
a<-table.start()
a<-table.row.start(a)
a<-table.element(a,'Partial Autocorrelation Function',4,TRUE)
a<-table.row.end(a)
a<-table.row.start(a)
a<-table.element(a,'Time lag k',header=TRUE)
a<-table.element(a,hyperlink('basics.htm','PACF(k)','click here for more information about the Partial Autocorrelation Function'),header=TRUE)
a<-table.element(a,'T-STAT',header=TRUE)
a<-table.element(a,'P-value',header=TRUE)
a<-table.row.end(a)
for (i in 1:par1) {
a<-table.row.start(a)
a<-table.element(a,i,header=TRUE)
a<-table.element(a,round(mypacf[i],6))
mytstat <- mypacf[i]*sqrtn
a<-table.element(a,round(mytstat,4))
a<-table.element(a,round(1-pt(abs(mytstat),lengthx),6))
a<-table.row.end(a)
}
a<-table.end(a)
table.save(a,file='mytable1.tab')