Free Statistics

of Irreproducible Research!

Author's title

Author*Unverified author*
R Software Modulerwasp_autocorrelation.wasp
Title produced by software(Partial) Autocorrelation Function
Date of computationSat, 13 Aug 2016 12:51:18 +0100
Cite this page as followsStatistical Computations at FreeStatistics.org, Office for Research Development and Education, URL https://freestatistics.org/blog/index.php?v=date/2016/Aug/13/t1471089152mspy5571h1o535s.htm/, Retrieved Wed, 01 May 2024 20:19:37 +0000
Statistical Computations at FreeStatistics.org, Office for Research Development and Education, URL https://freestatistics.org/blog/index.php?pk=296510, Retrieved Wed, 01 May 2024 20:19:37 +0000
QR Codes:

Original text written by user:
IsPrivate?No (this computation is public)
User-defined keywords
Estimated Impact175
Family? (F = Feedback message, R = changed R code, M = changed R Module, P = changed Parameters, D = changed Data)
-     [Univariate Data Series] [] [2016-08-13 09:35:09] [74be16979710d4c4e7c6647856088456]
- RMP     [(Partial) Autocorrelation Function] [] [2016-08-13 11:51:18] [d41d8cd98f00b204e9800998ecf8427e] [Current]
Feedback Forum

Post a new message
Dataseries X:
29312
29336
29357
29380
29402
29426
29448
29471
29495
29517
29540
29563
29586
29609
29631
29654
29677
29700
29723
29746
29769
29792
29815
29837
29861
29884
29905
29928
29951
29974
29996
30020
30043
30065
30089
30111
30134
30158
30179
30202
30224
30248
30270
30293
30317
30339
30362
30385
30408
30431
30452
30476
30498
30521
30544
30567
30590
30613
30636
30659
30682
30705
30727
30750
30773
30796
30818
30842
30865
30887
30911
30933
30956
30980
31001
31024
31046
31070
31092
31115
31139
31161
31184
31207
31230
31253
31274
31298
31320
31343
31366
31389
31412
31435
31458
31481
31504
31527
31548
31571
31594
31617
31640
31663
31686
31709
31732
31754


Summary of computational transaction
Raw Inputview raw input (R code)
Raw Outputview raw output of R engine
Computing time1 seconds
R Server'Gwilym Jenkins' @ jenkins.wessa.net

\begin{tabular}{lllllllll}
\hline
Summary of computational transaction \tabularnewline
Raw Input & view raw input (R code)  \tabularnewline
Raw Output & view raw output of R engine  \tabularnewline
Computing time & 1 seconds \tabularnewline
R Server & 'Gwilym Jenkins' @ jenkins.wessa.net \tabularnewline
\hline
\end{tabular}
%Source: https://freestatistics.org/blog/index.php?pk=296510&T=0

[TABLE]
[ROW][C]Summary of computational transaction[/C][/ROW]
[ROW][C]Raw Input[/C][C]view raw input (R code) [/C][/ROW]
[ROW][C]Raw Output[/C][C]view raw output of R engine [/C][/ROW]
[ROW][C]Computing time[/C][C]1 seconds[/C][/ROW]
[ROW][C]R Server[/C][C]'Gwilym Jenkins' @ jenkins.wessa.net[/C][/ROW]
[/TABLE]
Source: https://freestatistics.org/blog/index.php?pk=296510&T=0

Globally Unique Identifier (entire table): ba.freestatistics.org/blog/index.php?pk=296510&T=0

As an alternative you can also use a QR Code:  

The GUIDs for individual cells are displayed in the table below:

Summary of computational transaction
Raw Inputview raw input (R code)
Raw Outputview raw output of R engine
Computing time1 seconds
R Server'Gwilym Jenkins' @ jenkins.wessa.net


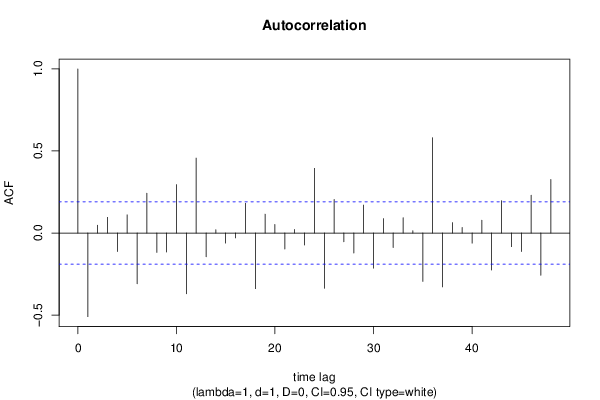
Autocorrelation Function
Time lag kACF(k)T-STATP-value
1-0.509611-5.27150
20.0473540.48980.312627
30.0955230.98810.162667
4-0.113057-1.16950.122407
50.1107271.14540.127307
6-0.308802-3.19430.000921
70.24242.50740.006832
8-0.117985-1.22040.11249
9-0.115615-1.19590.117184
100.2953083.05470.001422
11-0.370505-3.83250.000107
120.4565544.72264e-06
13-0.144352-1.49320.069165
140.0202860.20980.417095
15-0.06136-0.63470.263485
16-0.029418-0.30430.380745
170.181021.87250.031935
18-0.338752-3.50410.000335
190.1150891.19050.118244
200.0525510.54360.293925
21-0.096884-1.00220.159261
220.0219560.22710.410385
23-0.073036-0.75550.225808
240.394154.07714.4e-05
25-0.33657-3.48150.000362
260.2041672.11190.01851
27-0.053093-0.54920.292008
28-0.121393-1.25570.10598
290.1701791.76030.040604
30-0.214015-2.21380.014483
310.0880210.91050.182303
32-0.088105-0.91140.182077
330.0927610.95950.169729
340.0139960.14480.44258
35-0.294826-3.04970.001444
360.5809136.0090
37-0.328303-3.3960.00048
380.0635110.6570.256306
390.0334270.34580.365095
40-0.061564-0.63680.2628
410.0782030.80890.210172
42-0.224856-2.32590.010954
430.1965312.03290.022268
44-0.082719-0.85570.197051
45-0.112803-1.16680.122934
460.2303312.38260.009478
47-0.256987-2.65830.004529
480.3266693.37910.000508

\begin{tabular}{lllllllll}
\hline
Autocorrelation Function \tabularnewline
Time lag k & ACF(k) & T-STAT & P-value \tabularnewline
1 & -0.509611 & -5.2715 & 0 \tabularnewline
2 & 0.047354 & 0.4898 & 0.312627 \tabularnewline
3 & 0.095523 & 0.9881 & 0.162667 \tabularnewline
4 & -0.113057 & -1.1695 & 0.122407 \tabularnewline
5 & 0.110727 & 1.1454 & 0.127307 \tabularnewline
6 & -0.308802 & -3.1943 & 0.000921 \tabularnewline
7 & 0.2424 & 2.5074 & 0.006832 \tabularnewline
8 & -0.117985 & -1.2204 & 0.11249 \tabularnewline
9 & -0.115615 & -1.1959 & 0.117184 \tabularnewline
10 & 0.295308 & 3.0547 & 0.001422 \tabularnewline
11 & -0.370505 & -3.8325 & 0.000107 \tabularnewline
12 & 0.456554 & 4.7226 & 4e-06 \tabularnewline
13 & -0.144352 & -1.4932 & 0.069165 \tabularnewline
14 & 0.020286 & 0.2098 & 0.417095 \tabularnewline
15 & -0.06136 & -0.6347 & 0.263485 \tabularnewline
16 & -0.029418 & -0.3043 & 0.380745 \tabularnewline
17 & 0.18102 & 1.8725 & 0.031935 \tabularnewline
18 & -0.338752 & -3.5041 & 0.000335 \tabularnewline
19 & 0.115089 & 1.1905 & 0.118244 \tabularnewline
20 & 0.052551 & 0.5436 & 0.293925 \tabularnewline
21 & -0.096884 & -1.0022 & 0.159261 \tabularnewline
22 & 0.021956 & 0.2271 & 0.410385 \tabularnewline
23 & -0.073036 & -0.7555 & 0.225808 \tabularnewline
24 & 0.39415 & 4.0771 & 4.4e-05 \tabularnewline
25 & -0.33657 & -3.4815 & 0.000362 \tabularnewline
26 & 0.204167 & 2.1119 & 0.01851 \tabularnewline
27 & -0.053093 & -0.5492 & 0.292008 \tabularnewline
28 & -0.121393 & -1.2557 & 0.10598 \tabularnewline
29 & 0.170179 & 1.7603 & 0.040604 \tabularnewline
30 & -0.214015 & -2.2138 & 0.014483 \tabularnewline
31 & 0.088021 & 0.9105 & 0.182303 \tabularnewline
32 & -0.088105 & -0.9114 & 0.182077 \tabularnewline
33 & 0.092761 & 0.9595 & 0.169729 \tabularnewline
34 & 0.013996 & 0.1448 & 0.44258 \tabularnewline
35 & -0.294826 & -3.0497 & 0.001444 \tabularnewline
36 & 0.580913 & 6.009 & 0 \tabularnewline
37 & -0.328303 & -3.396 & 0.00048 \tabularnewline
38 & 0.063511 & 0.657 & 0.256306 \tabularnewline
39 & 0.033427 & 0.3458 & 0.365095 \tabularnewline
40 & -0.061564 & -0.6368 & 0.2628 \tabularnewline
41 & 0.078203 & 0.8089 & 0.210172 \tabularnewline
42 & -0.224856 & -2.3259 & 0.010954 \tabularnewline
43 & 0.196531 & 2.0329 & 0.022268 \tabularnewline
44 & -0.082719 & -0.8557 & 0.197051 \tabularnewline
45 & -0.112803 & -1.1668 & 0.122934 \tabularnewline
46 & 0.230331 & 2.3826 & 0.009478 \tabularnewline
47 & -0.256987 & -2.6583 & 0.004529 \tabularnewline
48 & 0.326669 & 3.3791 & 0.000508 \tabularnewline
\hline
\end{tabular}
%Source: https://freestatistics.org/blog/index.php?pk=296510&T=1

[TABLE]
[ROW][C]Autocorrelation Function[/C][/ROW]
[ROW][C]Time lag k[/C][C]ACF(k)[/C][C]T-STAT[/C][C]P-value[/C][/ROW]
[ROW][C]1[/C][C]-0.509611[/C][C]-5.2715[/C][C]0[/C][/ROW]
[ROW][C]2[/C][C]0.047354[/C][C]0.4898[/C][C]0.312627[/C][/ROW]
[ROW][C]3[/C][C]0.095523[/C][C]0.9881[/C][C]0.162667[/C][/ROW]
[ROW][C]4[/C][C]-0.113057[/C][C]-1.1695[/C][C]0.122407[/C][/ROW]
[ROW][C]5[/C][C]0.110727[/C][C]1.1454[/C][C]0.127307[/C][/ROW]
[ROW][C]6[/C][C]-0.308802[/C][C]-3.1943[/C][C]0.000921[/C][/ROW]
[ROW][C]7[/C][C]0.2424[/C][C]2.5074[/C][C]0.006832[/C][/ROW]
[ROW][C]8[/C][C]-0.117985[/C][C]-1.2204[/C][C]0.11249[/C][/ROW]
[ROW][C]9[/C][C]-0.115615[/C][C]-1.1959[/C][C]0.117184[/C][/ROW]
[ROW][C]10[/C][C]0.295308[/C][C]3.0547[/C][C]0.001422[/C][/ROW]
[ROW][C]11[/C][C]-0.370505[/C][C]-3.8325[/C][C]0.000107[/C][/ROW]
[ROW][C]12[/C][C]0.456554[/C][C]4.7226[/C][C]4e-06[/C][/ROW]
[ROW][C]13[/C][C]-0.144352[/C][C]-1.4932[/C][C]0.069165[/C][/ROW]
[ROW][C]14[/C][C]0.020286[/C][C]0.2098[/C][C]0.417095[/C][/ROW]
[ROW][C]15[/C][C]-0.06136[/C][C]-0.6347[/C][C]0.263485[/C][/ROW]
[ROW][C]16[/C][C]-0.029418[/C][C]-0.3043[/C][C]0.380745[/C][/ROW]
[ROW][C]17[/C][C]0.18102[/C][C]1.8725[/C][C]0.031935[/C][/ROW]
[ROW][C]18[/C][C]-0.338752[/C][C]-3.5041[/C][C]0.000335[/C][/ROW]
[ROW][C]19[/C][C]0.115089[/C][C]1.1905[/C][C]0.118244[/C][/ROW]
[ROW][C]20[/C][C]0.052551[/C][C]0.5436[/C][C]0.293925[/C][/ROW]
[ROW][C]21[/C][C]-0.096884[/C][C]-1.0022[/C][C]0.159261[/C][/ROW]
[ROW][C]22[/C][C]0.021956[/C][C]0.2271[/C][C]0.410385[/C][/ROW]
[ROW][C]23[/C][C]-0.073036[/C][C]-0.7555[/C][C]0.225808[/C][/ROW]
[ROW][C]24[/C][C]0.39415[/C][C]4.0771[/C][C]4.4e-05[/C][/ROW]
[ROW][C]25[/C][C]-0.33657[/C][C]-3.4815[/C][C]0.000362[/C][/ROW]
[ROW][C]26[/C][C]0.204167[/C][C]2.1119[/C][C]0.01851[/C][/ROW]
[ROW][C]27[/C][C]-0.053093[/C][C]-0.5492[/C][C]0.292008[/C][/ROW]
[ROW][C]28[/C][C]-0.121393[/C][C]-1.2557[/C][C]0.10598[/C][/ROW]
[ROW][C]29[/C][C]0.170179[/C][C]1.7603[/C][C]0.040604[/C][/ROW]
[ROW][C]30[/C][C]-0.214015[/C][C]-2.2138[/C][C]0.014483[/C][/ROW]
[ROW][C]31[/C][C]0.088021[/C][C]0.9105[/C][C]0.182303[/C][/ROW]
[ROW][C]32[/C][C]-0.088105[/C][C]-0.9114[/C][C]0.182077[/C][/ROW]
[ROW][C]33[/C][C]0.092761[/C][C]0.9595[/C][C]0.169729[/C][/ROW]
[ROW][C]34[/C][C]0.013996[/C][C]0.1448[/C][C]0.44258[/C][/ROW]
[ROW][C]35[/C][C]-0.294826[/C][C]-3.0497[/C][C]0.001444[/C][/ROW]
[ROW][C]36[/C][C]0.580913[/C][C]6.009[/C][C]0[/C][/ROW]
[ROW][C]37[/C][C]-0.328303[/C][C]-3.396[/C][C]0.00048[/C][/ROW]
[ROW][C]38[/C][C]0.063511[/C][C]0.657[/C][C]0.256306[/C][/ROW]
[ROW][C]39[/C][C]0.033427[/C][C]0.3458[/C][C]0.365095[/C][/ROW]
[ROW][C]40[/C][C]-0.061564[/C][C]-0.6368[/C][C]0.2628[/C][/ROW]
[ROW][C]41[/C][C]0.078203[/C][C]0.8089[/C][C]0.210172[/C][/ROW]
[ROW][C]42[/C][C]-0.224856[/C][C]-2.3259[/C][C]0.010954[/C][/ROW]
[ROW][C]43[/C][C]0.196531[/C][C]2.0329[/C][C]0.022268[/C][/ROW]
[ROW][C]44[/C][C]-0.082719[/C][C]-0.8557[/C][C]0.197051[/C][/ROW]
[ROW][C]45[/C][C]-0.112803[/C][C]-1.1668[/C][C]0.122934[/C][/ROW]
[ROW][C]46[/C][C]0.230331[/C][C]2.3826[/C][C]0.009478[/C][/ROW]
[ROW][C]47[/C][C]-0.256987[/C][C]-2.6583[/C][C]0.004529[/C][/ROW]
[ROW][C]48[/C][C]0.326669[/C][C]3.3791[/C][C]0.000508[/C][/ROW]
[/TABLE]
Source: https://freestatistics.org/blog/index.php?pk=296510&T=1

Globally Unique Identifier (entire table): ba.freestatistics.org/blog/index.php?pk=296510&T=1

As an alternative you can also use a QR Code:  

The GUIDs for individual cells are displayed in the table below:

Autocorrelation Function
Time lag kACF(k)T-STATP-value
1-0.509611-5.27150
20.0473540.48980.312627
30.0955230.98810.162667
4-0.113057-1.16950.122407
50.1107271.14540.127307
6-0.308802-3.19430.000921
70.24242.50740.006832
8-0.117985-1.22040.11249
9-0.115615-1.19590.117184
100.2953083.05470.001422
11-0.370505-3.83250.000107
120.4565544.72264e-06
13-0.144352-1.49320.069165
140.0202860.20980.417095
15-0.06136-0.63470.263485
16-0.029418-0.30430.380745
170.181021.87250.031935
18-0.338752-3.50410.000335
190.1150891.19050.118244
200.0525510.54360.293925
21-0.096884-1.00220.159261
220.0219560.22710.410385
23-0.073036-0.75550.225808
240.394154.07714.4e-05
25-0.33657-3.48150.000362
260.2041672.11190.01851
27-0.053093-0.54920.292008
28-0.121393-1.25570.10598
290.1701791.76030.040604
30-0.214015-2.21380.014483
310.0880210.91050.182303
32-0.088105-0.91140.182077
330.0927610.95950.169729
340.0139960.14480.44258
35-0.294826-3.04970.001444
360.5809136.0090
37-0.328303-3.3960.00048
380.0635110.6570.256306
390.0334270.34580.365095
40-0.061564-0.63680.2628
410.0782030.80890.210172
42-0.224856-2.32590.010954
430.1965312.03290.022268
44-0.082719-0.85570.197051
45-0.112803-1.16680.122934
460.2303312.38260.009478
47-0.256987-2.65830.004529
480.3266693.37910.000508


Partial Autocorrelation Function
Time lag kPACF(k)T-STATP-value
1-0.509611-5.27150
2-0.286843-2.96710.001854
3-0.028851-0.29840.382973
4-0.073432-0.75960.224587
50.0489010.50580.307006
6-0.3554-3.67630.000186
7-0.146331-1.51370.06653
8-0.17374-1.79720.037564
9-0.308668-3.19290.000925
100.0081570.08440.466455
11-0.38979-4.0325.2e-05
120.0895830.92670.178097
130.1736681.79640.037623
140.2419412.50270.006919
15-0.103681-1.07250.142959
16-0.034639-0.35830.36041
170.0782890.80980.209919
180.0481160.49770.309854
19-0.081528-0.84330.200461
20-0.12282-1.27050.103338
210.0476610.4930.311509
22-0.253629-2.62360.004986
23-0.245028-2.53460.006353
240.1101581.13950.128523
25-0.121316-1.25490.106124
260.077990.80670.210806
27-0.023728-0.24540.403293
28-0.092973-0.96170.16918
290.0007530.00780.496899
300.0295470.30560.380237
310.0028140.02910.488417
320.0053570.05540.477954
330.0685550.70910.23989
340.0118320.12240.451408
35-0.261405-2.7040.003986
36-0.018064-0.18690.426066
37-0.052149-0.53940.295355
38-0.006889-0.07130.471662
39-0.021058-0.21780.413989
40-0.047911-0.49560.310598
41-0.153755-1.59050.057342
42-0.01507-0.15590.438209
43-0.021927-0.22680.410501
440.056660.58610.279522
45-0.0254-0.26270.396628
460.0153750.1590.436967
470.0232020.240.405395
480.0395490.40910.341641

\begin{tabular}{lllllllll}
\hline
Partial Autocorrelation Function \tabularnewline
Time lag k & PACF(k) & T-STAT & P-value \tabularnewline
1 & -0.509611 & -5.2715 & 0 \tabularnewline
2 & -0.286843 & -2.9671 & 0.001854 \tabularnewline
3 & -0.028851 & -0.2984 & 0.382973 \tabularnewline
4 & -0.073432 & -0.7596 & 0.224587 \tabularnewline
5 & 0.048901 & 0.5058 & 0.307006 \tabularnewline
6 & -0.3554 & -3.6763 & 0.000186 \tabularnewline
7 & -0.146331 & -1.5137 & 0.06653 \tabularnewline
8 & -0.17374 & -1.7972 & 0.037564 \tabularnewline
9 & -0.308668 & -3.1929 & 0.000925 \tabularnewline
10 & 0.008157 & 0.0844 & 0.466455 \tabularnewline
11 & -0.38979 & -4.032 & 5.2e-05 \tabularnewline
12 & 0.089583 & 0.9267 & 0.178097 \tabularnewline
13 & 0.173668 & 1.7964 & 0.037623 \tabularnewline
14 & 0.241941 & 2.5027 & 0.006919 \tabularnewline
15 & -0.103681 & -1.0725 & 0.142959 \tabularnewline
16 & -0.034639 & -0.3583 & 0.36041 \tabularnewline
17 & 0.078289 & 0.8098 & 0.209919 \tabularnewline
18 & 0.048116 & 0.4977 & 0.309854 \tabularnewline
19 & -0.081528 & -0.8433 & 0.200461 \tabularnewline
20 & -0.12282 & -1.2705 & 0.103338 \tabularnewline
21 & 0.047661 & 0.493 & 0.311509 \tabularnewline
22 & -0.253629 & -2.6236 & 0.004986 \tabularnewline
23 & -0.245028 & -2.5346 & 0.006353 \tabularnewline
24 & 0.110158 & 1.1395 & 0.128523 \tabularnewline
25 & -0.121316 & -1.2549 & 0.106124 \tabularnewline
26 & 0.07799 & 0.8067 & 0.210806 \tabularnewline
27 & -0.023728 & -0.2454 & 0.403293 \tabularnewline
28 & -0.092973 & -0.9617 & 0.16918 \tabularnewline
29 & 0.000753 & 0.0078 & 0.496899 \tabularnewline
30 & 0.029547 & 0.3056 & 0.380237 \tabularnewline
31 & 0.002814 & 0.0291 & 0.488417 \tabularnewline
32 & 0.005357 & 0.0554 & 0.477954 \tabularnewline
33 & 0.068555 & 0.7091 & 0.23989 \tabularnewline
34 & 0.011832 & 0.1224 & 0.451408 \tabularnewline
35 & -0.261405 & -2.704 & 0.003986 \tabularnewline
36 & -0.018064 & -0.1869 & 0.426066 \tabularnewline
37 & -0.052149 & -0.5394 & 0.295355 \tabularnewline
38 & -0.006889 & -0.0713 & 0.471662 \tabularnewline
39 & -0.021058 & -0.2178 & 0.413989 \tabularnewline
40 & -0.047911 & -0.4956 & 0.310598 \tabularnewline
41 & -0.153755 & -1.5905 & 0.057342 \tabularnewline
42 & -0.01507 & -0.1559 & 0.438209 \tabularnewline
43 & -0.021927 & -0.2268 & 0.410501 \tabularnewline
44 & 0.05666 & 0.5861 & 0.279522 \tabularnewline
45 & -0.0254 & -0.2627 & 0.396628 \tabularnewline
46 & 0.015375 & 0.159 & 0.436967 \tabularnewline
47 & 0.023202 & 0.24 & 0.405395 \tabularnewline
48 & 0.039549 & 0.4091 & 0.341641 \tabularnewline
\hline
\end{tabular}
%Source: https://freestatistics.org/blog/index.php?pk=296510&T=2

[TABLE]
[ROW][C]Partial Autocorrelation Function[/C][/ROW]
[ROW][C]Time lag k[/C][C]PACF(k)[/C][C]T-STAT[/C][C]P-value[/C][/ROW]
[ROW][C]1[/C][C]-0.509611[/C][C]-5.2715[/C][C]0[/C][/ROW]
[ROW][C]2[/C][C]-0.286843[/C][C]-2.9671[/C][C]0.001854[/C][/ROW]
[ROW][C]3[/C][C]-0.028851[/C][C]-0.2984[/C][C]0.382973[/C][/ROW]
[ROW][C]4[/C][C]-0.073432[/C][C]-0.7596[/C][C]0.224587[/C][/ROW]
[ROW][C]5[/C][C]0.048901[/C][C]0.5058[/C][C]0.307006[/C][/ROW]
[ROW][C]6[/C][C]-0.3554[/C][C]-3.6763[/C][C]0.000186[/C][/ROW]
[ROW][C]7[/C][C]-0.146331[/C][C]-1.5137[/C][C]0.06653[/C][/ROW]
[ROW][C]8[/C][C]-0.17374[/C][C]-1.7972[/C][C]0.037564[/C][/ROW]
[ROW][C]9[/C][C]-0.308668[/C][C]-3.1929[/C][C]0.000925[/C][/ROW]
[ROW][C]10[/C][C]0.008157[/C][C]0.0844[/C][C]0.466455[/C][/ROW]
[ROW][C]11[/C][C]-0.38979[/C][C]-4.032[/C][C]5.2e-05[/C][/ROW]
[ROW][C]12[/C][C]0.089583[/C][C]0.9267[/C][C]0.178097[/C][/ROW]
[ROW][C]13[/C][C]0.173668[/C][C]1.7964[/C][C]0.037623[/C][/ROW]
[ROW][C]14[/C][C]0.241941[/C][C]2.5027[/C][C]0.006919[/C][/ROW]
[ROW][C]15[/C][C]-0.103681[/C][C]-1.0725[/C][C]0.142959[/C][/ROW]
[ROW][C]16[/C][C]-0.034639[/C][C]-0.3583[/C][C]0.36041[/C][/ROW]
[ROW][C]17[/C][C]0.078289[/C][C]0.8098[/C][C]0.209919[/C][/ROW]
[ROW][C]18[/C][C]0.048116[/C][C]0.4977[/C][C]0.309854[/C][/ROW]
[ROW][C]19[/C][C]-0.081528[/C][C]-0.8433[/C][C]0.200461[/C][/ROW]
[ROW][C]20[/C][C]-0.12282[/C][C]-1.2705[/C][C]0.103338[/C][/ROW]
[ROW][C]21[/C][C]0.047661[/C][C]0.493[/C][C]0.311509[/C][/ROW]
[ROW][C]22[/C][C]-0.253629[/C][C]-2.6236[/C][C]0.004986[/C][/ROW]
[ROW][C]23[/C][C]-0.245028[/C][C]-2.5346[/C][C]0.006353[/C][/ROW]
[ROW][C]24[/C][C]0.110158[/C][C]1.1395[/C][C]0.128523[/C][/ROW]
[ROW][C]25[/C][C]-0.121316[/C][C]-1.2549[/C][C]0.106124[/C][/ROW]
[ROW][C]26[/C][C]0.07799[/C][C]0.8067[/C][C]0.210806[/C][/ROW]
[ROW][C]27[/C][C]-0.023728[/C][C]-0.2454[/C][C]0.403293[/C][/ROW]
[ROW][C]28[/C][C]-0.092973[/C][C]-0.9617[/C][C]0.16918[/C][/ROW]
[ROW][C]29[/C][C]0.000753[/C][C]0.0078[/C][C]0.496899[/C][/ROW]
[ROW][C]30[/C][C]0.029547[/C][C]0.3056[/C][C]0.380237[/C][/ROW]
[ROW][C]31[/C][C]0.002814[/C][C]0.0291[/C][C]0.488417[/C][/ROW]
[ROW][C]32[/C][C]0.005357[/C][C]0.0554[/C][C]0.477954[/C][/ROW]
[ROW][C]33[/C][C]0.068555[/C][C]0.7091[/C][C]0.23989[/C][/ROW]
[ROW][C]34[/C][C]0.011832[/C][C]0.1224[/C][C]0.451408[/C][/ROW]
[ROW][C]35[/C][C]-0.261405[/C][C]-2.704[/C][C]0.003986[/C][/ROW]
[ROW][C]36[/C][C]-0.018064[/C][C]-0.1869[/C][C]0.426066[/C][/ROW]
[ROW][C]37[/C][C]-0.052149[/C][C]-0.5394[/C][C]0.295355[/C][/ROW]
[ROW][C]38[/C][C]-0.006889[/C][C]-0.0713[/C][C]0.471662[/C][/ROW]
[ROW][C]39[/C][C]-0.021058[/C][C]-0.2178[/C][C]0.413989[/C][/ROW]
[ROW][C]40[/C][C]-0.047911[/C][C]-0.4956[/C][C]0.310598[/C][/ROW]
[ROW][C]41[/C][C]-0.153755[/C][C]-1.5905[/C][C]0.057342[/C][/ROW]
[ROW][C]42[/C][C]-0.01507[/C][C]-0.1559[/C][C]0.438209[/C][/ROW]
[ROW][C]43[/C][C]-0.021927[/C][C]-0.2268[/C][C]0.410501[/C][/ROW]
[ROW][C]44[/C][C]0.05666[/C][C]0.5861[/C][C]0.279522[/C][/ROW]
[ROW][C]45[/C][C]-0.0254[/C][C]-0.2627[/C][C]0.396628[/C][/ROW]
[ROW][C]46[/C][C]0.015375[/C][C]0.159[/C][C]0.436967[/C][/ROW]
[ROW][C]47[/C][C]0.023202[/C][C]0.24[/C][C]0.405395[/C][/ROW]
[ROW][C]48[/C][C]0.039549[/C][C]0.4091[/C][C]0.341641[/C][/ROW]
[/TABLE]
Source: https://freestatistics.org/blog/index.php?pk=296510&T=2

Globally Unique Identifier (entire table): ba.freestatistics.org/blog/index.php?pk=296510&T=2

As an alternative you can also use a QR Code:  

The GUIDs for individual cells are displayed in the table below:

Partial Autocorrelation Function
Time lag kPACF(k)T-STATP-value
1-0.509611-5.27150
2-0.286843-2.96710.001854
3-0.028851-0.29840.382973
4-0.073432-0.75960.224587
50.0489010.50580.307006
6-0.3554-3.67630.000186
7-0.146331-1.51370.06653
8-0.17374-1.79720.037564
9-0.308668-3.19290.000925
100.0081570.08440.466455
11-0.38979-4.0325.2e-05
120.0895830.92670.178097
130.1736681.79640.037623
140.2419412.50270.006919
15-0.103681-1.07250.142959
16-0.034639-0.35830.36041
170.0782890.80980.209919
180.0481160.49770.309854
19-0.081528-0.84330.200461
20-0.12282-1.27050.103338
210.0476610.4930.311509
22-0.253629-2.62360.004986
23-0.245028-2.53460.006353
240.1101581.13950.128523
25-0.121316-1.25490.106124
260.077990.80670.210806
27-0.023728-0.24540.403293
28-0.092973-0.96170.16918
290.0007530.00780.496899
300.0295470.30560.380237
310.0028140.02910.488417
320.0053570.05540.477954
330.0685550.70910.23989
340.0118320.12240.451408
35-0.261405-2.7040.003986
36-0.018064-0.18690.426066
37-0.052149-0.53940.295355
38-0.006889-0.07130.471662
39-0.021058-0.21780.413989
40-0.047911-0.49560.310598
41-0.153755-1.59050.057342
42-0.01507-0.15590.438209
43-0.021927-0.22680.410501
440.056660.58610.279522
45-0.0254-0.26270.396628
460.0153750.1590.436967
470.0232020.240.405395
480.0395490.40910.341641


Parameters (Session):
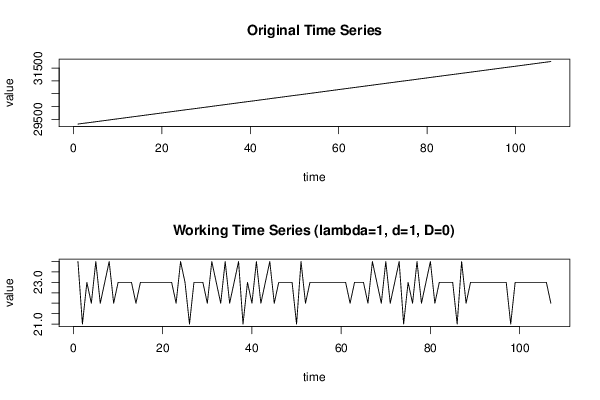
par1 = 48 ; par2 = 1 ; par3 = 1 ; par4 = 0 ; par5 = 12 ; par6 = White Noise ; par7 = 0.95 ;
Parameters (R input):
par1 = 48 ; par2 = 1 ; par3 = 1 ; par4 = 0 ; par5 = 12 ; par6 = White Noise ; par7 = 0.95 ; par8 = ;
R code (references can be found in the software module):
par8 <- ''
par7 <- '0.95'
par6 <- 'White Noise'
par5 <- '12'
par4 <- '0'
par3 <- '0'
par2 <- '1'
par1 <- '48'
if (par1 == 'Default') {
par1 = 10*log10(length(x))
} else {
par1 <- as.numeric(par1)
}
par2 <- as.numeric(par2)
par3 <- as.numeric(par3)
par4 <- as.numeric(par4)
par5 <- as.numeric(par5)
if (par6 == 'White Noise') par6 <- 'white' else par6 <- 'ma'
par7 <- as.numeric(par7)
if (par8 != '') par8 <- as.numeric(par8)
x <- na.omit(x)
ox <- x
if (par8 == '') {
if (par2 == 0) {
x <- log(x)
} else {
x <- (x ^ par2 - 1) / par2
}
} else {
x <- log(x,base=par8)
}
if (par3 > 0) x <- diff(x,lag=1,difference=par3)
if (par4 > 0) x <- diff(x,lag=par5,difference=par4)
bitmap(file='picts.png')
op <- par(mfrow=c(2,1))
plot(ox,type='l',main='Original Time Series',xlab='time',ylab='value')
if (par8=='') {
mytitle <- paste('Working Time Series (lambda=',par2,', d=',par3,', D=',par4,')',sep='')
mysub <- paste('(lambda=',par2,', d=',par3,', D=',par4,', CI=', par7, ', CI type=',par6,')',sep='')
} else {
mytitle <- paste('Working Time Series (base=',par8,', d=',par3,', D=',par4,')',sep='')
mysub <- paste('(base=',par8,', d=',par3,', D=',par4,', CI=', par7, ', CI type=',par6,')',sep='')
}
plot(x,type='l', main=mytitle,xlab='time',ylab='value')
par(op)
dev.off()
bitmap(file='pic1.png')
racf <- acf(x, par1, main='Autocorrelation', xlab='time lag', ylab='ACF', ci.type=par6, ci=par7, sub=mysub)
dev.off()
bitmap(file='pic2.png')
rpacf <- pacf(x,par1,main='Partial Autocorrelation',xlab='lags',ylab='PACF',sub=mysub)
dev.off()
(myacf <- c(racf$acf))
(mypacf <- c(rpacf$acf))
lengthx <- length(x)
sqrtn <- sqrt(lengthx)
load(file='createtable')
a<-table.start()
a<-table.row.start(a)
a<-table.element(a,'Autocorrelation Function',4,TRUE)
a<-table.row.end(a)
a<-table.row.start(a)
a<-table.element(a,'Time lag k',header=TRUE)
a<-table.element(a,hyperlink('basics.htm','ACF(k)','click here for more information about the Autocorrelation Function'),header=TRUE)
a<-table.element(a,'T-STAT',header=TRUE)
a<-table.element(a,'P-value',header=TRUE)
a<-table.row.end(a)
for (i in 2:(par1+1)) {
a<-table.row.start(a)
a<-table.element(a,i-1,header=TRUE)
a<-table.element(a,round(myacf[i],6))
mytstat <- myacf[i]*sqrtn
a<-table.element(a,round(mytstat,4))
a<-table.element(a,round(1-pt(abs(mytstat),lengthx),6))
a<-table.row.end(a)
}
a<-table.end(a)
table.save(a,file='mytable.tab')
a<-table.start()
a<-table.row.start(a)
a<-table.element(a,'Partial Autocorrelation Function',4,TRUE)
a<-table.row.end(a)
a<-table.row.start(a)
a<-table.element(a,'Time lag k',header=TRUE)
a<-table.element(a,hyperlink('basics.htm','PACF(k)','click here for more information about the Partial Autocorrelation Function'),header=TRUE)
a<-table.element(a,'T-STAT',header=TRUE)
a<-table.element(a,'P-value',header=TRUE)
a<-table.row.end(a)
for (i in 1:par1) {
a<-table.row.start(a)
a<-table.element(a,i,header=TRUE)
a<-table.element(a,round(mypacf[i],6))
mytstat <- mypacf[i]*sqrtn
a<-table.element(a,round(mytstat,4))
a<-table.element(a,round(1-pt(abs(mytstat),lengthx),6))
a<-table.row.end(a)
}
a<-table.end(a)
table.save(a,file='mytable1.tab')