Free Statistics

of Irreproducible Research!

Author's title

Author*Unverified author*
R Software Modulerwasp_sdplot.wasp
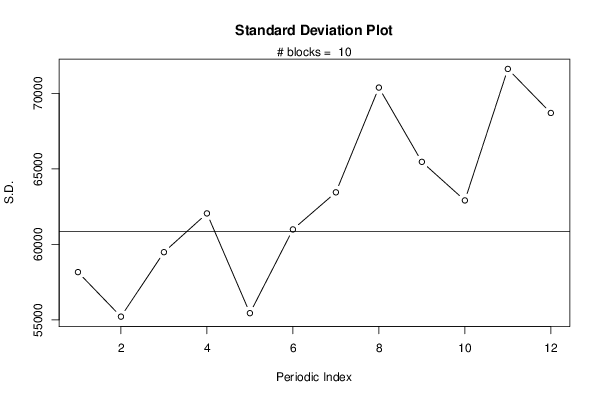
Title produced by softwareStandard Deviation Plot
Date of computationMon, 15 Aug 2016 00:07:22 +0100
Cite this page as followsStatistical Computations at FreeStatistics.org, Office for Research Development and Education, URL https://freestatistics.org/blog/index.php?v=date/2016/Aug/15/t14712160696eviawobh0k49nt.htm/, Retrieved Sun, 28 Apr 2024 07:22:40 +0200
Statistical Computations at FreeStatistics.org, Office for Research Development and Education, URL https://freestatistics.org/blog/index.php?pk=, Retrieved Sun, 28 Apr 2024 07:22:40 +0200
QR Codes:

Original text written by user:
IsPrivate?No (this computation is public)
User-defined keywords
Estimated Impact0
Dataseries X:
58109
57087
56064
54019
74712
73689
58109
47763
48785
48785
49808
51964
45718
39462
34339
34339
54019
56064
40484
22859
32183
32183
39462
43663
42640
32183
37417
35362
52987
48785
32183
19782
31160
34339
37417
41507
33205
26038
29116
30138
57087
57087
41507
39462
45718
42640
50942
61288
63343
48785
44685
40484
68567
70622
65388
70622
69589
61288
70622
80968
85169
72667
64365
70622
97570
105872
103827
107916
106894
96548
114173
118374
124519
105872
98593
106894
126675
144300
140099
140099
142154
134976
153634
153634
150455
132820
135999
138054
151579
169204
156701
162958
157724
154656
178538
173304
166025
155679
166025
171259
177505
185806
177505
182628
176381
175359
201285
203441
195140
180583
192984
198208
204464
213788
204464
211743
208564
197185
221066
221066


Summary of computational transaction
Raw Inputview raw input (R code)
Raw Outputview raw output of R engine
Computing time2 seconds
R Server'Sir Maurice George Kendall' @ kendall.wessa.net

\begin{tabular}{lllllllll}
\hline
Summary of computational transaction \tabularnewline
Raw Input & view raw input (R code)  \tabularnewline
Raw Output & view raw output of R engine  \tabularnewline
Computing time & 2 seconds \tabularnewline
R Server & 'Sir Maurice George Kendall' @ kendall.wessa.net \tabularnewline
\hline
\end{tabular}
%Source: https://freestatistics.org/blog/index.php?pk=&T=0

[TABLE]
[ROW][C]Summary of computational transaction[/C][/ROW]
[ROW][C]Raw Input[/C][C]view raw input (R code) [/C][/ROW]
[ROW][C]Raw Output[/C][C]view raw output of R engine [/C][/ROW]
[ROW][C]Computing time[/C][C]2 seconds[/C][/ROW]
[ROW][C]R Server[/C][C]'Sir Maurice George Kendall' @ kendall.wessa.net[/C][/ROW]
[/TABLE]
Source: https://freestatistics.org/blog/index.php?pk=&T=0

Globally Unique Identifier (entire table): ba.freestatistics.org/blog/index.php?pk=&T=0

As an alternative you can also use a QR Code:  

The GUIDs for individual cells are displayed in the table below:

Summary of computational transaction
Raw Inputview raw input (R code)
Raw Outputview raw output of R engine
Computing time2 seconds
R Server'Sir Maurice George Kendall' @ kendall.wessa.net


Parameters (Session):
par1 = 12 ;
Parameters (R input):
par1 = 12 ;
R code (references can be found in the software module):
par1 <- as.numeric(par1)
(n <- length(x))
(np <- floor(n / par1))
arr <- array(NA,dim=c(par1,np+1))
ari <- array(0,dim=par1)
j <- 0
for (i in 1:n)
{
j = j + 1
ari[j] = ari[j] + 1
arr[j,ari[j]] <- x[i]
if (j == par1) j = 0
}
ari
arr
arr.sd <- array(NA,dim=par1)
arr.range <- array(NA,dim=par1)
arr.iqr <- array(NA,dim=par1)
for (j in 1:par1)
{
arr.sd[j] <- sqrt(var(arr[j,],na.rm=TRUE))
arr.range[j] <- max(arr[j,],na.rm=TRUE) - min(arr[j,],na.rm=TRUE)
arr.iqr[j] <- quantile(arr[j,],0.75,na.rm=TRUE) - quantile(arr[j,],0.25,na.rm=TRUE)
}
overall.sd <- sqrt(var(x))
overall.range <- max(x) - min(x)
overall.iqr <- quantile(x,0.75) - quantile(x,0.25)
bitmap(file='plot1.png')
plot(arr.sd,type='b',ylab='S.D.',main='Standard Deviation Plot',xlab='Periodic Index')
mtext(paste('# blocks = ',np))
abline(overall.sd,0)
dev.off()
bitmap(file='plot2.png')
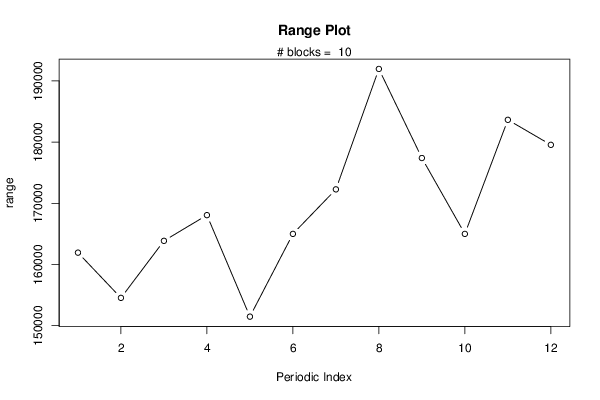
plot(arr.range,type='b',ylab='range',main='Range Plot',xlab='Periodic Index')
mtext(paste('# blocks = ',np))
abline(overall.range,0)
dev.off()
bitmap(file='plot3.png')
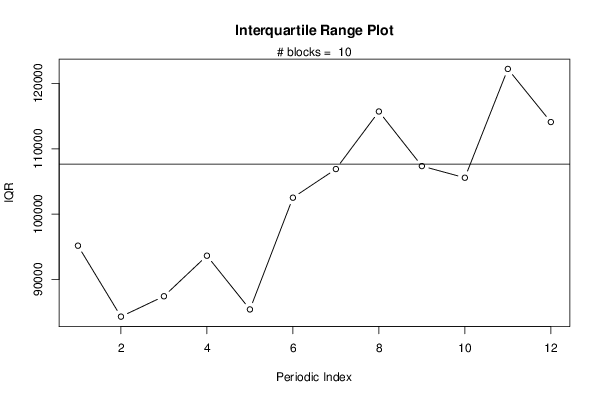
plot(arr.iqr,type='b',ylab='IQR',main='Interquartile Range Plot',xlab='Periodic Index')
mtext(paste('# blocks = ',np))
abline(overall.iqr,0)
dev.off()
bitmap(file='plot4.png')
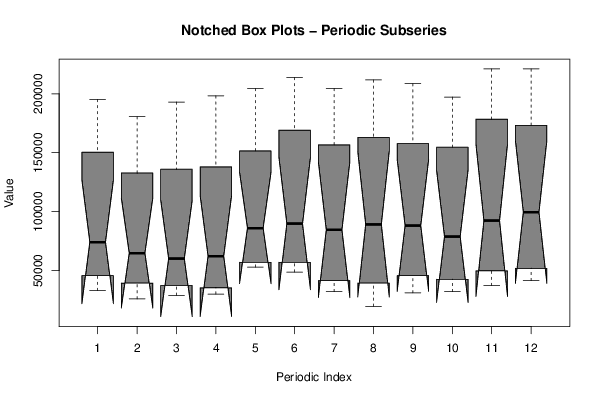
z <- data.frame(t(arr))
names(z) <- c(1:par1)
(boxplot(z,notch=TRUE,col='grey',xlab='Periodic Index',ylab='Value',main='Notched Box Plots - Periodic Subseries'))
dev.off()
bitmap(file='plot5.png')
z <- data.frame(arr)
names(z) <- c(1:np)
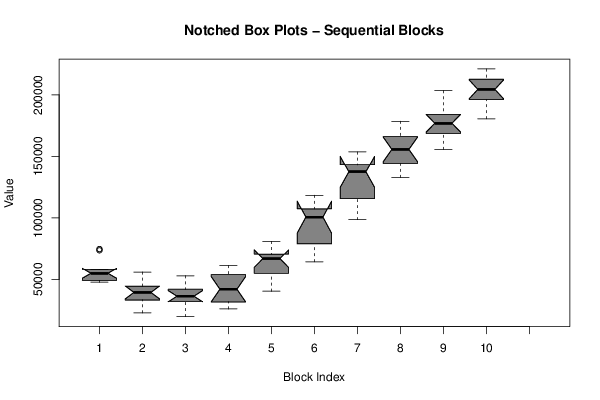
(boxplot(z,notch=TRUE,col='grey',xlab='Block Index',ylab='Value',main='Notched Box Plots - Sequential Blocks'))
dev.off()
bitmap(file='plot6.png')
z <- data.frame(cbind(arr.sd,arr.range,arr.iqr))
names(z) <- list('S.D.','Range','IQR')
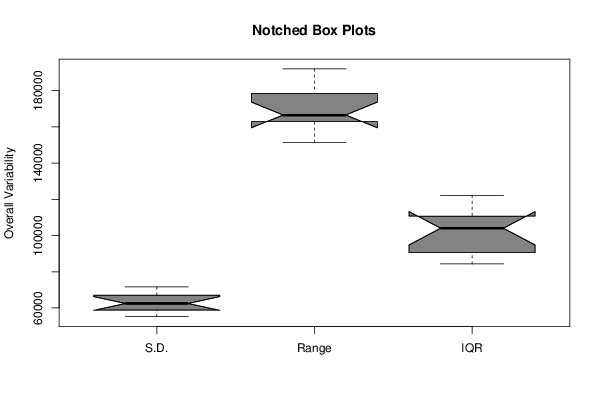
(boxplot(z,notch=TRUE,col='grey',ylab='Overall Variability',main='Notched Box Plots'))
dev.off()