Free Statistics

of Irreproducible Research!

Author's title

Author*Unverified author*
R Software Modulerwasp_autocorrelation.wasp
Title produced by software(Partial) Autocorrelation Function
Date of computationMon, 15 Aug 2016 10:22:11 +0100
Cite this page as followsStatistical Computations at FreeStatistics.org, Office for Research Development and Education, URL https://freestatistics.org/blog/index.php?v=date/2016/Aug/15/t1471253000nkrka8ojm98k1er.htm/, Retrieved Sun, 28 Apr 2024 20:23:17 +0200
Statistical Computations at FreeStatistics.org, Office for Research Development and Education, URL https://freestatistics.org/blog/index.php?pk=, Retrieved Sun, 28 Apr 2024 20:23:17 +0200
QR Codes:

Original text written by user:
IsPrivate?No (this computation is public)
User-defined keywords
Estimated Impact0
Dataseries X:
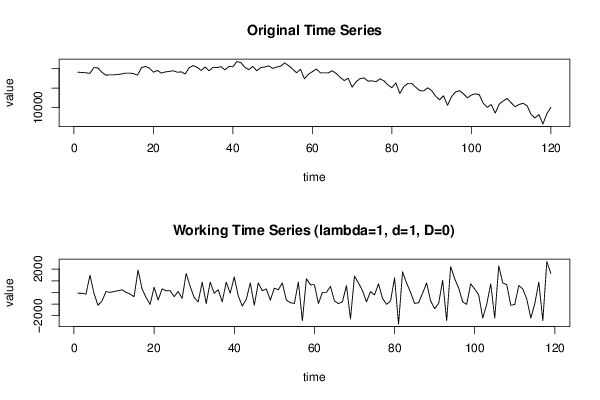
19064
18993
18921
18772
20246
20168
19064
18330
18401
18401
18480
18622
18843
18843
18701
18330
20246
20538
20097
19064
19506
18843
19142
19285
19434
19064
19142
18622
20246
20759
20318
19506
20389
19434
20318
20246
20467
19655
20538
20467
21792
21493
20318
19726
20538
19434
20246
20389
20688
20026
20389
20610
21422
20759
19876
18921
19805
17375
18551
19213
19876
18921
18921
18921
19434
18701
17739
16934
17518
15238
16635
17447
17596
16784
16855
16635
17375
16855
15830
15089
16342
13621
15388
16193
16193
15238
14355
14284
15089
14355
12959
11997
13030
10601
12809
13984
14355
13543
12517
13251
13543
13322
11113
10088
10821
8613
10893
11705
12367
11263
10230
10821
11113
10529
8321
7359
8242
5813
8463
10088


Summary of computational transaction
Raw Inputview raw input (R code)
Raw Outputview raw output of R engine
Computing time2 seconds
R Server'George Udny Yule' @ yule.wessa.net

\begin{tabular}{lllllllll}
\hline
Summary of computational transaction \tabularnewline
Raw Input & view raw input (R code)  \tabularnewline
Raw Output & view raw output of R engine  \tabularnewline
Computing time & 2 seconds \tabularnewline
R Server & 'George Udny Yule' @ yule.wessa.net \tabularnewline
\hline
\end{tabular}
%Source: https://freestatistics.org/blog/index.php?pk=&T=0

[TABLE]
[ROW][C]Summary of computational transaction[/C][/ROW]
[ROW][C]Raw Input[/C][C]view raw input (R code) [/C][/ROW]
[ROW][C]Raw Output[/C][C]view raw output of R engine [/C][/ROW]
[ROW][C]Computing time[/C][C]2 seconds[/C][/ROW]
[ROW][C]R Server[/C][C]'George Udny Yule' @ yule.wessa.net[/C][/ROW]
[/TABLE]
Source: https://freestatistics.org/blog/index.php?pk=&T=0

Globally Unique Identifier (entire table): ba.freestatistics.org/blog/index.php?pk=&T=0

As an alternative you can also use a QR Code:  

The GUIDs for individual cells are displayed in the table below:

Summary of computational transaction
Raw Inputview raw input (R code)
Raw Outputview raw output of R engine
Computing time2 seconds
R Server'George Udny Yule' @ yule.wessa.net


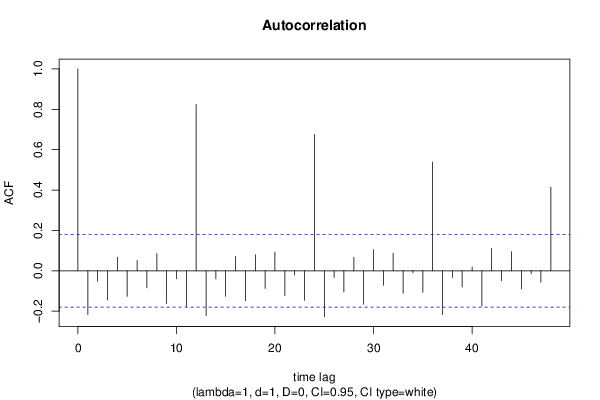
Autocorrelation Function
Time lag kACF(k)T-STATP-value
1-0.216906-2.36620.009794
2-0.052827-0.57630.282758
3-0.144728-1.57880.058519
40.0670330.73120.233035
5-0.127179-1.38740.083963
60.050570.55160.291112
7-0.084742-0.92440.178566
80.0849790.9270.177899
9-0.162055-1.76780.039828
10-0.0398-0.43420.332476
11-0.178014-1.94190.027256
120.8242888.99190
13-0.222699-2.42940.00831
14-0.040343-0.44010.330336
15-0.126437-1.37930.085199
160.0712580.77730.219252
17-0.148908-1.62440.053469
180.0786670.85820.196265
19-0.087466-0.95410.170974
200.0933111.01790.155396
21-0.122622-1.33760.091781
22-0.020635-0.22510.411143
23-0.146841-1.60180.055921
240.6759217.37340
25-0.227425-2.48090.007251
26-0.032956-0.35950.359925
27-0.105104-1.14660.126934
280.0665240.72570.234725
29-0.166075-1.81170.03628
300.104621.14130.128024
31-0.071965-0.7850.216994
320.0869940.9490.172274
33-0.110953-1.21040.114271
34-0.009771-0.10660.457646
35-0.106316-1.15980.124233
360.5385935.87540
37-0.216558-2.36240.009891
38-0.033417-0.36450.358053
39-0.080526-0.87840.19074
400.0186280.20320.419661
41-0.174393-1.90240.029768
420.1107921.20860.114607
43-0.049793-0.54320.294011
440.0949651.03590.151164
45-0.089998-0.98180.164104
46-0.015308-0.1670.433829
47-0.057284-0.62490.266618
480.4131574.5078e-06

\begin{tabular}{lllllllll}
\hline
Autocorrelation Function \tabularnewline
Time lag k & ACF(k) & T-STAT & P-value \tabularnewline
1 & -0.216906 & -2.3662 & 0.009794 \tabularnewline
2 & -0.052827 & -0.5763 & 0.282758 \tabularnewline
3 & -0.144728 & -1.5788 & 0.058519 \tabularnewline
4 & 0.067033 & 0.7312 & 0.233035 \tabularnewline
5 & -0.127179 & -1.3874 & 0.083963 \tabularnewline
6 & 0.05057 & 0.5516 & 0.291112 \tabularnewline
7 & -0.084742 & -0.9244 & 0.178566 \tabularnewline
8 & 0.084979 & 0.927 & 0.177899 \tabularnewline
9 & -0.162055 & -1.7678 & 0.039828 \tabularnewline
10 & -0.0398 & -0.4342 & 0.332476 \tabularnewline
11 & -0.178014 & -1.9419 & 0.027256 \tabularnewline
12 & 0.824288 & 8.9919 & 0 \tabularnewline
13 & -0.222699 & -2.4294 & 0.00831 \tabularnewline
14 & -0.040343 & -0.4401 & 0.330336 \tabularnewline
15 & -0.126437 & -1.3793 & 0.085199 \tabularnewline
16 & 0.071258 & 0.7773 & 0.219252 \tabularnewline
17 & -0.148908 & -1.6244 & 0.053469 \tabularnewline
18 & 0.078667 & 0.8582 & 0.196265 \tabularnewline
19 & -0.087466 & -0.9541 & 0.170974 \tabularnewline
20 & 0.093311 & 1.0179 & 0.155396 \tabularnewline
21 & -0.122622 & -1.3376 & 0.091781 \tabularnewline
22 & -0.020635 & -0.2251 & 0.411143 \tabularnewline
23 & -0.146841 & -1.6018 & 0.055921 \tabularnewline
24 & 0.675921 & 7.3734 & 0 \tabularnewline
25 & -0.227425 & -2.4809 & 0.007251 \tabularnewline
26 & -0.032956 & -0.3595 & 0.359925 \tabularnewline
27 & -0.105104 & -1.1466 & 0.126934 \tabularnewline
28 & 0.066524 & 0.7257 & 0.234725 \tabularnewline
29 & -0.166075 & -1.8117 & 0.03628 \tabularnewline
30 & 0.10462 & 1.1413 & 0.128024 \tabularnewline
31 & -0.071965 & -0.785 & 0.216994 \tabularnewline
32 & 0.086994 & 0.949 & 0.172274 \tabularnewline
33 & -0.110953 & -1.2104 & 0.114271 \tabularnewline
34 & -0.009771 & -0.1066 & 0.457646 \tabularnewline
35 & -0.106316 & -1.1598 & 0.124233 \tabularnewline
36 & 0.538593 & 5.8754 & 0 \tabularnewline
37 & -0.216558 & -2.3624 & 0.009891 \tabularnewline
38 & -0.033417 & -0.3645 & 0.358053 \tabularnewline
39 & -0.080526 & -0.8784 & 0.19074 \tabularnewline
40 & 0.018628 & 0.2032 & 0.419661 \tabularnewline
41 & -0.174393 & -1.9024 & 0.029768 \tabularnewline
42 & 0.110792 & 1.2086 & 0.114607 \tabularnewline
43 & -0.049793 & -0.5432 & 0.294011 \tabularnewline
44 & 0.094965 & 1.0359 & 0.151164 \tabularnewline
45 & -0.089998 & -0.9818 & 0.164104 \tabularnewline
46 & -0.015308 & -0.167 & 0.433829 \tabularnewline
47 & -0.057284 & -0.6249 & 0.266618 \tabularnewline
48 & 0.413157 & 4.507 & 8e-06 \tabularnewline
\hline
\end{tabular}
%Source: https://freestatistics.org/blog/index.php?pk=&T=1

[TABLE]
[ROW][C]Autocorrelation Function[/C][/ROW]
[ROW][C]Time lag k[/C][C]ACF(k)[/C][C]T-STAT[/C][C]P-value[/C][/ROW]
[ROW][C]1[/C][C]-0.216906[/C][C]-2.3662[/C][C]0.009794[/C][/ROW]
[ROW][C]2[/C][C]-0.052827[/C][C]-0.5763[/C][C]0.282758[/C][/ROW]
[ROW][C]3[/C][C]-0.144728[/C][C]-1.5788[/C][C]0.058519[/C][/ROW]
[ROW][C]4[/C][C]0.067033[/C][C]0.7312[/C][C]0.233035[/C][/ROW]
[ROW][C]5[/C][C]-0.127179[/C][C]-1.3874[/C][C]0.083963[/C][/ROW]
[ROW][C]6[/C][C]0.05057[/C][C]0.5516[/C][C]0.291112[/C][/ROW]
[ROW][C]7[/C][C]-0.084742[/C][C]-0.9244[/C][C]0.178566[/C][/ROW]
[ROW][C]8[/C][C]0.084979[/C][C]0.927[/C][C]0.177899[/C][/ROW]
[ROW][C]9[/C][C]-0.162055[/C][C]-1.7678[/C][C]0.039828[/C][/ROW]
[ROW][C]10[/C][C]-0.0398[/C][C]-0.4342[/C][C]0.332476[/C][/ROW]
[ROW][C]11[/C][C]-0.178014[/C][C]-1.9419[/C][C]0.027256[/C][/ROW]
[ROW][C]12[/C][C]0.824288[/C][C]8.9919[/C][C]0[/C][/ROW]
[ROW][C]13[/C][C]-0.222699[/C][C]-2.4294[/C][C]0.00831[/C][/ROW]
[ROW][C]14[/C][C]-0.040343[/C][C]-0.4401[/C][C]0.330336[/C][/ROW]
[ROW][C]15[/C][C]-0.126437[/C][C]-1.3793[/C][C]0.085199[/C][/ROW]
[ROW][C]16[/C][C]0.071258[/C][C]0.7773[/C][C]0.219252[/C][/ROW]
[ROW][C]17[/C][C]-0.148908[/C][C]-1.6244[/C][C]0.053469[/C][/ROW]
[ROW][C]18[/C][C]0.078667[/C][C]0.8582[/C][C]0.196265[/C][/ROW]
[ROW][C]19[/C][C]-0.087466[/C][C]-0.9541[/C][C]0.170974[/C][/ROW]
[ROW][C]20[/C][C]0.093311[/C][C]1.0179[/C][C]0.155396[/C][/ROW]
[ROW][C]21[/C][C]-0.122622[/C][C]-1.3376[/C][C]0.091781[/C][/ROW]
[ROW][C]22[/C][C]-0.020635[/C][C]-0.2251[/C][C]0.411143[/C][/ROW]
[ROW][C]23[/C][C]-0.146841[/C][C]-1.6018[/C][C]0.055921[/C][/ROW]
[ROW][C]24[/C][C]0.675921[/C][C]7.3734[/C][C]0[/C][/ROW]
[ROW][C]25[/C][C]-0.227425[/C][C]-2.4809[/C][C]0.007251[/C][/ROW]
[ROW][C]26[/C][C]-0.032956[/C][C]-0.3595[/C][C]0.359925[/C][/ROW]
[ROW][C]27[/C][C]-0.105104[/C][C]-1.1466[/C][C]0.126934[/C][/ROW]
[ROW][C]28[/C][C]0.066524[/C][C]0.7257[/C][C]0.234725[/C][/ROW]
[ROW][C]29[/C][C]-0.166075[/C][C]-1.8117[/C][C]0.03628[/C][/ROW]
[ROW][C]30[/C][C]0.10462[/C][C]1.1413[/C][C]0.128024[/C][/ROW]
[ROW][C]31[/C][C]-0.071965[/C][C]-0.785[/C][C]0.216994[/C][/ROW]
[ROW][C]32[/C][C]0.086994[/C][C]0.949[/C][C]0.172274[/C][/ROW]
[ROW][C]33[/C][C]-0.110953[/C][C]-1.2104[/C][C]0.114271[/C][/ROW]
[ROW][C]34[/C][C]-0.009771[/C][C]-0.1066[/C][C]0.457646[/C][/ROW]
[ROW][C]35[/C][C]-0.106316[/C][C]-1.1598[/C][C]0.124233[/C][/ROW]
[ROW][C]36[/C][C]0.538593[/C][C]5.8754[/C][C]0[/C][/ROW]
[ROW][C]37[/C][C]-0.216558[/C][C]-2.3624[/C][C]0.009891[/C][/ROW]
[ROW][C]38[/C][C]-0.033417[/C][C]-0.3645[/C][C]0.358053[/C][/ROW]
[ROW][C]39[/C][C]-0.080526[/C][C]-0.8784[/C][C]0.19074[/C][/ROW]
[ROW][C]40[/C][C]0.018628[/C][C]0.2032[/C][C]0.419661[/C][/ROW]
[ROW][C]41[/C][C]-0.174393[/C][C]-1.9024[/C][C]0.029768[/C][/ROW]
[ROW][C]42[/C][C]0.110792[/C][C]1.2086[/C][C]0.114607[/C][/ROW]
[ROW][C]43[/C][C]-0.049793[/C][C]-0.5432[/C][C]0.294011[/C][/ROW]
[ROW][C]44[/C][C]0.094965[/C][C]1.0359[/C][C]0.151164[/C][/ROW]
[ROW][C]45[/C][C]-0.089998[/C][C]-0.9818[/C][C]0.164104[/C][/ROW]
[ROW][C]46[/C][C]-0.015308[/C][C]-0.167[/C][C]0.433829[/C][/ROW]
[ROW][C]47[/C][C]-0.057284[/C][C]-0.6249[/C][C]0.266618[/C][/ROW]
[ROW][C]48[/C][C]0.413157[/C][C]4.507[/C][C]8e-06[/C][/ROW]
[/TABLE]
Source: https://freestatistics.org/blog/index.php?pk=&T=1

Globally Unique Identifier (entire table): ba.freestatistics.org/blog/index.php?pk=&T=1

As an alternative you can also use a QR Code:  

The GUIDs for individual cells are displayed in the table below:

Autocorrelation Function
Time lag kACF(k)T-STATP-value
1-0.216906-2.36620.009794
2-0.052827-0.57630.282758
3-0.144728-1.57880.058519
40.0670330.73120.233035
5-0.127179-1.38740.083963
60.050570.55160.291112
7-0.084742-0.92440.178566
80.0849790.9270.177899
9-0.162055-1.76780.039828
10-0.0398-0.43420.332476
11-0.178014-1.94190.027256
120.8242888.99190
13-0.222699-2.42940.00831
14-0.040343-0.44010.330336
15-0.126437-1.37930.085199
160.0712580.77730.219252
17-0.148908-1.62440.053469
180.0786670.85820.196265
19-0.087466-0.95410.170974
200.0933111.01790.155396
21-0.122622-1.33760.091781
22-0.020635-0.22510.411143
23-0.146841-1.60180.055921
240.6759217.37340
25-0.227425-2.48090.007251
26-0.032956-0.35950.359925
27-0.105104-1.14660.126934
280.0665240.72570.234725
29-0.166075-1.81170.03628
300.104621.14130.128024
31-0.071965-0.7850.216994
320.0869940.9490.172274
33-0.110953-1.21040.114271
34-0.009771-0.10660.457646
35-0.106316-1.15980.124233
360.5385935.87540
37-0.216558-2.36240.009891
38-0.033417-0.36450.358053
39-0.080526-0.87840.19074
400.0186280.20320.419661
41-0.174393-1.90240.029768
420.1107921.20860.114607
43-0.049793-0.54320.294011
440.0949651.03590.151164
45-0.089998-0.98180.164104
46-0.015308-0.1670.433829
47-0.057284-0.62490.266618
480.4131574.5078e-06


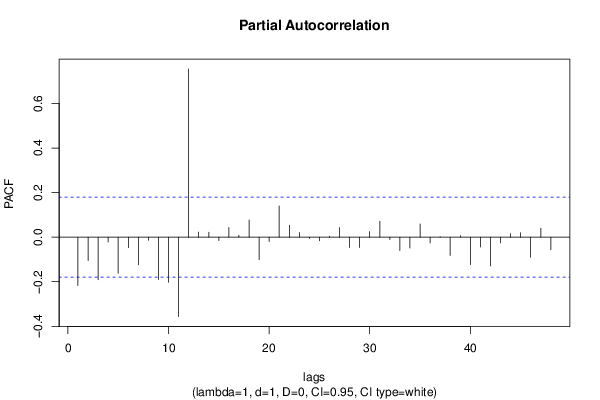
Partial Autocorrelation Function
Time lag kPACF(k)T-STATP-value
1-0.216906-2.36620.009794
2-0.104807-1.14330.127603
3-0.191113-2.08480.019613
4-0.021979-0.23980.405463
5-0.161887-1.7660.039982
6-0.047081-0.51360.304244
7-0.123989-1.35260.089381
8-0.013633-0.14870.441014
9-0.190288-2.07580.020033
10-0.202374-2.20760.014593
11-0.356777-3.8928.2e-05
120.7549058.2350
130.0226310.24690.402713
140.0220060.24010.40535
15-0.014819-0.16170.435924
160.0432670.4720.318899
170.0084680.09240.463279
180.077160.84170.200818
19-0.100726-1.09880.137039
20-0.019258-0.21010.416982
210.1401631.5290.064459
220.0534310.58290.280543
230.0211850.23110.408818
24-0.006015-0.06560.473895
25-0.016166-0.17630.430161
260.0039220.04280.482974
270.04370.47670.317222
28-0.046821-0.51080.305233
29-0.04663-0.50870.305962
300.025740.28080.38968
310.0711470.77610.21961
32-0.010283-0.11220.455439
33-0.060151-0.65620.256492
34-0.048444-0.52850.299081
350.0587220.64060.261514
36-0.025592-0.27920.390299
370.001550.01690.493268
38-0.081776-0.89210.187078
390.0062030.06770.473082
40-0.12315-1.34340.090847
41-0.043859-0.47840.316605
42-0.129025-1.40750.080943
43-0.025571-0.27890.390385
440.0159360.17380.431143
450.0196510.21440.415315
46-0.090472-0.98690.162839
470.0402730.43930.330609
48-0.056761-0.61920.268489

\begin{tabular}{lllllllll}
\hline
Partial Autocorrelation Function \tabularnewline
Time lag k & PACF(k) & T-STAT & P-value \tabularnewline
1 & -0.216906 & -2.3662 & 0.009794 \tabularnewline
2 & -0.104807 & -1.1433 & 0.127603 \tabularnewline
3 & -0.191113 & -2.0848 & 0.019613 \tabularnewline
4 & -0.021979 & -0.2398 & 0.405463 \tabularnewline
5 & -0.161887 & -1.766 & 0.039982 \tabularnewline
6 & -0.047081 & -0.5136 & 0.304244 \tabularnewline
7 & -0.123989 & -1.3526 & 0.089381 \tabularnewline
8 & -0.013633 & -0.1487 & 0.441014 \tabularnewline
9 & -0.190288 & -2.0758 & 0.020033 \tabularnewline
10 & -0.202374 & -2.2076 & 0.014593 \tabularnewline
11 & -0.356777 & -3.892 & 8.2e-05 \tabularnewline
12 & 0.754905 & 8.235 & 0 \tabularnewline
13 & 0.022631 & 0.2469 & 0.402713 \tabularnewline
14 & 0.022006 & 0.2401 & 0.40535 \tabularnewline
15 & -0.014819 & -0.1617 & 0.435924 \tabularnewline
16 & 0.043267 & 0.472 & 0.318899 \tabularnewline
17 & 0.008468 & 0.0924 & 0.463279 \tabularnewline
18 & 0.07716 & 0.8417 & 0.200818 \tabularnewline
19 & -0.100726 & -1.0988 & 0.137039 \tabularnewline
20 & -0.019258 & -0.2101 & 0.416982 \tabularnewline
21 & 0.140163 & 1.529 & 0.064459 \tabularnewline
22 & 0.053431 & 0.5829 & 0.280543 \tabularnewline
23 & 0.021185 & 0.2311 & 0.408818 \tabularnewline
24 & -0.006015 & -0.0656 & 0.473895 \tabularnewline
25 & -0.016166 & -0.1763 & 0.430161 \tabularnewline
26 & 0.003922 & 0.0428 & 0.482974 \tabularnewline
27 & 0.0437 & 0.4767 & 0.317222 \tabularnewline
28 & -0.046821 & -0.5108 & 0.305233 \tabularnewline
29 & -0.04663 & -0.5087 & 0.305962 \tabularnewline
30 & 0.02574 & 0.2808 & 0.38968 \tabularnewline
31 & 0.071147 & 0.7761 & 0.21961 \tabularnewline
32 & -0.010283 & -0.1122 & 0.455439 \tabularnewline
33 & -0.060151 & -0.6562 & 0.256492 \tabularnewline
34 & -0.048444 & -0.5285 & 0.299081 \tabularnewline
35 & 0.058722 & 0.6406 & 0.261514 \tabularnewline
36 & -0.025592 & -0.2792 & 0.390299 \tabularnewline
37 & 0.00155 & 0.0169 & 0.493268 \tabularnewline
38 & -0.081776 & -0.8921 & 0.187078 \tabularnewline
39 & 0.006203 & 0.0677 & 0.473082 \tabularnewline
40 & -0.12315 & -1.3434 & 0.090847 \tabularnewline
41 & -0.043859 & -0.4784 & 0.316605 \tabularnewline
42 & -0.129025 & -1.4075 & 0.080943 \tabularnewline
43 & -0.025571 & -0.2789 & 0.390385 \tabularnewline
44 & 0.015936 & 0.1738 & 0.431143 \tabularnewline
45 & 0.019651 & 0.2144 & 0.415315 \tabularnewline
46 & -0.090472 & -0.9869 & 0.162839 \tabularnewline
47 & 0.040273 & 0.4393 & 0.330609 \tabularnewline
48 & -0.056761 & -0.6192 & 0.268489 \tabularnewline
\hline
\end{tabular}
%Source: https://freestatistics.org/blog/index.php?pk=&T=2

[TABLE]
[ROW][C]Partial Autocorrelation Function[/C][/ROW]
[ROW][C]Time lag k[/C][C]PACF(k)[/C][C]T-STAT[/C][C]P-value[/C][/ROW]
[ROW][C]1[/C][C]-0.216906[/C][C]-2.3662[/C][C]0.009794[/C][/ROW]
[ROW][C]2[/C][C]-0.104807[/C][C]-1.1433[/C][C]0.127603[/C][/ROW]
[ROW][C]3[/C][C]-0.191113[/C][C]-2.0848[/C][C]0.019613[/C][/ROW]
[ROW][C]4[/C][C]-0.021979[/C][C]-0.2398[/C][C]0.405463[/C][/ROW]
[ROW][C]5[/C][C]-0.161887[/C][C]-1.766[/C][C]0.039982[/C][/ROW]
[ROW][C]6[/C][C]-0.047081[/C][C]-0.5136[/C][C]0.304244[/C][/ROW]
[ROW][C]7[/C][C]-0.123989[/C][C]-1.3526[/C][C]0.089381[/C][/ROW]
[ROW][C]8[/C][C]-0.013633[/C][C]-0.1487[/C][C]0.441014[/C][/ROW]
[ROW][C]9[/C][C]-0.190288[/C][C]-2.0758[/C][C]0.020033[/C][/ROW]
[ROW][C]10[/C][C]-0.202374[/C][C]-2.2076[/C][C]0.014593[/C][/ROW]
[ROW][C]11[/C][C]-0.356777[/C][C]-3.892[/C][C]8.2e-05[/C][/ROW]
[ROW][C]12[/C][C]0.754905[/C][C]8.235[/C][C]0[/C][/ROW]
[ROW][C]13[/C][C]0.022631[/C][C]0.2469[/C][C]0.402713[/C][/ROW]
[ROW][C]14[/C][C]0.022006[/C][C]0.2401[/C][C]0.40535[/C][/ROW]
[ROW][C]15[/C][C]-0.014819[/C][C]-0.1617[/C][C]0.435924[/C][/ROW]
[ROW][C]16[/C][C]0.043267[/C][C]0.472[/C][C]0.318899[/C][/ROW]
[ROW][C]17[/C][C]0.008468[/C][C]0.0924[/C][C]0.463279[/C][/ROW]
[ROW][C]18[/C][C]0.07716[/C][C]0.8417[/C][C]0.200818[/C][/ROW]
[ROW][C]19[/C][C]-0.100726[/C][C]-1.0988[/C][C]0.137039[/C][/ROW]
[ROW][C]20[/C][C]-0.019258[/C][C]-0.2101[/C][C]0.416982[/C][/ROW]
[ROW][C]21[/C][C]0.140163[/C][C]1.529[/C][C]0.064459[/C][/ROW]
[ROW][C]22[/C][C]0.053431[/C][C]0.5829[/C][C]0.280543[/C][/ROW]
[ROW][C]23[/C][C]0.021185[/C][C]0.2311[/C][C]0.408818[/C][/ROW]
[ROW][C]24[/C][C]-0.006015[/C][C]-0.0656[/C][C]0.473895[/C][/ROW]
[ROW][C]25[/C][C]-0.016166[/C][C]-0.1763[/C][C]0.430161[/C][/ROW]
[ROW][C]26[/C][C]0.003922[/C][C]0.0428[/C][C]0.482974[/C][/ROW]
[ROW][C]27[/C][C]0.0437[/C][C]0.4767[/C][C]0.317222[/C][/ROW]
[ROW][C]28[/C][C]-0.046821[/C][C]-0.5108[/C][C]0.305233[/C][/ROW]
[ROW][C]29[/C][C]-0.04663[/C][C]-0.5087[/C][C]0.305962[/C][/ROW]
[ROW][C]30[/C][C]0.02574[/C][C]0.2808[/C][C]0.38968[/C][/ROW]
[ROW][C]31[/C][C]0.071147[/C][C]0.7761[/C][C]0.21961[/C][/ROW]
[ROW][C]32[/C][C]-0.010283[/C][C]-0.1122[/C][C]0.455439[/C][/ROW]
[ROW][C]33[/C][C]-0.060151[/C][C]-0.6562[/C][C]0.256492[/C][/ROW]
[ROW][C]34[/C][C]-0.048444[/C][C]-0.5285[/C][C]0.299081[/C][/ROW]
[ROW][C]35[/C][C]0.058722[/C][C]0.6406[/C][C]0.261514[/C][/ROW]
[ROW][C]36[/C][C]-0.025592[/C][C]-0.2792[/C][C]0.390299[/C][/ROW]
[ROW][C]37[/C][C]0.00155[/C][C]0.0169[/C][C]0.493268[/C][/ROW]
[ROW][C]38[/C][C]-0.081776[/C][C]-0.8921[/C][C]0.187078[/C][/ROW]
[ROW][C]39[/C][C]0.006203[/C][C]0.0677[/C][C]0.473082[/C][/ROW]
[ROW][C]40[/C][C]-0.12315[/C][C]-1.3434[/C][C]0.090847[/C][/ROW]
[ROW][C]41[/C][C]-0.043859[/C][C]-0.4784[/C][C]0.316605[/C][/ROW]
[ROW][C]42[/C][C]-0.129025[/C][C]-1.4075[/C][C]0.080943[/C][/ROW]
[ROW][C]43[/C][C]-0.025571[/C][C]-0.2789[/C][C]0.390385[/C][/ROW]
[ROW][C]44[/C][C]0.015936[/C][C]0.1738[/C][C]0.431143[/C][/ROW]
[ROW][C]45[/C][C]0.019651[/C][C]0.2144[/C][C]0.415315[/C][/ROW]
[ROW][C]46[/C][C]-0.090472[/C][C]-0.9869[/C][C]0.162839[/C][/ROW]
[ROW][C]47[/C][C]0.040273[/C][C]0.4393[/C][C]0.330609[/C][/ROW]
[ROW][C]48[/C][C]-0.056761[/C][C]-0.6192[/C][C]0.268489[/C][/ROW]
[/TABLE]
Source: https://freestatistics.org/blog/index.php?pk=&T=2

Globally Unique Identifier (entire table): ba.freestatistics.org/blog/index.php?pk=&T=2

As an alternative you can also use a QR Code:  

The GUIDs for individual cells are displayed in the table below:

Partial Autocorrelation Function
Time lag kPACF(k)T-STATP-value
1-0.216906-2.36620.009794
2-0.104807-1.14330.127603
3-0.191113-2.08480.019613
4-0.021979-0.23980.405463
5-0.161887-1.7660.039982
6-0.047081-0.51360.304244
7-0.123989-1.35260.089381
8-0.013633-0.14870.441014
9-0.190288-2.07580.020033
10-0.202374-2.20760.014593
11-0.356777-3.8928.2e-05
120.7549058.2350
130.0226310.24690.402713
140.0220060.24010.40535
15-0.014819-0.16170.435924
160.0432670.4720.318899
170.0084680.09240.463279
180.077160.84170.200818
19-0.100726-1.09880.137039
20-0.019258-0.21010.416982
210.1401631.5290.064459
220.0534310.58290.280543
230.0211850.23110.408818
24-0.006015-0.06560.473895
25-0.016166-0.17630.430161
260.0039220.04280.482974
270.04370.47670.317222
28-0.046821-0.51080.305233
29-0.04663-0.50870.305962
300.025740.28080.38968
310.0711470.77610.21961
32-0.010283-0.11220.455439
33-0.060151-0.65620.256492
34-0.048444-0.52850.299081
350.0587220.64060.261514
36-0.025592-0.27920.390299
370.001550.01690.493268
38-0.081776-0.89210.187078
390.0062030.06770.473082
40-0.12315-1.34340.090847
41-0.043859-0.47840.316605
42-0.129025-1.40750.080943
43-0.025571-0.27890.390385
440.0159360.17380.431143
450.0196510.21440.415315
46-0.090472-0.98690.162839
470.0402730.43930.330609
48-0.056761-0.61920.268489


Parameters (Session):
par1 = 48 ; par2 = 1 ; par3 = 1 ; par4 = 0 ; par5 = 12 ; par6 = White Noise ; par7 = 0.95 ;
Parameters (R input):
par1 = 48 ; par2 = 1 ; par3 = 1 ; par4 = 0 ; par5 = 12 ; par6 = White Noise ; par7 = 0.95 ; par8 = ;
R code (references can be found in the software module):
if (par1 == 'Default') {
par1 = 10*log10(length(x))
} else {
par1 <- as.numeric(par1)
}
par2 <- as.numeric(par2)
par3 <- as.numeric(par3)
par4 <- as.numeric(par4)
par5 <- as.numeric(par5)
if (par6 == 'White Noise') par6 <- 'white' else par6 <- 'ma'
par7 <- as.numeric(par7)
if (par8 != '') par8 <- as.numeric(par8)
x <- na.omit(x)
ox <- x
if (par8 == '') {
if (par2 == 0) {
x <- log(x)
} else {
x <- (x ^ par2 - 1) / par2
}
} else {
x <- log(x,base=par8)
}
if (par3 > 0) x <- diff(x,lag=1,difference=par3)
if (par4 > 0) x <- diff(x,lag=par5,difference=par4)
bitmap(file='picts.png')
op <- par(mfrow=c(2,1))
plot(ox,type='l',main='Original Time Series',xlab='time',ylab='value')
if (par8=='') {
mytitle <- paste('Working Time Series (lambda=',par2,', d=',par3,', D=',par4,')',sep='')
mysub <- paste('(lambda=',par2,', d=',par3,', D=',par4,', CI=', par7, ', CI type=',par6,')',sep='')
} else {
mytitle <- paste('Working Time Series (base=',par8,', d=',par3,', D=',par4,')',sep='')
mysub <- paste('(base=',par8,', d=',par3,', D=',par4,', CI=', par7, ', CI type=',par6,')',sep='')
}
plot(x,type='l', main=mytitle,xlab='time',ylab='value')
par(op)
dev.off()
bitmap(file='pic1.png')
racf <- acf(x, par1, main='Autocorrelation', xlab='time lag', ylab='ACF', ci.type=par6, ci=par7, sub=mysub)
dev.off()
bitmap(file='pic2.png')
rpacf <- pacf(x,par1,main='Partial Autocorrelation',xlab='lags',ylab='PACF',sub=mysub)
dev.off()
(myacf <- c(racf$acf))
(mypacf <- c(rpacf$acf))
lengthx <- length(x)
sqrtn <- sqrt(lengthx)
load(file='createtable')
a<-table.start()
a<-table.row.start(a)
a<-table.element(a,'Autocorrelation Function',4,TRUE)
a<-table.row.end(a)
a<-table.row.start(a)
a<-table.element(a,'Time lag k',header=TRUE)
a<-table.element(a,hyperlink('basics.htm','ACF(k)','click here for more information about the Autocorrelation Function'),header=TRUE)
a<-table.element(a,'T-STAT',header=TRUE)
a<-table.element(a,'P-value',header=TRUE)
a<-table.row.end(a)
for (i in 2:(par1+1)) {
a<-table.row.start(a)
a<-table.element(a,i-1,header=TRUE)
a<-table.element(a,round(myacf[i],6))
mytstat <- myacf[i]*sqrtn
a<-table.element(a,round(mytstat,4))
a<-table.element(a,round(1-pt(abs(mytstat),lengthx),6))
a<-table.row.end(a)
}
a<-table.end(a)
table.save(a,file='mytable.tab')
a<-table.start()
a<-table.row.start(a)
a<-table.element(a,'Partial Autocorrelation Function',4,TRUE)
a<-table.row.end(a)
a<-table.row.start(a)
a<-table.element(a,'Time lag k',header=TRUE)
a<-table.element(a,hyperlink('basics.htm','PACF(k)','click here for more information about the Partial Autocorrelation Function'),header=TRUE)
a<-table.element(a,'T-STAT',header=TRUE)
a<-table.element(a,'P-value',header=TRUE)
a<-table.row.end(a)
for (i in 1:par1) {
a<-table.row.start(a)
a<-table.element(a,i,header=TRUE)
a<-table.element(a,round(mypacf[i],6))
mytstat <- mypacf[i]*sqrtn
a<-table.element(a,round(mytstat,4))
a<-table.element(a,round(1-pt(abs(mytstat),lengthx),6))
a<-table.row.end(a)
}
a<-table.end(a)
table.save(a,file='mytable1.tab')