Free Statistics

of Irreproducible Research!

Author's title

Author*Unverified author*
R Software Modulerwasp_autocorrelation.wasp
Title produced by software(Partial) Autocorrelation Function
Date of computationMon, 15 Aug 2016 17:03:29 +0100
Cite this page as followsStatistical Computations at FreeStatistics.org, Office for Research Development and Education, URL https://freestatistics.org/blog/index.php?v=date/2016/Aug/15/t14712770411inqo8og76caoj6.htm/, Retrieved Sun, 28 Apr 2024 06:19:44 +0200
Statistical Computations at FreeStatistics.org, Office for Research Development and Education, URL https://freestatistics.org/blog/index.php?pk=, Retrieved Sun, 28 Apr 2024 06:19:44 +0200
QR Codes:

Original text written by user:
IsPrivate?No (this computation is public)
User-defined keywords
Estimated Impact0
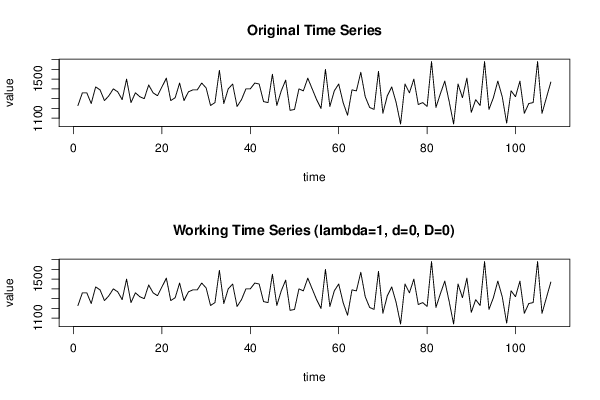
Dataseries X:
1230
1360
1360
1250
1420
1390
1280
1330
1400
1370
1290
1500
1260
1360
1320
1300
1440
1360
1330
1420
1510
1280
1310
1460
1280
1370
1390
1390
1460
1410
1230
1260
1590
1250
1400
1450
1220
1290
1400
1400
1460
1450
1270
1260
1550
1230
1380
1490
1180
1190
1400
1380
1510
1400
1290
1200
1600
1220
1380
1450
1260
1130
1390
1380
1570
1320
1210
1190
1580
1150
1330
1420
1260
1040
1450
1360
1500
1240
1260
1220
1680
1210
1350
1480
1270
1040
1450
1310
1510
1160
1290
1230
1680
1190
1310
1480
1320
1050
1380
1320
1480
1150
1250
1260
1680
1150
1310
1470


Summary of computational transaction
Raw Inputview raw input (R code)
Raw Outputview raw output of R engine
Computing time2 seconds
R Server'Herman Ole Andreas Wold' @ wold.wessa.net

\begin{tabular}{lllllllll}
\hline
Summary of computational transaction \tabularnewline
Raw Input & view raw input (R code)  \tabularnewline
Raw Output & view raw output of R engine  \tabularnewline
Computing time & 2 seconds \tabularnewline
R Server & 'Herman Ole Andreas Wold' @ wold.wessa.net \tabularnewline
\hline
\end{tabular}
%Source: https://freestatistics.org/blog/index.php?pk=&T=0

[TABLE]
[ROW][C]Summary of computational transaction[/C][/ROW]
[ROW][C]Raw Input[/C][C]view raw input (R code) [/C][/ROW]
[ROW][C]Raw Output[/C][C]view raw output of R engine [/C][/ROW]
[ROW][C]Computing time[/C][C]2 seconds[/C][/ROW]
[ROW][C]R Server[/C][C]'Herman Ole Andreas Wold' @ wold.wessa.net[/C][/ROW]
[/TABLE]
Source: https://freestatistics.org/blog/index.php?pk=&T=0

Globally Unique Identifier (entire table): ba.freestatistics.org/blog/index.php?pk=&T=0

As an alternative you can also use a QR Code:  

The GUIDs for individual cells are displayed in the table below:

Summary of computational transaction
Raw Inputview raw input (R code)
Raw Outputview raw output of R engine
Computing time2 seconds
R Server'Herman Ole Andreas Wold' @ wold.wessa.net


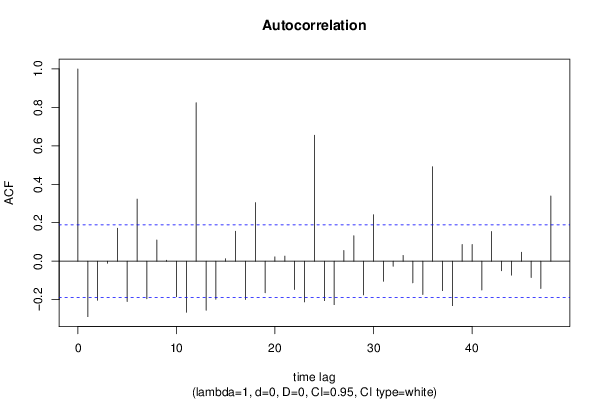
Autocorrelation Function
Time lag kACF(k)T-STATP-value
1-0.288638-2.99960.001678
2-0.202921-2.10880.018636
3-0.010785-0.11210.455482
40.1713311.78050.038901
5-0.209758-2.17990.015719
60.3229663.35640.000545
7-0.195159-2.02810.022503
80.1103171.14640.127072
90.0050820.05280.478989
10-0.185555-1.92830.028219
11-0.265832-2.76260.003371
120.8245858.56930
13-0.255143-2.65150.004609
14-0.198249-2.06030.020888
150.0122180.1270.449598
160.1559861.62110.053961
17-0.199719-2.07550.020156
180.3044293.16370.001012
19-0.164681-1.71140.044937
200.0225190.2340.407706
210.0263360.27370.392423
22-0.147058-1.52830.064684
23-0.211677-2.19980.014976
240.6554036.81110
25-0.205366-2.13420.017543
26-0.226242-2.35120.010264
270.0555020.57680.282641
280.1326521.37860.085439
29-0.175489-1.82370.035479
300.2412262.50690.006835
31-0.104761-1.08870.139352
32-0.026611-0.27660.391327
330.0300030.31180.377898
34-0.112768-1.17190.121904
35-0.173164-1.79960.03736
360.4911245.10391e-06
37-0.153383-1.5940.056929
38-0.231291-2.40360.008968
390.0867480.90150.184662
400.087160.90580.18353
41-0.150288-1.56180.060626
420.1542431.60290.055934
43-0.049753-0.5170.303092
44-0.072618-0.75470.226044
450.0467160.48550.314156
46-0.085159-0.8850.189062
47-0.142475-1.48060.070807
480.3392133.52520.000311

\begin{tabular}{lllllllll}
\hline
Autocorrelation Function \tabularnewline
Time lag k & ACF(k) & T-STAT & P-value \tabularnewline
1 & -0.288638 & -2.9996 & 0.001678 \tabularnewline
2 & -0.202921 & -2.1088 & 0.018636 \tabularnewline
3 & -0.010785 & -0.1121 & 0.455482 \tabularnewline
4 & 0.171331 & 1.7805 & 0.038901 \tabularnewline
5 & -0.209758 & -2.1799 & 0.015719 \tabularnewline
6 & 0.322966 & 3.3564 & 0.000545 \tabularnewline
7 & -0.195159 & -2.0281 & 0.022503 \tabularnewline
8 & 0.110317 & 1.1464 & 0.127072 \tabularnewline
9 & 0.005082 & 0.0528 & 0.478989 \tabularnewline
10 & -0.185555 & -1.9283 & 0.028219 \tabularnewline
11 & -0.265832 & -2.7626 & 0.003371 \tabularnewline
12 & 0.824585 & 8.5693 & 0 \tabularnewline
13 & -0.255143 & -2.6515 & 0.004609 \tabularnewline
14 & -0.198249 & -2.0603 & 0.020888 \tabularnewline
15 & 0.012218 & 0.127 & 0.449598 \tabularnewline
16 & 0.155986 & 1.6211 & 0.053961 \tabularnewline
17 & -0.199719 & -2.0755 & 0.020156 \tabularnewline
18 & 0.304429 & 3.1637 & 0.001012 \tabularnewline
19 & -0.164681 & -1.7114 & 0.044937 \tabularnewline
20 & 0.022519 & 0.234 & 0.407706 \tabularnewline
21 & 0.026336 & 0.2737 & 0.392423 \tabularnewline
22 & -0.147058 & -1.5283 & 0.064684 \tabularnewline
23 & -0.211677 & -2.1998 & 0.014976 \tabularnewline
24 & 0.655403 & 6.8111 & 0 \tabularnewline
25 & -0.205366 & -2.1342 & 0.017543 \tabularnewline
26 & -0.226242 & -2.3512 & 0.010264 \tabularnewline
27 & 0.055502 & 0.5768 & 0.282641 \tabularnewline
28 & 0.132652 & 1.3786 & 0.085439 \tabularnewline
29 & -0.175489 & -1.8237 & 0.035479 \tabularnewline
30 & 0.241226 & 2.5069 & 0.006835 \tabularnewline
31 & -0.104761 & -1.0887 & 0.139352 \tabularnewline
32 & -0.026611 & -0.2766 & 0.391327 \tabularnewline
33 & 0.030003 & 0.3118 & 0.377898 \tabularnewline
34 & -0.112768 & -1.1719 & 0.121904 \tabularnewline
35 & -0.173164 & -1.7996 & 0.03736 \tabularnewline
36 & 0.491124 & 5.1039 & 1e-06 \tabularnewline
37 & -0.153383 & -1.594 & 0.056929 \tabularnewline
38 & -0.231291 & -2.4036 & 0.008968 \tabularnewline
39 & 0.086748 & 0.9015 & 0.184662 \tabularnewline
40 & 0.08716 & 0.9058 & 0.18353 \tabularnewline
41 & -0.150288 & -1.5618 & 0.060626 \tabularnewline
42 & 0.154243 & 1.6029 & 0.055934 \tabularnewline
43 & -0.049753 & -0.517 & 0.303092 \tabularnewline
44 & -0.072618 & -0.7547 & 0.226044 \tabularnewline
45 & 0.046716 & 0.4855 & 0.314156 \tabularnewline
46 & -0.085159 & -0.885 & 0.189062 \tabularnewline
47 & -0.142475 & -1.4806 & 0.070807 \tabularnewline
48 & 0.339213 & 3.5252 & 0.000311 \tabularnewline
\hline
\end{tabular}
%Source: https://freestatistics.org/blog/index.php?pk=&T=1

[TABLE]
[ROW][C]Autocorrelation Function[/C][/ROW]
[ROW][C]Time lag k[/C][C]ACF(k)[/C][C]T-STAT[/C][C]P-value[/C][/ROW]
[ROW][C]1[/C][C]-0.288638[/C][C]-2.9996[/C][C]0.001678[/C][/ROW]
[ROW][C]2[/C][C]-0.202921[/C][C]-2.1088[/C][C]0.018636[/C][/ROW]
[ROW][C]3[/C][C]-0.010785[/C][C]-0.1121[/C][C]0.455482[/C][/ROW]
[ROW][C]4[/C][C]0.171331[/C][C]1.7805[/C][C]0.038901[/C][/ROW]
[ROW][C]5[/C][C]-0.209758[/C][C]-2.1799[/C][C]0.015719[/C][/ROW]
[ROW][C]6[/C][C]0.322966[/C][C]3.3564[/C][C]0.000545[/C][/ROW]
[ROW][C]7[/C][C]-0.195159[/C][C]-2.0281[/C][C]0.022503[/C][/ROW]
[ROW][C]8[/C][C]0.110317[/C][C]1.1464[/C][C]0.127072[/C][/ROW]
[ROW][C]9[/C][C]0.005082[/C][C]0.0528[/C][C]0.478989[/C][/ROW]
[ROW][C]10[/C][C]-0.185555[/C][C]-1.9283[/C][C]0.028219[/C][/ROW]
[ROW][C]11[/C][C]-0.265832[/C][C]-2.7626[/C][C]0.003371[/C][/ROW]
[ROW][C]12[/C][C]0.824585[/C][C]8.5693[/C][C]0[/C][/ROW]
[ROW][C]13[/C][C]-0.255143[/C][C]-2.6515[/C][C]0.004609[/C][/ROW]
[ROW][C]14[/C][C]-0.198249[/C][C]-2.0603[/C][C]0.020888[/C][/ROW]
[ROW][C]15[/C][C]0.012218[/C][C]0.127[/C][C]0.449598[/C][/ROW]
[ROW][C]16[/C][C]0.155986[/C][C]1.6211[/C][C]0.053961[/C][/ROW]
[ROW][C]17[/C][C]-0.199719[/C][C]-2.0755[/C][C]0.020156[/C][/ROW]
[ROW][C]18[/C][C]0.304429[/C][C]3.1637[/C][C]0.001012[/C][/ROW]
[ROW][C]19[/C][C]-0.164681[/C][C]-1.7114[/C][C]0.044937[/C][/ROW]
[ROW][C]20[/C][C]0.022519[/C][C]0.234[/C][C]0.407706[/C][/ROW]
[ROW][C]21[/C][C]0.026336[/C][C]0.2737[/C][C]0.392423[/C][/ROW]
[ROW][C]22[/C][C]-0.147058[/C][C]-1.5283[/C][C]0.064684[/C][/ROW]
[ROW][C]23[/C][C]-0.211677[/C][C]-2.1998[/C][C]0.014976[/C][/ROW]
[ROW][C]24[/C][C]0.655403[/C][C]6.8111[/C][C]0[/C][/ROW]
[ROW][C]25[/C][C]-0.205366[/C][C]-2.1342[/C][C]0.017543[/C][/ROW]
[ROW][C]26[/C][C]-0.226242[/C][C]-2.3512[/C][C]0.010264[/C][/ROW]
[ROW][C]27[/C][C]0.055502[/C][C]0.5768[/C][C]0.282641[/C][/ROW]
[ROW][C]28[/C][C]0.132652[/C][C]1.3786[/C][C]0.085439[/C][/ROW]
[ROW][C]29[/C][C]-0.175489[/C][C]-1.8237[/C][C]0.035479[/C][/ROW]
[ROW][C]30[/C][C]0.241226[/C][C]2.5069[/C][C]0.006835[/C][/ROW]
[ROW][C]31[/C][C]-0.104761[/C][C]-1.0887[/C][C]0.139352[/C][/ROW]
[ROW][C]32[/C][C]-0.026611[/C][C]-0.2766[/C][C]0.391327[/C][/ROW]
[ROW][C]33[/C][C]0.030003[/C][C]0.3118[/C][C]0.377898[/C][/ROW]
[ROW][C]34[/C][C]-0.112768[/C][C]-1.1719[/C][C]0.121904[/C][/ROW]
[ROW][C]35[/C][C]-0.173164[/C][C]-1.7996[/C][C]0.03736[/C][/ROW]
[ROW][C]36[/C][C]0.491124[/C][C]5.1039[/C][C]1e-06[/C][/ROW]
[ROW][C]37[/C][C]-0.153383[/C][C]-1.594[/C][C]0.056929[/C][/ROW]
[ROW][C]38[/C][C]-0.231291[/C][C]-2.4036[/C][C]0.008968[/C][/ROW]
[ROW][C]39[/C][C]0.086748[/C][C]0.9015[/C][C]0.184662[/C][/ROW]
[ROW][C]40[/C][C]0.08716[/C][C]0.9058[/C][C]0.18353[/C][/ROW]
[ROW][C]41[/C][C]-0.150288[/C][C]-1.5618[/C][C]0.060626[/C][/ROW]
[ROW][C]42[/C][C]0.154243[/C][C]1.6029[/C][C]0.055934[/C][/ROW]
[ROW][C]43[/C][C]-0.049753[/C][C]-0.517[/C][C]0.303092[/C][/ROW]
[ROW][C]44[/C][C]-0.072618[/C][C]-0.7547[/C][C]0.226044[/C][/ROW]
[ROW][C]45[/C][C]0.046716[/C][C]0.4855[/C][C]0.314156[/C][/ROW]
[ROW][C]46[/C][C]-0.085159[/C][C]-0.885[/C][C]0.189062[/C][/ROW]
[ROW][C]47[/C][C]-0.142475[/C][C]-1.4806[/C][C]0.070807[/C][/ROW]
[ROW][C]48[/C][C]0.339213[/C][C]3.5252[/C][C]0.000311[/C][/ROW]
[/TABLE]
Source: https://freestatistics.org/blog/index.php?pk=&T=1

Globally Unique Identifier (entire table): ba.freestatistics.org/blog/index.php?pk=&T=1

As an alternative you can also use a QR Code:  

The GUIDs for individual cells are displayed in the table below:

Autocorrelation Function
Time lag kACF(k)T-STATP-value
1-0.288638-2.99960.001678
2-0.202921-2.10880.018636
3-0.010785-0.11210.455482
40.1713311.78050.038901
5-0.209758-2.17990.015719
60.3229663.35640.000545
7-0.195159-2.02810.022503
80.1103171.14640.127072
90.0050820.05280.478989
10-0.185555-1.92830.028219
11-0.265832-2.76260.003371
120.8245858.56930
13-0.255143-2.65150.004609
14-0.198249-2.06030.020888
150.0122180.1270.449598
160.1559861.62110.053961
17-0.199719-2.07550.020156
180.3044293.16370.001012
19-0.164681-1.71140.044937
200.0225190.2340.407706
210.0263360.27370.392423
22-0.147058-1.52830.064684
23-0.211677-2.19980.014976
240.6554036.81110
25-0.205366-2.13420.017543
26-0.226242-2.35120.010264
270.0555020.57680.282641
280.1326521.37860.085439
29-0.175489-1.82370.035479
300.2412262.50690.006835
31-0.104761-1.08870.139352
32-0.026611-0.27660.391327
330.0300030.31180.377898
34-0.112768-1.17190.121904
35-0.173164-1.79960.03736
360.4911245.10391e-06
37-0.153383-1.5940.056929
38-0.231291-2.40360.008968
390.0867480.90150.184662
400.087160.90580.18353
41-0.150288-1.56180.060626
420.1542431.60290.055934
43-0.049753-0.5170.303092
44-0.072618-0.75470.226044
450.0467160.48550.314156
46-0.085159-0.8850.189062
47-0.142475-1.48060.070807
480.3392133.52520.000311


Partial Autocorrelation Function
Time lag kPACF(k)T-STATP-value
1-0.288638-2.99960.001678
2-0.312246-3.2450.000782
3-0.214877-2.23310.013803
40.0312050.32430.373171
5-0.216153-2.24630.013359
60.3016163.13450.001109
7-0.083977-0.87270.192377
80.2325632.41690.008665
90.1429071.48510.070211
10-0.277211-2.88090.002392
11-0.383199-3.98236.2e-05
120.6589276.84780
130.0570710.59310.277178
140.0650940.67650.250092
150.1188631.23530.109707
16-0.090737-0.9430.173902
170.0459870.47790.316841
18-0.017358-0.18040.428593
190.0116930.12150.451755
20-0.133278-1.38510.084444
21-0.06438-0.66910.252445
220.0028650.02980.488151
230.0660520.68640.246954
24-0.008659-0.090.464232
250.0641170.66630.253312
26-0.081013-0.84190.20085
270.0285120.29630.383784
280.0096130.09990.460306
290.0028160.02930.488354
30-0.103783-1.07850.141597
310.0045840.04760.481048
320.0561820.58390.280264
33-0.057488-0.59740.275734
340.0604320.6280.265656
35-0.04249-0.44160.329843
36-0.13513-1.40430.081548
37-0.020798-0.21610.414642
38-0.001557-0.01620.493558
390.0014840.01540.493862
40-0.079076-0.82180.206507
41-0.026781-0.27830.390652
42-0.116984-1.21570.113368
43-0.060087-0.62440.266828
44-0.029148-0.30290.38127
45-0.024364-0.25320.4003
46-0.021781-0.22640.410677
47-0.028897-0.30030.382262
48-0.064585-0.67120.251768

\begin{tabular}{lllllllll}
\hline
Partial Autocorrelation Function \tabularnewline
Time lag k & PACF(k) & T-STAT & P-value \tabularnewline
1 & -0.288638 & -2.9996 & 0.001678 \tabularnewline
2 & -0.312246 & -3.245 & 0.000782 \tabularnewline
3 & -0.214877 & -2.2331 & 0.013803 \tabularnewline
4 & 0.031205 & 0.3243 & 0.373171 \tabularnewline
5 & -0.216153 & -2.2463 & 0.013359 \tabularnewline
6 & 0.301616 & 3.1345 & 0.001109 \tabularnewline
7 & -0.083977 & -0.8727 & 0.192377 \tabularnewline
8 & 0.232563 & 2.4169 & 0.008665 \tabularnewline
9 & 0.142907 & 1.4851 & 0.070211 \tabularnewline
10 & -0.277211 & -2.8809 & 0.002392 \tabularnewline
11 & -0.383199 & -3.9823 & 6.2e-05 \tabularnewline
12 & 0.658927 & 6.8478 & 0 \tabularnewline
13 & 0.057071 & 0.5931 & 0.277178 \tabularnewline
14 & 0.065094 & 0.6765 & 0.250092 \tabularnewline
15 & 0.118863 & 1.2353 & 0.109707 \tabularnewline
16 & -0.090737 & -0.943 & 0.173902 \tabularnewline
17 & 0.045987 & 0.4779 & 0.316841 \tabularnewline
18 & -0.017358 & -0.1804 & 0.428593 \tabularnewline
19 & 0.011693 & 0.1215 & 0.451755 \tabularnewline
20 & -0.133278 & -1.3851 & 0.084444 \tabularnewline
21 & -0.06438 & -0.6691 & 0.252445 \tabularnewline
22 & 0.002865 & 0.0298 & 0.488151 \tabularnewline
23 & 0.066052 & 0.6864 & 0.246954 \tabularnewline
24 & -0.008659 & -0.09 & 0.464232 \tabularnewline
25 & 0.064117 & 0.6663 & 0.253312 \tabularnewline
26 & -0.081013 & -0.8419 & 0.20085 \tabularnewline
27 & 0.028512 & 0.2963 & 0.383784 \tabularnewline
28 & 0.009613 & 0.0999 & 0.460306 \tabularnewline
29 & 0.002816 & 0.0293 & 0.488354 \tabularnewline
30 & -0.103783 & -1.0785 & 0.141597 \tabularnewline
31 & 0.004584 & 0.0476 & 0.481048 \tabularnewline
32 & 0.056182 & 0.5839 & 0.280264 \tabularnewline
33 & -0.057488 & -0.5974 & 0.275734 \tabularnewline
34 & 0.060432 & 0.628 & 0.265656 \tabularnewline
35 & -0.04249 & -0.4416 & 0.329843 \tabularnewline
36 & -0.13513 & -1.4043 & 0.081548 \tabularnewline
37 & -0.020798 & -0.2161 & 0.414642 \tabularnewline
38 & -0.001557 & -0.0162 & 0.493558 \tabularnewline
39 & 0.001484 & 0.0154 & 0.493862 \tabularnewline
40 & -0.079076 & -0.8218 & 0.206507 \tabularnewline
41 & -0.026781 & -0.2783 & 0.390652 \tabularnewline
42 & -0.116984 & -1.2157 & 0.113368 \tabularnewline
43 & -0.060087 & -0.6244 & 0.266828 \tabularnewline
44 & -0.029148 & -0.3029 & 0.38127 \tabularnewline
45 & -0.024364 & -0.2532 & 0.4003 \tabularnewline
46 & -0.021781 & -0.2264 & 0.410677 \tabularnewline
47 & -0.028897 & -0.3003 & 0.382262 \tabularnewline
48 & -0.064585 & -0.6712 & 0.251768 \tabularnewline
\hline
\end{tabular}
%Source: https://freestatistics.org/blog/index.php?pk=&T=2

[TABLE]
[ROW][C]Partial Autocorrelation Function[/C][/ROW]
[ROW][C]Time lag k[/C][C]PACF(k)[/C][C]T-STAT[/C][C]P-value[/C][/ROW]
[ROW][C]1[/C][C]-0.288638[/C][C]-2.9996[/C][C]0.001678[/C][/ROW]
[ROW][C]2[/C][C]-0.312246[/C][C]-3.245[/C][C]0.000782[/C][/ROW]
[ROW][C]3[/C][C]-0.214877[/C][C]-2.2331[/C][C]0.013803[/C][/ROW]
[ROW][C]4[/C][C]0.031205[/C][C]0.3243[/C][C]0.373171[/C][/ROW]
[ROW][C]5[/C][C]-0.216153[/C][C]-2.2463[/C][C]0.013359[/C][/ROW]
[ROW][C]6[/C][C]0.301616[/C][C]3.1345[/C][C]0.001109[/C][/ROW]
[ROW][C]7[/C][C]-0.083977[/C][C]-0.8727[/C][C]0.192377[/C][/ROW]
[ROW][C]8[/C][C]0.232563[/C][C]2.4169[/C][C]0.008665[/C][/ROW]
[ROW][C]9[/C][C]0.142907[/C][C]1.4851[/C][C]0.070211[/C][/ROW]
[ROW][C]10[/C][C]-0.277211[/C][C]-2.8809[/C][C]0.002392[/C][/ROW]
[ROW][C]11[/C][C]-0.383199[/C][C]-3.9823[/C][C]6.2e-05[/C][/ROW]
[ROW][C]12[/C][C]0.658927[/C][C]6.8478[/C][C]0[/C][/ROW]
[ROW][C]13[/C][C]0.057071[/C][C]0.5931[/C][C]0.277178[/C][/ROW]
[ROW][C]14[/C][C]0.065094[/C][C]0.6765[/C][C]0.250092[/C][/ROW]
[ROW][C]15[/C][C]0.118863[/C][C]1.2353[/C][C]0.109707[/C][/ROW]
[ROW][C]16[/C][C]-0.090737[/C][C]-0.943[/C][C]0.173902[/C][/ROW]
[ROW][C]17[/C][C]0.045987[/C][C]0.4779[/C][C]0.316841[/C][/ROW]
[ROW][C]18[/C][C]-0.017358[/C][C]-0.1804[/C][C]0.428593[/C][/ROW]
[ROW][C]19[/C][C]0.011693[/C][C]0.1215[/C][C]0.451755[/C][/ROW]
[ROW][C]20[/C][C]-0.133278[/C][C]-1.3851[/C][C]0.084444[/C][/ROW]
[ROW][C]21[/C][C]-0.06438[/C][C]-0.6691[/C][C]0.252445[/C][/ROW]
[ROW][C]22[/C][C]0.002865[/C][C]0.0298[/C][C]0.488151[/C][/ROW]
[ROW][C]23[/C][C]0.066052[/C][C]0.6864[/C][C]0.246954[/C][/ROW]
[ROW][C]24[/C][C]-0.008659[/C][C]-0.09[/C][C]0.464232[/C][/ROW]
[ROW][C]25[/C][C]0.064117[/C][C]0.6663[/C][C]0.253312[/C][/ROW]
[ROW][C]26[/C][C]-0.081013[/C][C]-0.8419[/C][C]0.20085[/C][/ROW]
[ROW][C]27[/C][C]0.028512[/C][C]0.2963[/C][C]0.383784[/C][/ROW]
[ROW][C]28[/C][C]0.009613[/C][C]0.0999[/C][C]0.460306[/C][/ROW]
[ROW][C]29[/C][C]0.002816[/C][C]0.0293[/C][C]0.488354[/C][/ROW]
[ROW][C]30[/C][C]-0.103783[/C][C]-1.0785[/C][C]0.141597[/C][/ROW]
[ROW][C]31[/C][C]0.004584[/C][C]0.0476[/C][C]0.481048[/C][/ROW]
[ROW][C]32[/C][C]0.056182[/C][C]0.5839[/C][C]0.280264[/C][/ROW]
[ROW][C]33[/C][C]-0.057488[/C][C]-0.5974[/C][C]0.275734[/C][/ROW]
[ROW][C]34[/C][C]0.060432[/C][C]0.628[/C][C]0.265656[/C][/ROW]
[ROW][C]35[/C][C]-0.04249[/C][C]-0.4416[/C][C]0.329843[/C][/ROW]
[ROW][C]36[/C][C]-0.13513[/C][C]-1.4043[/C][C]0.081548[/C][/ROW]
[ROW][C]37[/C][C]-0.020798[/C][C]-0.2161[/C][C]0.414642[/C][/ROW]
[ROW][C]38[/C][C]-0.001557[/C][C]-0.0162[/C][C]0.493558[/C][/ROW]
[ROW][C]39[/C][C]0.001484[/C][C]0.0154[/C][C]0.493862[/C][/ROW]
[ROW][C]40[/C][C]-0.079076[/C][C]-0.8218[/C][C]0.206507[/C][/ROW]
[ROW][C]41[/C][C]-0.026781[/C][C]-0.2783[/C][C]0.390652[/C][/ROW]
[ROW][C]42[/C][C]-0.116984[/C][C]-1.2157[/C][C]0.113368[/C][/ROW]
[ROW][C]43[/C][C]-0.060087[/C][C]-0.6244[/C][C]0.266828[/C][/ROW]
[ROW][C]44[/C][C]-0.029148[/C][C]-0.3029[/C][C]0.38127[/C][/ROW]
[ROW][C]45[/C][C]-0.024364[/C][C]-0.2532[/C][C]0.4003[/C][/ROW]
[ROW][C]46[/C][C]-0.021781[/C][C]-0.2264[/C][C]0.410677[/C][/ROW]
[ROW][C]47[/C][C]-0.028897[/C][C]-0.3003[/C][C]0.382262[/C][/ROW]
[ROW][C]48[/C][C]-0.064585[/C][C]-0.6712[/C][C]0.251768[/C][/ROW]
[/TABLE]
Source: https://freestatistics.org/blog/index.php?pk=&T=2

Globally Unique Identifier (entire table): ba.freestatistics.org/blog/index.php?pk=&T=2

As an alternative you can also use a QR Code:  

The GUIDs for individual cells are displayed in the table below:

Partial Autocorrelation Function
Time lag kPACF(k)T-STATP-value
1-0.288638-2.99960.001678
2-0.312246-3.2450.000782
3-0.214877-2.23310.013803
40.0312050.32430.373171
5-0.216153-2.24630.013359
60.3016163.13450.001109
7-0.083977-0.87270.192377
80.2325632.41690.008665
90.1429071.48510.070211
10-0.277211-2.88090.002392
11-0.383199-3.98236.2e-05
120.6589276.84780
130.0570710.59310.277178
140.0650940.67650.250092
150.1188631.23530.109707
16-0.090737-0.9430.173902
170.0459870.47790.316841
18-0.017358-0.18040.428593
190.0116930.12150.451755
20-0.133278-1.38510.084444
21-0.06438-0.66910.252445
220.0028650.02980.488151
230.0660520.68640.246954
24-0.008659-0.090.464232
250.0641170.66630.253312
26-0.081013-0.84190.20085
270.0285120.29630.383784
280.0096130.09990.460306
290.0028160.02930.488354
30-0.103783-1.07850.141597
310.0045840.04760.481048
320.0561820.58390.280264
33-0.057488-0.59740.275734
340.0604320.6280.265656
35-0.04249-0.44160.329843
36-0.13513-1.40430.081548
37-0.020798-0.21610.414642
38-0.001557-0.01620.493558
390.0014840.01540.493862
40-0.079076-0.82180.206507
41-0.026781-0.27830.390652
42-0.116984-1.21570.113368
43-0.060087-0.62440.266828
44-0.029148-0.30290.38127
45-0.024364-0.25320.4003
46-0.021781-0.22640.410677
47-0.028897-0.30030.382262
48-0.064585-0.67120.251768


Parameters (Session):
par1 = 48 ; par2 = 1 ; par3 = 0 ; par4 = 0 ; par5 = 12 ; par6 = White Noise ; par7 = 0.95 ;
Parameters (R input):
par1 = 48 ; par2 = 1 ; par3 = 0 ; par4 = 0 ; par5 = 12 ; par6 = White Noise ; par7 = 0.95 ; par8 = ;
R code (references can be found in the software module):
if (par1 == 'Default') {
par1 = 10*log10(length(x))
} else {
par1 <- as.numeric(par1)
}
par2 <- as.numeric(par2)
par3 <- as.numeric(par3)
par4 <- as.numeric(par4)
par5 <- as.numeric(par5)
if (par6 == 'White Noise') par6 <- 'white' else par6 <- 'ma'
par7 <- as.numeric(par7)
if (par8 != '') par8 <- as.numeric(par8)
x <- na.omit(x)
ox <- x
if (par8 == '') {
if (par2 == 0) {
x <- log(x)
} else {
x <- (x ^ par2 - 1) / par2
}
} else {
x <- log(x,base=par8)
}
if (par3 > 0) x <- diff(x,lag=1,difference=par3)
if (par4 > 0) x <- diff(x,lag=par5,difference=par4)
bitmap(file='picts.png')
op <- par(mfrow=c(2,1))
plot(ox,type='l',main='Original Time Series',xlab='time',ylab='value')
if (par8=='') {
mytitle <- paste('Working Time Series (lambda=',par2,', d=',par3,', D=',par4,')',sep='')
mysub <- paste('(lambda=',par2,', d=',par3,', D=',par4,', CI=', par7, ', CI type=',par6,')',sep='')
} else {
mytitle <- paste('Working Time Series (base=',par8,', d=',par3,', D=',par4,')',sep='')
mysub <- paste('(base=',par8,', d=',par3,', D=',par4,', CI=', par7, ', CI type=',par6,')',sep='')
}
plot(x,type='l', main=mytitle,xlab='time',ylab='value')
par(op)
dev.off()
bitmap(file='pic1.png')
racf <- acf(x, par1, main='Autocorrelation', xlab='time lag', ylab='ACF', ci.type=par6, ci=par7, sub=mysub)
dev.off()
bitmap(file='pic2.png')
rpacf <- pacf(x,par1,main='Partial Autocorrelation',xlab='lags',ylab='PACF',sub=mysub)
dev.off()
(myacf <- c(racf$acf))
(mypacf <- c(rpacf$acf))
lengthx <- length(x)
sqrtn <- sqrt(lengthx)
load(file='createtable')
a<-table.start()
a<-table.row.start(a)
a<-table.element(a,'Autocorrelation Function',4,TRUE)
a<-table.row.end(a)
a<-table.row.start(a)
a<-table.element(a,'Time lag k',header=TRUE)
a<-table.element(a,hyperlink('basics.htm','ACF(k)','click here for more information about the Autocorrelation Function'),header=TRUE)
a<-table.element(a,'T-STAT',header=TRUE)
a<-table.element(a,'P-value',header=TRUE)
a<-table.row.end(a)
for (i in 2:(par1+1)) {
a<-table.row.start(a)
a<-table.element(a,i-1,header=TRUE)
a<-table.element(a,round(myacf[i],6))
mytstat <- myacf[i]*sqrtn
a<-table.element(a,round(mytstat,4))
a<-table.element(a,round(1-pt(abs(mytstat),lengthx),6))
a<-table.row.end(a)
}
a<-table.end(a)
table.save(a,file='mytable.tab')
a<-table.start()
a<-table.row.start(a)
a<-table.element(a,'Partial Autocorrelation Function',4,TRUE)
a<-table.row.end(a)
a<-table.row.start(a)
a<-table.element(a,'Time lag k',header=TRUE)
a<-table.element(a,hyperlink('basics.htm','PACF(k)','click here for more information about the Partial Autocorrelation Function'),header=TRUE)
a<-table.element(a,'T-STAT',header=TRUE)
a<-table.element(a,'P-value',header=TRUE)
a<-table.row.end(a)
for (i in 1:par1) {
a<-table.row.start(a)
a<-table.element(a,i,header=TRUE)
a<-table.element(a,round(mypacf[i],6))
mytstat <- mypacf[i]*sqrtn
a<-table.element(a,round(mytstat,4))
a<-table.element(a,round(1-pt(abs(mytstat),lengthx),6))
a<-table.row.end(a)
}
a<-table.end(a)
table.save(a,file='mytable1.tab')