Free Statistics

of Irreproducible Research!

Author's title

Author*Unverified author*
R Software Modulerwasp_smp.wasp
Title produced by softwareStandard Deviation-Mean Plot
Date of computationMon, 15 Aug 2016 19:30:45 +0100
Cite this page as followsStatistical Computations at FreeStatistics.org, Office for Research Development and Education, URL https://freestatistics.org/blog/index.php?v=date/2016/Aug/15/t14712858752z79mnj90q9moi0.htm/, Retrieved Sun, 28 Apr 2024 14:30:33 +0200
Statistical Computations at FreeStatistics.org, Office for Research Development and Education, URL https://freestatistics.org/blog/index.php?pk=, Retrieved Sun, 28 Apr 2024 14:30:33 +0200
QR Codes:

Original text written by user:
IsPrivate?No (this computation is public)
User-defined keywords
Estimated Impact0
Dataseries X:
1230
1360
1360
1250
1420
1390
1280
1330
1400
1370
1290
1500
1260
1360
1320
1300
1440
1360
1330
1420
1510
1280
1310
1460
1280
1370
1390
1390
1460
1410
1230
1260
1590
1250
1400
1450
1220
1290
1400
1400
1460
1450
1270
1260
1550
1230
1380
1490
1180
1190
1400
1380
1510
1400
1290
1200
1600
1220
1380
1450
1260
1130
1390
1380
1570
1320
1210
1190
1580
1150
1330
1420
1260
1040
1450
1360
1500
1240
1260
1220
1680
1210
1350
1480
1270
1040
1450
1310
1510
1160
1290
1230
1680
1190
1310
1480
1320
1050
1380
1320
1480
1150
1250
1260
1680
1150
1310
1470


Summary of computational transaction
Raw Inputview raw input (R code)
Raw Outputview raw output of R engine
Computing time1 seconds
R Server'Sir Maurice George Kendall' @ kendall.wessa.net

\begin{tabular}{lllllllll}
\hline
Summary of computational transaction \tabularnewline
Raw Input & view raw input (R code)  \tabularnewline
Raw Output & view raw output of R engine  \tabularnewline
Computing time & 1 seconds \tabularnewline
R Server & 'Sir Maurice George Kendall' @ kendall.wessa.net \tabularnewline
\hline
\end{tabular}
%Source: https://freestatistics.org/blog/index.php?pk=&T=0

[TABLE]
[ROW][C]Summary of computational transaction[/C][/ROW]
[ROW][C]Raw Input[/C][C]view raw input (R code) [/C][/ROW]
[ROW][C]Raw Output[/C][C]view raw output of R engine [/C][/ROW]
[ROW][C]Computing time[/C][C]1 seconds[/C][/ROW]
[ROW][C]R Server[/C][C]'Sir Maurice George Kendall' @ kendall.wessa.net[/C][/ROW]
[/TABLE]
Source: https://freestatistics.org/blog/index.php?pk=&T=0

Globally Unique Identifier (entire table): ba.freestatistics.org/blog/index.php?pk=&T=0

As an alternative you can also use a QR Code:  

The GUIDs for individual cells are displayed in the table below:

Summary of computational transaction
Raw Inputview raw input (R code)
Raw Outputview raw output of R engine
Computing time1 seconds
R Server'Sir Maurice George Kendall' @ kendall.wessa.net


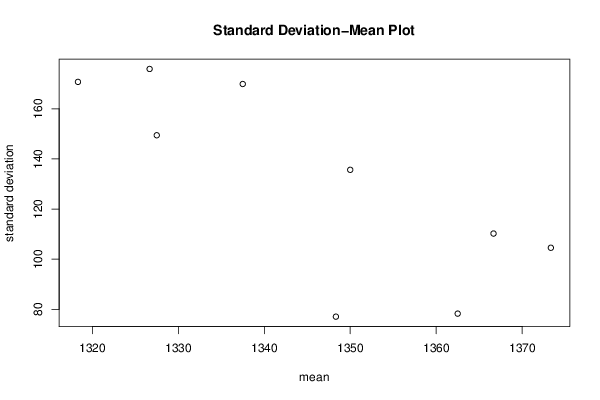
Standard Deviation-Mean Plot
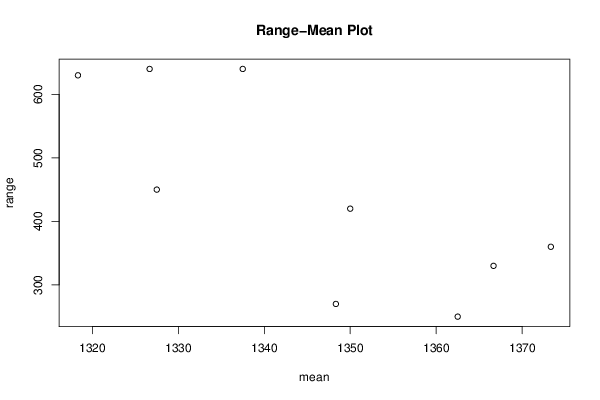
SectionMeanStandard DeviationRange
11348.3333333333377.0871211190575270
21362.578.2914136706284250
31373.33333333333104.562580942387360
41366.66666666667110.233911077831330
51350135.646599662505420
61327.5149.430737984343450
71337.5169.872947174699640
81326.66666666667175.878746110306640
91318.33333333333170.711523461143630

\begin{tabular}{lllllllll}
\hline
Standard Deviation-Mean Plot \tabularnewline
Section & Mean & Standard Deviation & Range \tabularnewline
1 & 1348.33333333333 & 77.0871211190575 & 270 \tabularnewline
2 & 1362.5 & 78.2914136706284 & 250 \tabularnewline
3 & 1373.33333333333 & 104.562580942387 & 360 \tabularnewline
4 & 1366.66666666667 & 110.233911077831 & 330 \tabularnewline
5 & 1350 & 135.646599662505 & 420 \tabularnewline
6 & 1327.5 & 149.430737984343 & 450 \tabularnewline
7 & 1337.5 & 169.872947174699 & 640 \tabularnewline
8 & 1326.66666666667 & 175.878746110306 & 640 \tabularnewline
9 & 1318.33333333333 & 170.711523461143 & 630 \tabularnewline
\hline
\end{tabular}
%Source: https://freestatistics.org/blog/index.php?pk=&T=1

[TABLE]
[ROW][C]Standard Deviation-Mean Plot[/C][/ROW]
[ROW][C]Section[/C][C]Mean[/C][C]Standard Deviation[/C][C]Range[/C][/ROW]
[ROW][C]1[/C][C]1348.33333333333[/C][C]77.0871211190575[/C][C]270[/C][/ROW]
[ROW][C]2[/C][C]1362.5[/C][C]78.2914136706284[/C][C]250[/C][/ROW]
[ROW][C]3[/C][C]1373.33333333333[/C][C]104.562580942387[/C][C]360[/C][/ROW]
[ROW][C]4[/C][C]1366.66666666667[/C][C]110.233911077831[/C][C]330[/C][/ROW]
[ROW][C]5[/C][C]1350[/C][C]135.646599662505[/C][C]420[/C][/ROW]
[ROW][C]6[/C][C]1327.5[/C][C]149.430737984343[/C][C]450[/C][/ROW]
[ROW][C]7[/C][C]1337.5[/C][C]169.872947174699[/C][C]640[/C][/ROW]
[ROW][C]8[/C][C]1326.66666666667[/C][C]175.878746110306[/C][C]640[/C][/ROW]
[ROW][C]9[/C][C]1318.33333333333[/C][C]170.711523461143[/C][C]630[/C][/ROW]
[/TABLE]
Source: https://freestatistics.org/blog/index.php?pk=&T=1

Globally Unique Identifier (entire table): ba.freestatistics.org/blog/index.php?pk=&T=1

As an alternative you can also use a QR Code:  

The GUIDs for individual cells are displayed in the table below:

Standard Deviation-Mean Plot
SectionMeanStandard DeviationRange
11348.3333333333377.0871211190575270
21362.578.2914136706284250
31373.33333333333104.562580942387360
41366.66666666667110.233911077831330
51350135.646599662505420
61327.5149.430737984343450
71337.5169.872947174699640
81326.66666666667175.878746110306640
91318.33333333333170.711523461143630


Regression: S.E.(k) = alpha + beta * Mean(k)
alpha2254.77975753173
beta-1.5788593328218
S.D.0.473627234679565
T-STAT-3.3335484474198
p-value0.0125299615141799

\begin{tabular}{lllllllll}
\hline
Regression: S.E.(k) = alpha + beta * Mean(k) \tabularnewline
alpha & 2254.77975753173 \tabularnewline
beta & -1.5788593328218 \tabularnewline
S.D. & 0.473627234679565 \tabularnewline
T-STAT & -3.3335484474198 \tabularnewline
p-value & 0.0125299615141799 \tabularnewline
\hline
\end{tabular}
%Source: https://freestatistics.org/blog/index.php?pk=&T=2

[TABLE]
[ROW][C]Regression: S.E.(k) = alpha + beta * Mean(k)[/C][/ROW]
[ROW][C]alpha[/C][C]2254.77975753173[/C][/ROW]
[ROW][C]beta[/C][C]-1.5788593328218[/C][/ROW]
[ROW][C]S.D.[/C][C]0.473627234679565[/C][/ROW]
[ROW][C]T-STAT[/C][C]-3.3335484474198[/C][/ROW]
[ROW][C]p-value[/C][C]0.0125299615141799[/C][/ROW]
[/TABLE]
Source: https://freestatistics.org/blog/index.php?pk=&T=2

Globally Unique Identifier (entire table): ba.freestatistics.org/blog/index.php?pk=&T=2

As an alternative you can also use a QR Code:  

The GUIDs for individual cells are displayed in the table below:

Regression: S.E.(k) = alpha + beta * Mean(k)
alpha2254.77975753173
beta-1.5788593328218
S.D.0.473627234679565
T-STAT-3.3335484474198
p-value0.0125299615141799


Regression: ln S.E.(k) = alpha + beta * ln Mean(k)
alpha124.221374905767
beta-16.5724689666307
S.D.5.76808645798034
T-STAT-2.87313116531084
p-value0.0238848635177994
Lambda17.5724689666307

\begin{tabular}{lllllllll}
\hline
Regression: ln S.E.(k) = alpha + beta * ln Mean(k) \tabularnewline
alpha & 124.221374905767 \tabularnewline
beta & -16.5724689666307 \tabularnewline
S.D. & 5.76808645798034 \tabularnewline
T-STAT & -2.87313116531084 \tabularnewline
p-value & 0.0238848635177994 \tabularnewline
Lambda & 17.5724689666307 \tabularnewline
\hline
\end{tabular}
%Source: https://freestatistics.org/blog/index.php?pk=&T=3

[TABLE]
[ROW][C]Regression: ln S.E.(k) = alpha + beta * ln Mean(k)[/C][/ROW]
[ROW][C]alpha[/C][C]124.221374905767[/C][/ROW]
[ROW][C]beta[/C][C]-16.5724689666307[/C][/ROW]
[ROW][C]S.D.[/C][C]5.76808645798034[/C][/ROW]
[ROW][C]T-STAT[/C][C]-2.87313116531084[/C][/ROW]
[ROW][C]p-value[/C][C]0.0238848635177994[/C][/ROW]
[ROW][C]Lambda[/C][C]17.5724689666307[/C][/ROW]
[/TABLE]
Source: https://freestatistics.org/blog/index.php?pk=&T=3

Globally Unique Identifier (entire table): ba.freestatistics.org/blog/index.php?pk=&T=3

As an alternative you can also use a QR Code:  

The GUIDs for individual cells are displayed in the table below:

Regression: ln S.E.(k) = alpha + beta * ln Mean(k)
alpha124.221374905767
beta-16.5724689666307
S.D.5.76808645798034
T-STAT-2.87313116531084
p-value0.0238848635177994
Lambda17.5724689666307


Parameters (Session):
Parameters (R input):
par1 = 12 ;
R code (references can be found in the software module):
par1 <- as.numeric(par1)
(n <- length(x))
(np <- floor(n / par1))
arr <- array(NA,dim=c(par1,np))
j <- 0
k <- 1
for (i in 1:(np*par1))
{
j = j + 1
arr[j,k] <- x[i]
if (j == par1) {
j = 0
k=k+1
}
}
arr
arr.mean <- array(NA,dim=np)
arr.sd <- array(NA,dim=np)
arr.range <- array(NA,dim=np)
for (j in 1:np)
{
arr.mean[j] <- mean(arr[,j],na.rm=TRUE)
arr.sd[j] <- sd(arr[,j],na.rm=TRUE)
arr.range[j] <- max(arr[,j],na.rm=TRUE) - min(arr[,j],na.rm=TRUE)
}
arr.mean
arr.sd
arr.range
(lm1 <- lm(arr.sd~arr.mean))
(lnlm1 <- lm(log(arr.sd)~log(arr.mean)))
(lm2 <- lm(arr.range~arr.mean))
bitmap(file='test1.png')
plot(arr.mean,arr.sd,main='Standard Deviation-Mean Plot',xlab='mean',ylab='standard deviation')
dev.off()
bitmap(file='test2.png')
plot(arr.mean,arr.range,main='Range-Mean Plot',xlab='mean',ylab='range')
dev.off()
load(file='createtable')
a<-table.start()
a<-table.row.start(a)
a<-table.element(a,'Standard Deviation-Mean Plot',4,TRUE)
a<-table.row.end(a)
a<-table.row.start(a)
a<-table.element(a,'Section',header=TRUE)
a<-table.element(a,'Mean',header=TRUE)
a<-table.element(a,'Standard Deviation',header=TRUE)
a<-table.element(a,'Range',header=TRUE)
a<-table.row.end(a)
for (j in 1:np) {
a<-table.row.start(a)
a<-table.element(a,j,header=TRUE)
a<-table.element(a,arr.mean[j])
a<-table.element(a,arr.sd[j] )
a<-table.element(a,arr.range[j] )
a<-table.row.end(a)
}
a<-table.end(a)
table.save(a,file='mytable.tab')
a<-table.start()
a<-table.row.start(a)
a<-table.element(a,'Regression: S.E.(k) = alpha + beta * Mean(k)',2,TRUE)
a<-table.row.end(a)
a<-table.row.start(a)
a<-table.element(a,'alpha',header=TRUE)
a<-table.element(a,lm1$coefficients[[1]])
a<-table.row.end(a)
a<-table.row.start(a)
a<-table.element(a,'beta',header=TRUE)
a<-table.element(a,lm1$coefficients[[2]])
a<-table.row.end(a)
a<-table.row.start(a)
a<-table.element(a,'S.D.',header=TRUE)
a<-table.element(a,summary(lm1)$coefficients[2,2])
a<-table.row.end(a)
a<-table.row.start(a)
a<-table.element(a,'T-STAT',header=TRUE)
a<-table.element(a,summary(lm1)$coefficients[2,3])
a<-table.row.end(a)
a<-table.row.start(a)
a<-table.element(a,'p-value',header=TRUE)
a<-table.element(a,summary(lm1)$coefficients[2,4])
a<-table.row.end(a)
a<-table.end(a)
table.save(a,file='mytable1.tab')
a<-table.start()
a<-table.row.start(a)
a<-table.element(a,'Regression: ln S.E.(k) = alpha + beta * ln Mean(k)',2,TRUE)
a<-table.row.end(a)
a<-table.row.start(a)
a<-table.element(a,'alpha',header=TRUE)
a<-table.element(a,lnlm1$coefficients[[1]])
a<-table.row.end(a)
a<-table.row.start(a)
a<-table.element(a,'beta',header=TRUE)
a<-table.element(a,lnlm1$coefficients[[2]])
a<-table.row.end(a)
a<-table.row.start(a)
a<-table.element(a,'S.D.',header=TRUE)
a<-table.element(a,summary(lnlm1)$coefficients[2,2])
a<-table.row.end(a)
a<-table.row.start(a)
a<-table.element(a,'T-STAT',header=TRUE)
a<-table.element(a,summary(lnlm1)$coefficients[2,3])
a<-table.row.end(a)
a<-table.row.start(a)
a<-table.element(a,'p-value',header=TRUE)
a<-table.element(a,summary(lnlm1)$coefficients[2,4])
a<-table.row.end(a)
a<-table.row.start(a)
a<-table.element(a,'Lambda',header=TRUE)
a<-table.element(a,1-lnlm1$coefficients[[2]])
a<-table.row.end(a)
a<-table.end(a)
table.save(a,file='mytable2.tab')