Free Statistics

of Irreproducible Research!

Author's title

Author*Unverified author*
R Software Modulerwasp_autocorrelation.wasp
Title produced by software(Partial) Autocorrelation Function
Date of computationMon, 15 Aug 2016 21:28:34 +0100
Cite this page as followsStatistical Computations at FreeStatistics.org, Office for Research Development and Education, URL https://freestatistics.org/blog/index.php?v=date/2016/Aug/15/t1471293034ybmhyfhv6cp6wb5.htm/, Retrieved Sun, 28 Apr 2024 09:49:28 +0200
Statistical Computations at FreeStatistics.org, Office for Research Development and Education, URL https://freestatistics.org/blog/index.php?pk=, Retrieved Sun, 28 Apr 2024 09:49:28 +0200
QR Codes:

Original text written by user:
IsPrivate?No (this computation is public)
User-defined keywords
Estimated Impact0
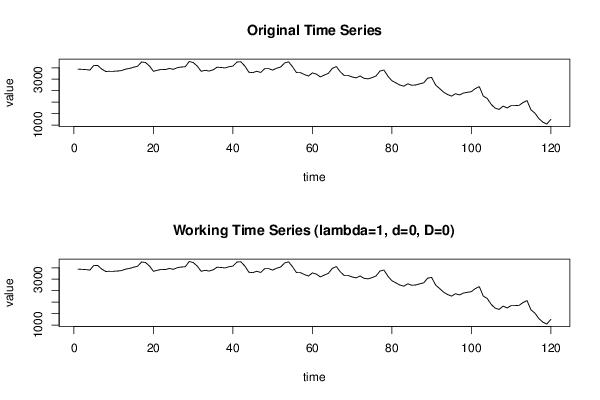
Dataseries X:
3441
3431
3420
3400
3606
3596
3441
3338
3348
3348
3358
3379
3441
3472
3524
3565
3751
3730
3575
3348
3389
3431
3420
3472
3431
3503
3534
3544
3772
3730
3575
3348
3389
3358
3410
3524
3513
3493
3544
3575
3751
3761
3575
3307
3286
3348
3296
3462
3462
3400
3482
3534
3710
3761
3544
3286
3286
3203
3141
3276
3224
3100
3183
3255
3472
3555
3327
3162
3162
3100
3059
3141
3038
3017
3069
3141
3358
3400
3131
2935
2842
2749
2697
2800
2738
2749
2800
2842
3048
3079
2749
2594
2439
2335
2263
2366
2315
2397
2428
2459
2594
2676
2263
2160
1901
1736
1684
1829
1746
1850
1850
1860
1984
2067
1664
1519
1281
1126
1044
1250


Summary of computational transaction
Raw Inputview raw input (R code)
Raw Outputview raw output of R engine
Computing time1 seconds
R Server'George Udny Yule' @ yule.wessa.net

\begin{tabular}{lllllllll}
\hline
Summary of computational transaction \tabularnewline
Raw Input & view raw input (R code)  \tabularnewline
Raw Output & view raw output of R engine  \tabularnewline
Computing time & 1 seconds \tabularnewline
R Server & 'George Udny Yule' @ yule.wessa.net \tabularnewline
\hline
\end{tabular}
%Source: https://freestatistics.org/blog/index.php?pk=&T=0

[TABLE]
[ROW][C]Summary of computational transaction[/C][/ROW]
[ROW][C]Raw Input[/C][C]view raw input (R code) [/C][/ROW]
[ROW][C]Raw Output[/C][C]view raw output of R engine [/C][/ROW]
[ROW][C]Computing time[/C][C]1 seconds[/C][/ROW]
[ROW][C]R Server[/C][C]'George Udny Yule' @ yule.wessa.net[/C][/ROW]
[/TABLE]
Source: https://freestatistics.org/blog/index.php?pk=&T=0

Globally Unique Identifier (entire table): ba.freestatistics.org/blog/index.php?pk=&T=0

As an alternative you can also use a QR Code:  

The GUIDs for individual cells are displayed in the table below:

Summary of computational transaction
Raw Inputview raw input (R code)
Raw Outputview raw output of R engine
Computing time1 seconds
R Server'George Udny Yule' @ yule.wessa.net


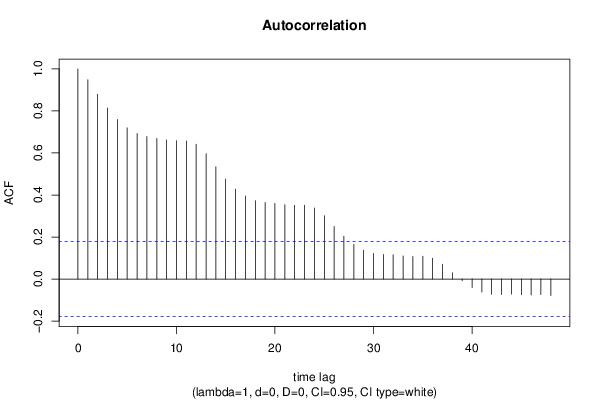
Autocorrelation Function
Time lag kACF(k)T-STATP-value
10.9487810.39340
20.8794379.63370
30.8144968.92240
40.759718.32220
50.7196057.88290
60.6930657.59210
70.6787957.43580
80.6691287.32990
90.661737.24890
100.6585317.21380
110.6572877.20020
120.6419147.03180
130.5961696.53070
140.5345535.85570
150.4758525.21270
160.4273864.68184e-06
170.395084.32791.6e-05
180.3731024.08714e-05
190.3645053.99295.6e-05
200.359283.93577e-05
210.3535583.8738.8e-05
220.351013.84519.7e-05
230.351063.84579.7e-05
240.3383613.70660.00016
250.3011093.29850.00064
260.2504112.74310.00351
270.2034642.22880.013843
280.1641751.79840.03731
290.1373911.5050.067471
300.1215841.33190.092712
310.116941.2810.10133
320.1154991.26520.10412
330.1099531.20450.115387
340.1078051.18090.119979
350.1082231.18550.119077
360.0987171.08140.140845
370.070150.76850.221863
380.0300690.32940.371219
39-0.007877-0.08630.465692
40-0.039852-0.43660.331609
41-0.061316-0.67170.251539
42-0.072496-0.79420.214336
43-0.073227-0.80220.212021
44-0.071591-0.78420.217222
45-0.07485-0.81990.206937
46-0.076155-0.83420.202902
47-0.073331-0.80330.211695
48-0.078497-0.85990.195782

\begin{tabular}{lllllllll}
\hline
Autocorrelation Function \tabularnewline
Time lag k & ACF(k) & T-STAT & P-value \tabularnewline
1 & 0.94878 & 10.3934 & 0 \tabularnewline
2 & 0.879437 & 9.6337 & 0 \tabularnewline
3 & 0.814496 & 8.9224 & 0 \tabularnewline
4 & 0.75971 & 8.3222 & 0 \tabularnewline
5 & 0.719605 & 7.8829 & 0 \tabularnewline
6 & 0.693065 & 7.5921 & 0 \tabularnewline
7 & 0.678795 & 7.4358 & 0 \tabularnewline
8 & 0.669128 & 7.3299 & 0 \tabularnewline
9 & 0.66173 & 7.2489 & 0 \tabularnewline
10 & 0.658531 & 7.2138 & 0 \tabularnewline
11 & 0.657287 & 7.2002 & 0 \tabularnewline
12 & 0.641914 & 7.0318 & 0 \tabularnewline
13 & 0.596169 & 6.5307 & 0 \tabularnewline
14 & 0.534553 & 5.8557 & 0 \tabularnewline
15 & 0.475852 & 5.2127 & 0 \tabularnewline
16 & 0.427386 & 4.6818 & 4e-06 \tabularnewline
17 & 0.39508 & 4.3279 & 1.6e-05 \tabularnewline
18 & 0.373102 & 4.0871 & 4e-05 \tabularnewline
19 & 0.364505 & 3.9929 & 5.6e-05 \tabularnewline
20 & 0.35928 & 3.9357 & 7e-05 \tabularnewline
21 & 0.353558 & 3.873 & 8.8e-05 \tabularnewline
22 & 0.35101 & 3.8451 & 9.7e-05 \tabularnewline
23 & 0.35106 & 3.8457 & 9.7e-05 \tabularnewline
24 & 0.338361 & 3.7066 & 0.00016 \tabularnewline
25 & 0.301109 & 3.2985 & 0.00064 \tabularnewline
26 & 0.250411 & 2.7431 & 0.00351 \tabularnewline
27 & 0.203464 & 2.2288 & 0.013843 \tabularnewline
28 & 0.164175 & 1.7984 & 0.03731 \tabularnewline
29 & 0.137391 & 1.505 & 0.067471 \tabularnewline
30 & 0.121584 & 1.3319 & 0.092712 \tabularnewline
31 & 0.11694 & 1.281 & 0.10133 \tabularnewline
32 & 0.115499 & 1.2652 & 0.10412 \tabularnewline
33 & 0.109953 & 1.2045 & 0.115387 \tabularnewline
34 & 0.107805 & 1.1809 & 0.119979 \tabularnewline
35 & 0.108223 & 1.1855 & 0.119077 \tabularnewline
36 & 0.098717 & 1.0814 & 0.140845 \tabularnewline
37 & 0.07015 & 0.7685 & 0.221863 \tabularnewline
38 & 0.030069 & 0.3294 & 0.371219 \tabularnewline
39 & -0.007877 & -0.0863 & 0.465692 \tabularnewline
40 & -0.039852 & -0.4366 & 0.331609 \tabularnewline
41 & -0.061316 & -0.6717 & 0.251539 \tabularnewline
42 & -0.072496 & -0.7942 & 0.214336 \tabularnewline
43 & -0.073227 & -0.8022 & 0.212021 \tabularnewline
44 & -0.071591 & -0.7842 & 0.217222 \tabularnewline
45 & -0.07485 & -0.8199 & 0.206937 \tabularnewline
46 & -0.076155 & -0.8342 & 0.202902 \tabularnewline
47 & -0.073331 & -0.8033 & 0.211695 \tabularnewline
48 & -0.078497 & -0.8599 & 0.195782 \tabularnewline
\hline
\end{tabular}
%Source: https://freestatistics.org/blog/index.php?pk=&T=1

[TABLE]
[ROW][C]Autocorrelation Function[/C][/ROW]
[ROW][C]Time lag k[/C][C]ACF(k)[/C][C]T-STAT[/C][C]P-value[/C][/ROW]
[ROW][C]1[/C][C]0.94878[/C][C]10.3934[/C][C]0[/C][/ROW]
[ROW][C]2[/C][C]0.879437[/C][C]9.6337[/C][C]0[/C][/ROW]
[ROW][C]3[/C][C]0.814496[/C][C]8.9224[/C][C]0[/C][/ROW]
[ROW][C]4[/C][C]0.75971[/C][C]8.3222[/C][C]0[/C][/ROW]
[ROW][C]5[/C][C]0.719605[/C][C]7.8829[/C][C]0[/C][/ROW]
[ROW][C]6[/C][C]0.693065[/C][C]7.5921[/C][C]0[/C][/ROW]
[ROW][C]7[/C][C]0.678795[/C][C]7.4358[/C][C]0[/C][/ROW]
[ROW][C]8[/C][C]0.669128[/C][C]7.3299[/C][C]0[/C][/ROW]
[ROW][C]9[/C][C]0.66173[/C][C]7.2489[/C][C]0[/C][/ROW]
[ROW][C]10[/C][C]0.658531[/C][C]7.2138[/C][C]0[/C][/ROW]
[ROW][C]11[/C][C]0.657287[/C][C]7.2002[/C][C]0[/C][/ROW]
[ROW][C]12[/C][C]0.641914[/C][C]7.0318[/C][C]0[/C][/ROW]
[ROW][C]13[/C][C]0.596169[/C][C]6.5307[/C][C]0[/C][/ROW]
[ROW][C]14[/C][C]0.534553[/C][C]5.8557[/C][C]0[/C][/ROW]
[ROW][C]15[/C][C]0.475852[/C][C]5.2127[/C][C]0[/C][/ROW]
[ROW][C]16[/C][C]0.427386[/C][C]4.6818[/C][C]4e-06[/C][/ROW]
[ROW][C]17[/C][C]0.39508[/C][C]4.3279[/C][C]1.6e-05[/C][/ROW]
[ROW][C]18[/C][C]0.373102[/C][C]4.0871[/C][C]4e-05[/C][/ROW]
[ROW][C]19[/C][C]0.364505[/C][C]3.9929[/C][C]5.6e-05[/C][/ROW]
[ROW][C]20[/C][C]0.35928[/C][C]3.9357[/C][C]7e-05[/C][/ROW]
[ROW][C]21[/C][C]0.353558[/C][C]3.873[/C][C]8.8e-05[/C][/ROW]
[ROW][C]22[/C][C]0.35101[/C][C]3.8451[/C][C]9.7e-05[/C][/ROW]
[ROW][C]23[/C][C]0.35106[/C][C]3.8457[/C][C]9.7e-05[/C][/ROW]
[ROW][C]24[/C][C]0.338361[/C][C]3.7066[/C][C]0.00016[/C][/ROW]
[ROW][C]25[/C][C]0.301109[/C][C]3.2985[/C][C]0.00064[/C][/ROW]
[ROW][C]26[/C][C]0.250411[/C][C]2.7431[/C][C]0.00351[/C][/ROW]
[ROW][C]27[/C][C]0.203464[/C][C]2.2288[/C][C]0.013843[/C][/ROW]
[ROW][C]28[/C][C]0.164175[/C][C]1.7984[/C][C]0.03731[/C][/ROW]
[ROW][C]29[/C][C]0.137391[/C][C]1.505[/C][C]0.067471[/C][/ROW]
[ROW][C]30[/C][C]0.121584[/C][C]1.3319[/C][C]0.092712[/C][/ROW]
[ROW][C]31[/C][C]0.11694[/C][C]1.281[/C][C]0.10133[/C][/ROW]
[ROW][C]32[/C][C]0.115499[/C][C]1.2652[/C][C]0.10412[/C][/ROW]
[ROW][C]33[/C][C]0.109953[/C][C]1.2045[/C][C]0.115387[/C][/ROW]
[ROW][C]34[/C][C]0.107805[/C][C]1.1809[/C][C]0.119979[/C][/ROW]
[ROW][C]35[/C][C]0.108223[/C][C]1.1855[/C][C]0.119077[/C][/ROW]
[ROW][C]36[/C][C]0.098717[/C][C]1.0814[/C][C]0.140845[/C][/ROW]
[ROW][C]37[/C][C]0.07015[/C][C]0.7685[/C][C]0.221863[/C][/ROW]
[ROW][C]38[/C][C]0.030069[/C][C]0.3294[/C][C]0.371219[/C][/ROW]
[ROW][C]39[/C][C]-0.007877[/C][C]-0.0863[/C][C]0.465692[/C][/ROW]
[ROW][C]40[/C][C]-0.039852[/C][C]-0.4366[/C][C]0.331609[/C][/ROW]
[ROW][C]41[/C][C]-0.061316[/C][C]-0.6717[/C][C]0.251539[/C][/ROW]
[ROW][C]42[/C][C]-0.072496[/C][C]-0.7942[/C][C]0.214336[/C][/ROW]
[ROW][C]43[/C][C]-0.073227[/C][C]-0.8022[/C][C]0.212021[/C][/ROW]
[ROW][C]44[/C][C]-0.071591[/C][C]-0.7842[/C][C]0.217222[/C][/ROW]
[ROW][C]45[/C][C]-0.07485[/C][C]-0.8199[/C][C]0.206937[/C][/ROW]
[ROW][C]46[/C][C]-0.076155[/C][C]-0.8342[/C][C]0.202902[/C][/ROW]
[ROW][C]47[/C][C]-0.073331[/C][C]-0.8033[/C][C]0.211695[/C][/ROW]
[ROW][C]48[/C][C]-0.078497[/C][C]-0.8599[/C][C]0.195782[/C][/ROW]
[/TABLE]
Source: https://freestatistics.org/blog/index.php?pk=&T=1

Globally Unique Identifier (entire table): ba.freestatistics.org/blog/index.php?pk=&T=1

As an alternative you can also use a QR Code:  

The GUIDs for individual cells are displayed in the table below:

Autocorrelation Function
Time lag kACF(k)T-STATP-value
10.9487810.39340
20.8794379.63370
30.8144968.92240
40.759718.32220
50.7196057.88290
60.6930657.59210
70.6787957.43580
80.6691287.32990
90.661737.24890
100.6585317.21380
110.6572877.20020
120.6419147.03180
130.5961696.53070
140.5345535.85570
150.4758525.21270
160.4273864.68184e-06
170.395084.32791.6e-05
180.3731024.08714e-05
190.3645053.99295.6e-05
200.359283.93577e-05
210.3535583.8738.8e-05
220.351013.84519.7e-05
230.351063.84579.7e-05
240.3383613.70660.00016
250.3011093.29850.00064
260.2504112.74310.00351
270.2034642.22880.013843
280.1641751.79840.03731
290.1373911.5050.067471
300.1215841.33190.092712
310.116941.2810.10133
320.1154991.26520.10412
330.1099531.20450.115387
340.1078051.18090.119979
350.1082231.18550.119077
360.0987171.08140.140845
370.070150.76850.221863
380.0300690.32940.371219
39-0.007877-0.08630.465692
40-0.039852-0.43660.331609
41-0.061316-0.67170.251539
42-0.072496-0.79420.214336
43-0.073227-0.80220.212021
44-0.071591-0.78420.217222
45-0.07485-0.81990.206937
46-0.076155-0.83420.202902
47-0.073331-0.80330.211695
48-0.078497-0.85990.195782


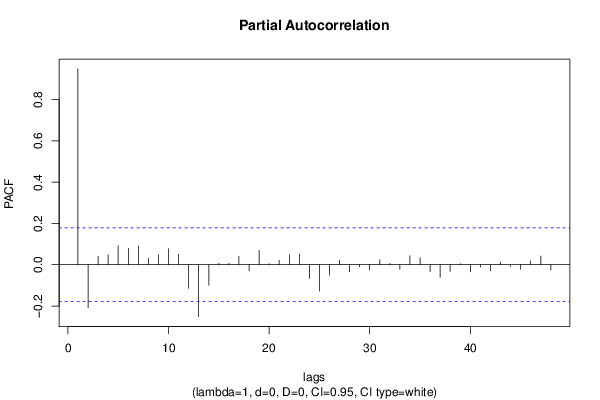
Partial Autocorrelation Function
Time lag kPACF(k)T-STATP-value
10.9487810.39340
2-0.207847-2.27690.012283
30.0406170.44490.328584
40.0484890.53120.29814
50.0918031.00570.158304
60.0794130.86990.19304
70.0908190.99490.160901
80.0313910.34390.365772
90.0479250.5250.300278
100.0773420.84720.199273
110.050770.55620.289568
12-0.114181-1.25080.106723
13-0.251547-2.75560.003387
14-0.099151-1.08610.139796
150.0075320.08250.467189
160.0067360.07380.470652
170.0402320.44070.330105
18-0.030371-0.33270.36997
190.0698240.76490.222923
200.0049670.05440.478348
210.0203410.22280.412027
220.0491910.53890.295492
230.051380.56280.287298
24-0.066629-0.72990.23344
25-0.127502-1.39670.082539
26-0.050436-0.55250.290817
270.0222120.24330.404085
28-0.033561-0.36760.356892
29-0.009046-0.09910.460613
30-0.025888-0.28360.388609
310.0242940.26610.395297
320.0059780.06550.473948
33-0.021231-0.23260.408243
340.0429680.47070.319357
350.0341030.37360.354687
36-0.033353-0.36540.35774
37-0.060534-0.66310.254262
38-0.03212-0.35190.362783
390.0045960.05030.479964
40-0.033754-0.36980.356108
41-0.011393-0.12480.450443
42-0.028954-0.31720.375832
430.0126410.13850.445049
44-0.007779-0.08520.466118
45-0.021702-0.23770.406248
460.0179060.19610.422413
470.0418420.45840.323764
48-0.025928-0.2840.388438

\begin{tabular}{lllllllll}
\hline
Partial Autocorrelation Function \tabularnewline
Time lag k & PACF(k) & T-STAT & P-value \tabularnewline
1 & 0.94878 & 10.3934 & 0 \tabularnewline
2 & -0.207847 & -2.2769 & 0.012283 \tabularnewline
3 & 0.040617 & 0.4449 & 0.328584 \tabularnewline
4 & 0.048489 & 0.5312 & 0.29814 \tabularnewline
5 & 0.091803 & 1.0057 & 0.158304 \tabularnewline
6 & 0.079413 & 0.8699 & 0.19304 \tabularnewline
7 & 0.090819 & 0.9949 & 0.160901 \tabularnewline
8 & 0.031391 & 0.3439 & 0.365772 \tabularnewline
9 & 0.047925 & 0.525 & 0.300278 \tabularnewline
10 & 0.077342 & 0.8472 & 0.199273 \tabularnewline
11 & 0.05077 & 0.5562 & 0.289568 \tabularnewline
12 & -0.114181 & -1.2508 & 0.106723 \tabularnewline
13 & -0.251547 & -2.7556 & 0.003387 \tabularnewline
14 & -0.099151 & -1.0861 & 0.139796 \tabularnewline
15 & 0.007532 & 0.0825 & 0.467189 \tabularnewline
16 & 0.006736 & 0.0738 & 0.470652 \tabularnewline
17 & 0.040232 & 0.4407 & 0.330105 \tabularnewline
18 & -0.030371 & -0.3327 & 0.36997 \tabularnewline
19 & 0.069824 & 0.7649 & 0.222923 \tabularnewline
20 & 0.004967 & 0.0544 & 0.478348 \tabularnewline
21 & 0.020341 & 0.2228 & 0.412027 \tabularnewline
22 & 0.049191 & 0.5389 & 0.295492 \tabularnewline
23 & 0.05138 & 0.5628 & 0.287298 \tabularnewline
24 & -0.066629 & -0.7299 & 0.23344 \tabularnewline
25 & -0.127502 & -1.3967 & 0.082539 \tabularnewline
26 & -0.050436 & -0.5525 & 0.290817 \tabularnewline
27 & 0.022212 & 0.2433 & 0.404085 \tabularnewline
28 & -0.033561 & -0.3676 & 0.356892 \tabularnewline
29 & -0.009046 & -0.0991 & 0.460613 \tabularnewline
30 & -0.025888 & -0.2836 & 0.388609 \tabularnewline
31 & 0.024294 & 0.2661 & 0.395297 \tabularnewline
32 & 0.005978 & 0.0655 & 0.473948 \tabularnewline
33 & -0.021231 & -0.2326 & 0.408243 \tabularnewline
34 & 0.042968 & 0.4707 & 0.319357 \tabularnewline
35 & 0.034103 & 0.3736 & 0.354687 \tabularnewline
36 & -0.033353 & -0.3654 & 0.35774 \tabularnewline
37 & -0.060534 & -0.6631 & 0.254262 \tabularnewline
38 & -0.03212 & -0.3519 & 0.362783 \tabularnewline
39 & 0.004596 & 0.0503 & 0.479964 \tabularnewline
40 & -0.033754 & -0.3698 & 0.356108 \tabularnewline
41 & -0.011393 & -0.1248 & 0.450443 \tabularnewline
42 & -0.028954 & -0.3172 & 0.375832 \tabularnewline
43 & 0.012641 & 0.1385 & 0.445049 \tabularnewline
44 & -0.007779 & -0.0852 & 0.466118 \tabularnewline
45 & -0.021702 & -0.2377 & 0.406248 \tabularnewline
46 & 0.017906 & 0.1961 & 0.422413 \tabularnewline
47 & 0.041842 & 0.4584 & 0.323764 \tabularnewline
48 & -0.025928 & -0.284 & 0.388438 \tabularnewline
\hline
\end{tabular}
%Source: https://freestatistics.org/blog/index.php?pk=&T=2

[TABLE]
[ROW][C]Partial Autocorrelation Function[/C][/ROW]
[ROW][C]Time lag k[/C][C]PACF(k)[/C][C]T-STAT[/C][C]P-value[/C][/ROW]
[ROW][C]1[/C][C]0.94878[/C][C]10.3934[/C][C]0[/C][/ROW]
[ROW][C]2[/C][C]-0.207847[/C][C]-2.2769[/C][C]0.012283[/C][/ROW]
[ROW][C]3[/C][C]0.040617[/C][C]0.4449[/C][C]0.328584[/C][/ROW]
[ROW][C]4[/C][C]0.048489[/C][C]0.5312[/C][C]0.29814[/C][/ROW]
[ROW][C]5[/C][C]0.091803[/C][C]1.0057[/C][C]0.158304[/C][/ROW]
[ROW][C]6[/C][C]0.079413[/C][C]0.8699[/C][C]0.19304[/C][/ROW]
[ROW][C]7[/C][C]0.090819[/C][C]0.9949[/C][C]0.160901[/C][/ROW]
[ROW][C]8[/C][C]0.031391[/C][C]0.3439[/C][C]0.365772[/C][/ROW]
[ROW][C]9[/C][C]0.047925[/C][C]0.525[/C][C]0.300278[/C][/ROW]
[ROW][C]10[/C][C]0.077342[/C][C]0.8472[/C][C]0.199273[/C][/ROW]
[ROW][C]11[/C][C]0.05077[/C][C]0.5562[/C][C]0.289568[/C][/ROW]
[ROW][C]12[/C][C]-0.114181[/C][C]-1.2508[/C][C]0.106723[/C][/ROW]
[ROW][C]13[/C][C]-0.251547[/C][C]-2.7556[/C][C]0.003387[/C][/ROW]
[ROW][C]14[/C][C]-0.099151[/C][C]-1.0861[/C][C]0.139796[/C][/ROW]
[ROW][C]15[/C][C]0.007532[/C][C]0.0825[/C][C]0.467189[/C][/ROW]
[ROW][C]16[/C][C]0.006736[/C][C]0.0738[/C][C]0.470652[/C][/ROW]
[ROW][C]17[/C][C]0.040232[/C][C]0.4407[/C][C]0.330105[/C][/ROW]
[ROW][C]18[/C][C]-0.030371[/C][C]-0.3327[/C][C]0.36997[/C][/ROW]
[ROW][C]19[/C][C]0.069824[/C][C]0.7649[/C][C]0.222923[/C][/ROW]
[ROW][C]20[/C][C]0.004967[/C][C]0.0544[/C][C]0.478348[/C][/ROW]
[ROW][C]21[/C][C]0.020341[/C][C]0.2228[/C][C]0.412027[/C][/ROW]
[ROW][C]22[/C][C]0.049191[/C][C]0.5389[/C][C]0.295492[/C][/ROW]
[ROW][C]23[/C][C]0.05138[/C][C]0.5628[/C][C]0.287298[/C][/ROW]
[ROW][C]24[/C][C]-0.066629[/C][C]-0.7299[/C][C]0.23344[/C][/ROW]
[ROW][C]25[/C][C]-0.127502[/C][C]-1.3967[/C][C]0.082539[/C][/ROW]
[ROW][C]26[/C][C]-0.050436[/C][C]-0.5525[/C][C]0.290817[/C][/ROW]
[ROW][C]27[/C][C]0.022212[/C][C]0.2433[/C][C]0.404085[/C][/ROW]
[ROW][C]28[/C][C]-0.033561[/C][C]-0.3676[/C][C]0.356892[/C][/ROW]
[ROW][C]29[/C][C]-0.009046[/C][C]-0.0991[/C][C]0.460613[/C][/ROW]
[ROW][C]30[/C][C]-0.025888[/C][C]-0.2836[/C][C]0.388609[/C][/ROW]
[ROW][C]31[/C][C]0.024294[/C][C]0.2661[/C][C]0.395297[/C][/ROW]
[ROW][C]32[/C][C]0.005978[/C][C]0.0655[/C][C]0.473948[/C][/ROW]
[ROW][C]33[/C][C]-0.021231[/C][C]-0.2326[/C][C]0.408243[/C][/ROW]
[ROW][C]34[/C][C]0.042968[/C][C]0.4707[/C][C]0.319357[/C][/ROW]
[ROW][C]35[/C][C]0.034103[/C][C]0.3736[/C][C]0.354687[/C][/ROW]
[ROW][C]36[/C][C]-0.033353[/C][C]-0.3654[/C][C]0.35774[/C][/ROW]
[ROW][C]37[/C][C]-0.060534[/C][C]-0.6631[/C][C]0.254262[/C][/ROW]
[ROW][C]38[/C][C]-0.03212[/C][C]-0.3519[/C][C]0.362783[/C][/ROW]
[ROW][C]39[/C][C]0.004596[/C][C]0.0503[/C][C]0.479964[/C][/ROW]
[ROW][C]40[/C][C]-0.033754[/C][C]-0.3698[/C][C]0.356108[/C][/ROW]
[ROW][C]41[/C][C]-0.011393[/C][C]-0.1248[/C][C]0.450443[/C][/ROW]
[ROW][C]42[/C][C]-0.028954[/C][C]-0.3172[/C][C]0.375832[/C][/ROW]
[ROW][C]43[/C][C]0.012641[/C][C]0.1385[/C][C]0.445049[/C][/ROW]
[ROW][C]44[/C][C]-0.007779[/C][C]-0.0852[/C][C]0.466118[/C][/ROW]
[ROW][C]45[/C][C]-0.021702[/C][C]-0.2377[/C][C]0.406248[/C][/ROW]
[ROW][C]46[/C][C]0.017906[/C][C]0.1961[/C][C]0.422413[/C][/ROW]
[ROW][C]47[/C][C]0.041842[/C][C]0.4584[/C][C]0.323764[/C][/ROW]
[ROW][C]48[/C][C]-0.025928[/C][C]-0.284[/C][C]0.388438[/C][/ROW]
[/TABLE]
Source: https://freestatistics.org/blog/index.php?pk=&T=2

Globally Unique Identifier (entire table): ba.freestatistics.org/blog/index.php?pk=&T=2

As an alternative you can also use a QR Code:  

The GUIDs for individual cells are displayed in the table below:

Partial Autocorrelation Function
Time lag kPACF(k)T-STATP-value
10.9487810.39340
2-0.207847-2.27690.012283
30.0406170.44490.328584
40.0484890.53120.29814
50.0918031.00570.158304
60.0794130.86990.19304
70.0908190.99490.160901
80.0313910.34390.365772
90.0479250.5250.300278
100.0773420.84720.199273
110.050770.55620.289568
12-0.114181-1.25080.106723
13-0.251547-2.75560.003387
14-0.099151-1.08610.139796
150.0075320.08250.467189
160.0067360.07380.470652
170.0402320.44070.330105
18-0.030371-0.33270.36997
190.0698240.76490.222923
200.0049670.05440.478348
210.0203410.22280.412027
220.0491910.53890.295492
230.051380.56280.287298
24-0.066629-0.72990.23344
25-0.127502-1.39670.082539
26-0.050436-0.55250.290817
270.0222120.24330.404085
28-0.033561-0.36760.356892
29-0.009046-0.09910.460613
30-0.025888-0.28360.388609
310.0242940.26610.395297
320.0059780.06550.473948
33-0.021231-0.23260.408243
340.0429680.47070.319357
350.0341030.37360.354687
36-0.033353-0.36540.35774
37-0.060534-0.66310.254262
38-0.03212-0.35190.362783
390.0045960.05030.479964
40-0.033754-0.36980.356108
41-0.011393-0.12480.450443
42-0.028954-0.31720.375832
430.0126410.13850.445049
44-0.007779-0.08520.466118
45-0.021702-0.23770.406248
460.0179060.19610.422413
470.0418420.45840.323764
48-0.025928-0.2840.388438


Parameters (Session):
par1 = 48 ; par2 = 1 ; par3 = 0 ; par4 = 0 ; par5 = 12 ; par6 = White Noise ; par7 = 0.95 ;
Parameters (R input):
par1 = 48 ; par2 = 1 ; par3 = 0 ; par4 = 0 ; par5 = 12 ; par6 = White Noise ; par7 = 0.95 ; par8 = ;
R code (references can be found in the software module):
if (par1 == 'Default') {
par1 = 10*log10(length(x))
} else {
par1 <- as.numeric(par1)
}
par2 <- as.numeric(par2)
par3 <- as.numeric(par3)
par4 <- as.numeric(par4)
par5 <- as.numeric(par5)
if (par6 == 'White Noise') par6 <- 'white' else par6 <- 'ma'
par7 <- as.numeric(par7)
if (par8 != '') par8 <- as.numeric(par8)
x <- na.omit(x)
ox <- x
if (par8 == '') {
if (par2 == 0) {
x <- log(x)
} else {
x <- (x ^ par2 - 1) / par2
}
} else {
x <- log(x,base=par8)
}
if (par3 > 0) x <- diff(x,lag=1,difference=par3)
if (par4 > 0) x <- diff(x,lag=par5,difference=par4)
bitmap(file='picts.png')
op <- par(mfrow=c(2,1))
plot(ox,type='l',main='Original Time Series',xlab='time',ylab='value')
if (par8=='') {
mytitle <- paste('Working Time Series (lambda=',par2,', d=',par3,', D=',par4,')',sep='')
mysub <- paste('(lambda=',par2,', d=',par3,', D=',par4,', CI=', par7, ', CI type=',par6,')',sep='')
} else {
mytitle <- paste('Working Time Series (base=',par8,', d=',par3,', D=',par4,')',sep='')
mysub <- paste('(base=',par8,', d=',par3,', D=',par4,', CI=', par7, ', CI type=',par6,')',sep='')
}
plot(x,type='l', main=mytitle,xlab='time',ylab='value')
par(op)
dev.off()
bitmap(file='pic1.png')
racf <- acf(x, par1, main='Autocorrelation', xlab='time lag', ylab='ACF', ci.type=par6, ci=par7, sub=mysub)
dev.off()
bitmap(file='pic2.png')
rpacf <- pacf(x,par1,main='Partial Autocorrelation',xlab='lags',ylab='PACF',sub=mysub)
dev.off()
(myacf <- c(racf$acf))
(mypacf <- c(rpacf$acf))
lengthx <- length(x)
sqrtn <- sqrt(lengthx)
load(file='createtable')
a<-table.start()
a<-table.row.start(a)
a<-table.element(a,'Autocorrelation Function',4,TRUE)
a<-table.row.end(a)
a<-table.row.start(a)
a<-table.element(a,'Time lag k',header=TRUE)
a<-table.element(a,hyperlink('basics.htm','ACF(k)','click here for more information about the Autocorrelation Function'),header=TRUE)
a<-table.element(a,'T-STAT',header=TRUE)
a<-table.element(a,'P-value',header=TRUE)
a<-table.row.end(a)
for (i in 2:(par1+1)) {
a<-table.row.start(a)
a<-table.element(a,i-1,header=TRUE)
a<-table.element(a,round(myacf[i],6))
mytstat <- myacf[i]*sqrtn
a<-table.element(a,round(mytstat,4))
a<-table.element(a,round(1-pt(abs(mytstat),lengthx),6))
a<-table.row.end(a)
}
a<-table.end(a)
table.save(a,file='mytable.tab')
a<-table.start()
a<-table.row.start(a)
a<-table.element(a,'Partial Autocorrelation Function',4,TRUE)
a<-table.row.end(a)
a<-table.row.start(a)
a<-table.element(a,'Time lag k',header=TRUE)
a<-table.element(a,hyperlink('basics.htm','PACF(k)','click here for more information about the Partial Autocorrelation Function'),header=TRUE)
a<-table.element(a,'T-STAT',header=TRUE)
a<-table.element(a,'P-value',header=TRUE)
a<-table.row.end(a)
for (i in 1:par1) {
a<-table.row.start(a)
a<-table.element(a,i,header=TRUE)
a<-table.element(a,round(mypacf[i],6))
mytstat <- mypacf[i]*sqrtn
a<-table.element(a,round(mytstat,4))
a<-table.element(a,round(1-pt(abs(mytstat),lengthx),6))
a<-table.row.end(a)
}
a<-table.end(a)
table.save(a,file='mytable1.tab')