Free Statistics

of Irreproducible Research!

Author's title

Author*Unverified author*
R Software Modulerwasp_autocorrelation.wasp
Title produced by software(Partial) Autocorrelation Function
Date of computationMon, 15 Aug 2016 22:33:44 +0100
Cite this page as followsStatistical Computations at FreeStatistics.org, Office for Research Development and Education, URL https://freestatistics.org/blog/index.php?v=date/2016/Aug/15/t1471296864hnjvalf2hs024qx.htm/, Retrieved Sun, 28 Apr 2024 11:42:38 +0200
Statistical Computations at FreeStatistics.org, Office for Research Development and Education, URL https://freestatistics.org/blog/index.php?pk=, Retrieved Sun, 28 Apr 2024 11:42:38 +0200
QR Codes:

Original text written by user:
IsPrivate?No (this computation is public)
User-defined keywords
Estimated Impact0
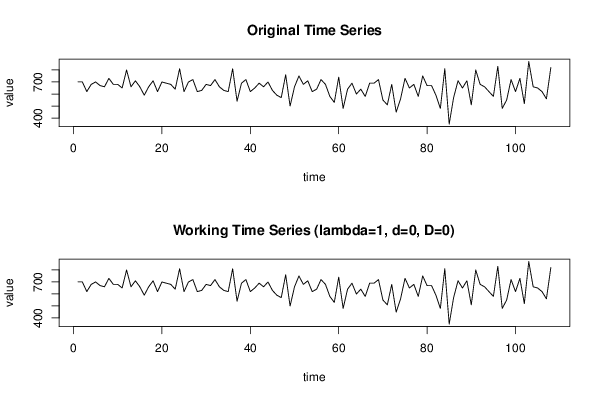
Dataseries X:
700
700
620
680
700
670
660
730
680
680
650
800
660
710
660
590
660
710
620
700
690
680
640
810
620
700
720
620
630
680
670
720
660
630
620
810
540
690
720
620
650
690
660
700
630
590
570
760
500
660
750
680
710
620
640
720
680
580
530
740
480
640
690
600
640
580
690
690
720
550
510
680
450
560
730
650
680
580
750
670
670
590
480
810
350
570
710
650
710
510
800
680
660
620
580
830
480
550
720
620
730
520
870
660
650
620
560
820


Summary of computational transaction
Raw Inputview raw input (R code)
Raw Outputview raw output of R engine
Computing time2 seconds
R Server'Herman Ole Andreas Wold' @ wold.wessa.net
R Framework error message
Warning: there are blank lines in the 'Data' field.
Please, use NA for missing data - blank lines are simply
 deleted and are NOT treated as missing values.

\begin{tabular}{lllllllll}
\hline
Summary of computational transaction \tabularnewline
Raw Input & view raw input (R code)  \tabularnewline
Raw Output & view raw output of R engine  \tabularnewline
Computing time & 2 seconds \tabularnewline
R Server & 'Herman Ole Andreas Wold' @ wold.wessa.net \tabularnewline
R Framework error message & 
Warning: there are blank lines in the 'Data' field.
Please, use NA for missing data - blank lines are simply
 deleted and are NOT treated as missing values.
\tabularnewline \hline \end{tabular} %Source: https://freestatistics.org/blog/index.php?pk=&T=0

[TABLE]
[ROW][C]Summary of computational transaction[/C][/ROW]
[ROW][C]Raw Input[/C][C]view raw input (R code) [/C][/ROW]
[ROW][C]Raw Output[/C][C]view raw output of R engine [/C][/ROW]
[ROW][C]Computing time[/C][C]2 seconds[/C][/ROW]
[ROW][C]R Server[/C][C]'Herman Ole Andreas Wold' @ wold.wessa.net[/C][/ROW]
[ROW][C]R Framework error message[/C][C]
Warning: there are blank lines in the 'Data' field.
Please, use NA for missing data - blank lines are simply
 deleted and are NOT treated as missing values.
[/C][/ROW] [/TABLE] Source: https://freestatistics.org/blog/index.php?pk=&T=0

Globally Unique Identifier (entire table): ba.freestatistics.org/blog/index.php?pk=&T=0

As an alternative you can also use a QR Code:  

The GUIDs for individual cells are displayed in the table below:

Summary of computational transaction
Raw Inputview raw input (R code)
Raw Outputview raw output of R engine
Computing time2 seconds
R Server'Herman Ole Andreas Wold' @ wold.wessa.net
R Framework error message
Warning: there are blank lines in the 'Data' field.
Please, use NA for missing data - blank lines are simply
 deleted and are NOT treated as missing values.


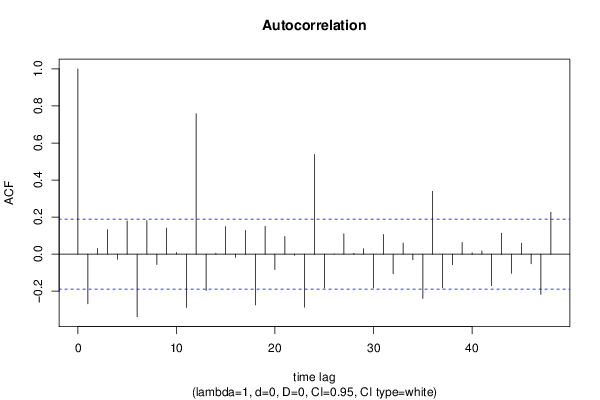
Autocorrelation Function
Time lag kACF(k)T-STATP-value
1-0.268106-2.78620.00315
20.0301280.31310.377406
30.1321041.37290.08632
4-0.027291-0.28360.388625
50.1786981.85710.033012
6-0.337506-3.50750.00033
70.1812211.88330.031175
8-0.056015-0.58210.280848
90.1406161.46130.073414
100.0093220.09690.461504
11-0.287701-2.98990.001728
120.758247.87990
13-0.196807-2.04530.021629
140.0051080.05310.478882
150.1486191.54450.062696
16-0.017192-0.17870.429267
170.1276681.32680.093692
18-0.274039-2.84790.002635
190.1505961.5650.06025
20-0.082594-0.85830.196301
210.0953170.99060.162055
22-0.005651-0.05870.476639
23-0.285965-2.97180.001825
240.5383765.5950
25-0.18272-1.89890.030124
260.0001540.00160.499361
270.1093821.13670.129083
280.0044280.0460.481689
290.0295740.30730.379587
30-0.182531-1.89690.030255
310.1061141.10280.13629
32-0.105776-1.09930.137051
330.0595120.61850.268783
34-0.030181-0.31370.377196
35-0.239474-2.48870.007174
360.3389343.52230.000314
37-0.182219-1.89370.030472
38-0.056693-0.58920.27849
390.0631190.6560.256624
400.0071290.07410.470538
410.0167330.17390.431136
42-0.170224-1.7690.039857
430.1126451.17060.12216
44-0.103263-1.07310.1428
450.0592940.61620.269528
46-0.052198-0.54250.29431
47-0.217087-2.2560.013041
480.2263352.35210.010239

\begin{tabular}{lllllllll}
\hline
Autocorrelation Function \tabularnewline
Time lag k & ACF(k) & T-STAT & P-value \tabularnewline
1 & -0.268106 & -2.7862 & 0.00315 \tabularnewline
2 & 0.030128 & 0.3131 & 0.377406 \tabularnewline
3 & 0.132104 & 1.3729 & 0.08632 \tabularnewline
4 & -0.027291 & -0.2836 & 0.388625 \tabularnewline
5 & 0.178698 & 1.8571 & 0.033012 \tabularnewline
6 & -0.337506 & -3.5075 & 0.00033 \tabularnewline
7 & 0.181221 & 1.8833 & 0.031175 \tabularnewline
8 & -0.056015 & -0.5821 & 0.280848 \tabularnewline
9 & 0.140616 & 1.4613 & 0.073414 \tabularnewline
10 & 0.009322 & 0.0969 & 0.461504 \tabularnewline
11 & -0.287701 & -2.9899 & 0.001728 \tabularnewline
12 & 0.75824 & 7.8799 & 0 \tabularnewline
13 & -0.196807 & -2.0453 & 0.021629 \tabularnewline
14 & 0.005108 & 0.0531 & 0.478882 \tabularnewline
15 & 0.148619 & 1.5445 & 0.062696 \tabularnewline
16 & -0.017192 & -0.1787 & 0.429267 \tabularnewline
17 & 0.127668 & 1.3268 & 0.093692 \tabularnewline
18 & -0.274039 & -2.8479 & 0.002635 \tabularnewline
19 & 0.150596 & 1.565 & 0.06025 \tabularnewline
20 & -0.082594 & -0.8583 & 0.196301 \tabularnewline
21 & 0.095317 & 0.9906 & 0.162055 \tabularnewline
22 & -0.005651 & -0.0587 & 0.476639 \tabularnewline
23 & -0.285965 & -2.9718 & 0.001825 \tabularnewline
24 & 0.538376 & 5.595 & 0 \tabularnewline
25 & -0.18272 & -1.8989 & 0.030124 \tabularnewline
26 & 0.000154 & 0.0016 & 0.499361 \tabularnewline
27 & 0.109382 & 1.1367 & 0.129083 \tabularnewline
28 & 0.004428 & 0.046 & 0.481689 \tabularnewline
29 & 0.029574 & 0.3073 & 0.379587 \tabularnewline
30 & -0.182531 & -1.8969 & 0.030255 \tabularnewline
31 & 0.106114 & 1.1028 & 0.13629 \tabularnewline
32 & -0.105776 & -1.0993 & 0.137051 \tabularnewline
33 & 0.059512 & 0.6185 & 0.268783 \tabularnewline
34 & -0.030181 & -0.3137 & 0.377196 \tabularnewline
35 & -0.239474 & -2.4887 & 0.007174 \tabularnewline
36 & 0.338934 & 3.5223 & 0.000314 \tabularnewline
37 & -0.182219 & -1.8937 & 0.030472 \tabularnewline
38 & -0.056693 & -0.5892 & 0.27849 \tabularnewline
39 & 0.063119 & 0.656 & 0.256624 \tabularnewline
40 & 0.007129 & 0.0741 & 0.470538 \tabularnewline
41 & 0.016733 & 0.1739 & 0.431136 \tabularnewline
42 & -0.170224 & -1.769 & 0.039857 \tabularnewline
43 & 0.112645 & 1.1706 & 0.12216 \tabularnewline
44 & -0.103263 & -1.0731 & 0.1428 \tabularnewline
45 & 0.059294 & 0.6162 & 0.269528 \tabularnewline
46 & -0.052198 & -0.5425 & 0.29431 \tabularnewline
47 & -0.217087 & -2.256 & 0.013041 \tabularnewline
48 & 0.226335 & 2.3521 & 0.010239 \tabularnewline
\hline
\end{tabular}
%Source: https://freestatistics.org/blog/index.php?pk=&T=1

[TABLE]
[ROW][C]Autocorrelation Function[/C][/ROW]
[ROW][C]Time lag k[/C][C]ACF(k)[/C][C]T-STAT[/C][C]P-value[/C][/ROW]
[ROW][C]1[/C][C]-0.268106[/C][C]-2.7862[/C][C]0.00315[/C][/ROW]
[ROW][C]2[/C][C]0.030128[/C][C]0.3131[/C][C]0.377406[/C][/ROW]
[ROW][C]3[/C][C]0.132104[/C][C]1.3729[/C][C]0.08632[/C][/ROW]
[ROW][C]4[/C][C]-0.027291[/C][C]-0.2836[/C][C]0.388625[/C][/ROW]
[ROW][C]5[/C][C]0.178698[/C][C]1.8571[/C][C]0.033012[/C][/ROW]
[ROW][C]6[/C][C]-0.337506[/C][C]-3.5075[/C][C]0.00033[/C][/ROW]
[ROW][C]7[/C][C]0.181221[/C][C]1.8833[/C][C]0.031175[/C][/ROW]
[ROW][C]8[/C][C]-0.056015[/C][C]-0.5821[/C][C]0.280848[/C][/ROW]
[ROW][C]9[/C][C]0.140616[/C][C]1.4613[/C][C]0.073414[/C][/ROW]
[ROW][C]10[/C][C]0.009322[/C][C]0.0969[/C][C]0.461504[/C][/ROW]
[ROW][C]11[/C][C]-0.287701[/C][C]-2.9899[/C][C]0.001728[/C][/ROW]
[ROW][C]12[/C][C]0.75824[/C][C]7.8799[/C][C]0[/C][/ROW]
[ROW][C]13[/C][C]-0.196807[/C][C]-2.0453[/C][C]0.021629[/C][/ROW]
[ROW][C]14[/C][C]0.005108[/C][C]0.0531[/C][C]0.478882[/C][/ROW]
[ROW][C]15[/C][C]0.148619[/C][C]1.5445[/C][C]0.062696[/C][/ROW]
[ROW][C]16[/C][C]-0.017192[/C][C]-0.1787[/C][C]0.429267[/C][/ROW]
[ROW][C]17[/C][C]0.127668[/C][C]1.3268[/C][C]0.093692[/C][/ROW]
[ROW][C]18[/C][C]-0.274039[/C][C]-2.8479[/C][C]0.002635[/C][/ROW]
[ROW][C]19[/C][C]0.150596[/C][C]1.565[/C][C]0.06025[/C][/ROW]
[ROW][C]20[/C][C]-0.082594[/C][C]-0.8583[/C][C]0.196301[/C][/ROW]
[ROW][C]21[/C][C]0.095317[/C][C]0.9906[/C][C]0.162055[/C][/ROW]
[ROW][C]22[/C][C]-0.005651[/C][C]-0.0587[/C][C]0.476639[/C][/ROW]
[ROW][C]23[/C][C]-0.285965[/C][C]-2.9718[/C][C]0.001825[/C][/ROW]
[ROW][C]24[/C][C]0.538376[/C][C]5.595[/C][C]0[/C][/ROW]
[ROW][C]25[/C][C]-0.18272[/C][C]-1.8989[/C][C]0.030124[/C][/ROW]
[ROW][C]26[/C][C]0.000154[/C][C]0.0016[/C][C]0.499361[/C][/ROW]
[ROW][C]27[/C][C]0.109382[/C][C]1.1367[/C][C]0.129083[/C][/ROW]
[ROW][C]28[/C][C]0.004428[/C][C]0.046[/C][C]0.481689[/C][/ROW]
[ROW][C]29[/C][C]0.029574[/C][C]0.3073[/C][C]0.379587[/C][/ROW]
[ROW][C]30[/C][C]-0.182531[/C][C]-1.8969[/C][C]0.030255[/C][/ROW]
[ROW][C]31[/C][C]0.106114[/C][C]1.1028[/C][C]0.13629[/C][/ROW]
[ROW][C]32[/C][C]-0.105776[/C][C]-1.0993[/C][C]0.137051[/C][/ROW]
[ROW][C]33[/C][C]0.059512[/C][C]0.6185[/C][C]0.268783[/C][/ROW]
[ROW][C]34[/C][C]-0.030181[/C][C]-0.3137[/C][C]0.377196[/C][/ROW]
[ROW][C]35[/C][C]-0.239474[/C][C]-2.4887[/C][C]0.007174[/C][/ROW]
[ROW][C]36[/C][C]0.338934[/C][C]3.5223[/C][C]0.000314[/C][/ROW]
[ROW][C]37[/C][C]-0.182219[/C][C]-1.8937[/C][C]0.030472[/C][/ROW]
[ROW][C]38[/C][C]-0.056693[/C][C]-0.5892[/C][C]0.27849[/C][/ROW]
[ROW][C]39[/C][C]0.063119[/C][C]0.656[/C][C]0.256624[/C][/ROW]
[ROW][C]40[/C][C]0.007129[/C][C]0.0741[/C][C]0.470538[/C][/ROW]
[ROW][C]41[/C][C]0.016733[/C][C]0.1739[/C][C]0.431136[/C][/ROW]
[ROW][C]42[/C][C]-0.170224[/C][C]-1.769[/C][C]0.039857[/C][/ROW]
[ROW][C]43[/C][C]0.112645[/C][C]1.1706[/C][C]0.12216[/C][/ROW]
[ROW][C]44[/C][C]-0.103263[/C][C]-1.0731[/C][C]0.1428[/C][/ROW]
[ROW][C]45[/C][C]0.059294[/C][C]0.6162[/C][C]0.269528[/C][/ROW]
[ROW][C]46[/C][C]-0.052198[/C][C]-0.5425[/C][C]0.29431[/C][/ROW]
[ROW][C]47[/C][C]-0.217087[/C][C]-2.256[/C][C]0.013041[/C][/ROW]
[ROW][C]48[/C][C]0.226335[/C][C]2.3521[/C][C]0.010239[/C][/ROW]
[/TABLE]
Source: https://freestatistics.org/blog/index.php?pk=&T=1

Globally Unique Identifier (entire table): ba.freestatistics.org/blog/index.php?pk=&T=1

As an alternative you can also use a QR Code:  

The GUIDs for individual cells are displayed in the table below:

Autocorrelation Function
Time lag kACF(k)T-STATP-value
1-0.268106-2.78620.00315
20.0301280.31310.377406
30.1321041.37290.08632
4-0.027291-0.28360.388625
50.1786981.85710.033012
6-0.337506-3.50750.00033
70.1812211.88330.031175
8-0.056015-0.58210.280848
90.1406161.46130.073414
100.0093220.09690.461504
11-0.287701-2.98990.001728
120.758247.87990
13-0.196807-2.04530.021629
140.0051080.05310.478882
150.1486191.54450.062696
16-0.017192-0.17870.429267
170.1276681.32680.093692
18-0.274039-2.84790.002635
190.1505961.5650.06025
20-0.082594-0.85830.196301
210.0953170.99060.162055
22-0.005651-0.05870.476639
23-0.285965-2.97180.001825
240.5383765.5950
25-0.18272-1.89890.030124
260.0001540.00160.499361
270.1093821.13670.129083
280.0044280.0460.481689
290.0295740.30730.379587
30-0.182531-1.89690.030255
310.1061141.10280.13629
32-0.105776-1.09930.137051
330.0595120.61850.268783
34-0.030181-0.31370.377196
35-0.239474-2.48870.007174
360.3389343.52230.000314
37-0.182219-1.89370.030472
38-0.056693-0.58920.27849
390.0631190.6560.256624
400.0071290.07410.470538
410.0167330.17390.431136
42-0.170224-1.7690.039857
430.1126451.17060.12216
44-0.103263-1.07310.1428
450.0592940.61620.269528
46-0.052198-0.54250.29431
47-0.217087-2.2560.013041
480.2263352.35210.010239


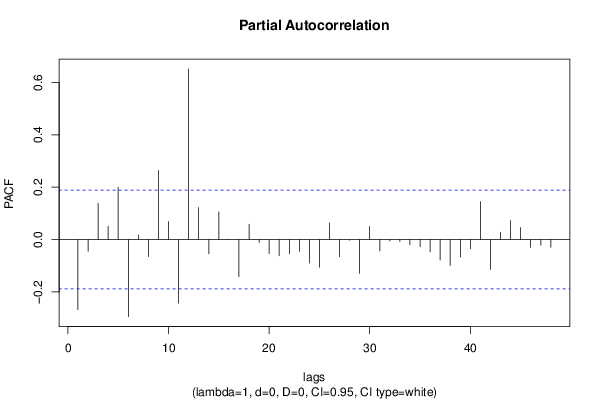
Partial Autocorrelation Function
Time lag kPACF(k)T-STATP-value
1-0.268106-2.78620.00315
2-0.044987-0.46750.320536
30.1387151.44160.076159
40.0509360.52930.298828
50.1996052.07440.020212
6-0.294837-3.0640.001379
70.0174950.18180.428037
8-0.064811-0.67350.251024
90.2637162.74060.003589
100.0686160.71310.238667
11-0.243124-2.52660.006483
120.6517256.77290
130.1217561.26530.10424
14-0.054349-0.56480.286688
150.1053051.09440.138116
160.0001450.00150.499399
17-0.142143-1.47720.071267
180.0584310.60720.272485
19-0.011577-0.12030.45223
20-0.053763-0.55870.288752
21-0.062079-0.64510.260103
22-0.054344-0.56480.286705
23-0.045365-0.47140.319137
24-0.089738-0.93260.176557
25-0.10636-1.10530.135737
260.0630950.65570.256704
27-0.066181-0.68780.246534
28-0.002821-0.02930.488334
29-0.129492-1.34570.090605
300.0494660.51410.304129
31-0.043936-0.45660.324438
32-0.005265-0.05470.478232
33-0.007565-0.07860.46874
34-0.019805-0.20580.41866
35-0.027394-0.28470.388216
36-0.047481-0.49340.311351
37-0.078298-0.81370.208804
38-0.099124-1.03010.152625
39-0.066777-0.6940.244595
40-0.035654-0.37050.355859
410.1447021.50380.067778
42-0.11407-1.18540.119221
430.0279470.29040.386022
440.0721110.74940.227624
450.045350.47130.319193
46-0.030266-0.31450.376862
47-0.021956-0.22820.409972
48-0.029696-0.30860.379105

\begin{tabular}{lllllllll}
\hline
Partial Autocorrelation Function \tabularnewline
Time lag k & PACF(k) & T-STAT & P-value \tabularnewline
1 & -0.268106 & -2.7862 & 0.00315 \tabularnewline
2 & -0.044987 & -0.4675 & 0.320536 \tabularnewline
3 & 0.138715 & 1.4416 & 0.076159 \tabularnewline
4 & 0.050936 & 0.5293 & 0.298828 \tabularnewline
5 & 0.199605 & 2.0744 & 0.020212 \tabularnewline
6 & -0.294837 & -3.064 & 0.001379 \tabularnewline
7 & 0.017495 & 0.1818 & 0.428037 \tabularnewline
8 & -0.064811 & -0.6735 & 0.251024 \tabularnewline
9 & 0.263716 & 2.7406 & 0.003589 \tabularnewline
10 & 0.068616 & 0.7131 & 0.238667 \tabularnewline
11 & -0.243124 & -2.5266 & 0.006483 \tabularnewline
12 & 0.651725 & 6.7729 & 0 \tabularnewline
13 & 0.121756 & 1.2653 & 0.10424 \tabularnewline
14 & -0.054349 & -0.5648 & 0.286688 \tabularnewline
15 & 0.105305 & 1.0944 & 0.138116 \tabularnewline
16 & 0.000145 & 0.0015 & 0.499399 \tabularnewline
17 & -0.142143 & -1.4772 & 0.071267 \tabularnewline
18 & 0.058431 & 0.6072 & 0.272485 \tabularnewline
19 & -0.011577 & -0.1203 & 0.45223 \tabularnewline
20 & -0.053763 & -0.5587 & 0.288752 \tabularnewline
21 & -0.062079 & -0.6451 & 0.260103 \tabularnewline
22 & -0.054344 & -0.5648 & 0.286705 \tabularnewline
23 & -0.045365 & -0.4714 & 0.319137 \tabularnewline
24 & -0.089738 & -0.9326 & 0.176557 \tabularnewline
25 & -0.10636 & -1.1053 & 0.135737 \tabularnewline
26 & 0.063095 & 0.6557 & 0.256704 \tabularnewline
27 & -0.066181 & -0.6878 & 0.246534 \tabularnewline
28 & -0.002821 & -0.0293 & 0.488334 \tabularnewline
29 & -0.129492 & -1.3457 & 0.090605 \tabularnewline
30 & 0.049466 & 0.5141 & 0.304129 \tabularnewline
31 & -0.043936 & -0.4566 & 0.324438 \tabularnewline
32 & -0.005265 & -0.0547 & 0.478232 \tabularnewline
33 & -0.007565 & -0.0786 & 0.46874 \tabularnewline
34 & -0.019805 & -0.2058 & 0.41866 \tabularnewline
35 & -0.027394 & -0.2847 & 0.388216 \tabularnewline
36 & -0.047481 & -0.4934 & 0.311351 \tabularnewline
37 & -0.078298 & -0.8137 & 0.208804 \tabularnewline
38 & -0.099124 & -1.0301 & 0.152625 \tabularnewline
39 & -0.066777 & -0.694 & 0.244595 \tabularnewline
40 & -0.035654 & -0.3705 & 0.355859 \tabularnewline
41 & 0.144702 & 1.5038 & 0.067778 \tabularnewline
42 & -0.11407 & -1.1854 & 0.119221 \tabularnewline
43 & 0.027947 & 0.2904 & 0.386022 \tabularnewline
44 & 0.072111 & 0.7494 & 0.227624 \tabularnewline
45 & 0.04535 & 0.4713 & 0.319193 \tabularnewline
46 & -0.030266 & -0.3145 & 0.376862 \tabularnewline
47 & -0.021956 & -0.2282 & 0.409972 \tabularnewline
48 & -0.029696 & -0.3086 & 0.379105 \tabularnewline
\hline
\end{tabular}
%Source: https://freestatistics.org/blog/index.php?pk=&T=2

[TABLE]
[ROW][C]Partial Autocorrelation Function[/C][/ROW]
[ROW][C]Time lag k[/C][C]PACF(k)[/C][C]T-STAT[/C][C]P-value[/C][/ROW]
[ROW][C]1[/C][C]-0.268106[/C][C]-2.7862[/C][C]0.00315[/C][/ROW]
[ROW][C]2[/C][C]-0.044987[/C][C]-0.4675[/C][C]0.320536[/C][/ROW]
[ROW][C]3[/C][C]0.138715[/C][C]1.4416[/C][C]0.076159[/C][/ROW]
[ROW][C]4[/C][C]0.050936[/C][C]0.5293[/C][C]0.298828[/C][/ROW]
[ROW][C]5[/C][C]0.199605[/C][C]2.0744[/C][C]0.020212[/C][/ROW]
[ROW][C]6[/C][C]-0.294837[/C][C]-3.064[/C][C]0.001379[/C][/ROW]
[ROW][C]7[/C][C]0.017495[/C][C]0.1818[/C][C]0.428037[/C][/ROW]
[ROW][C]8[/C][C]-0.064811[/C][C]-0.6735[/C][C]0.251024[/C][/ROW]
[ROW][C]9[/C][C]0.263716[/C][C]2.7406[/C][C]0.003589[/C][/ROW]
[ROW][C]10[/C][C]0.068616[/C][C]0.7131[/C][C]0.238667[/C][/ROW]
[ROW][C]11[/C][C]-0.243124[/C][C]-2.5266[/C][C]0.006483[/C][/ROW]
[ROW][C]12[/C][C]0.651725[/C][C]6.7729[/C][C]0[/C][/ROW]
[ROW][C]13[/C][C]0.121756[/C][C]1.2653[/C][C]0.10424[/C][/ROW]
[ROW][C]14[/C][C]-0.054349[/C][C]-0.5648[/C][C]0.286688[/C][/ROW]
[ROW][C]15[/C][C]0.105305[/C][C]1.0944[/C][C]0.138116[/C][/ROW]
[ROW][C]16[/C][C]0.000145[/C][C]0.0015[/C][C]0.499399[/C][/ROW]
[ROW][C]17[/C][C]-0.142143[/C][C]-1.4772[/C][C]0.071267[/C][/ROW]
[ROW][C]18[/C][C]0.058431[/C][C]0.6072[/C][C]0.272485[/C][/ROW]
[ROW][C]19[/C][C]-0.011577[/C][C]-0.1203[/C][C]0.45223[/C][/ROW]
[ROW][C]20[/C][C]-0.053763[/C][C]-0.5587[/C][C]0.288752[/C][/ROW]
[ROW][C]21[/C][C]-0.062079[/C][C]-0.6451[/C][C]0.260103[/C][/ROW]
[ROW][C]22[/C][C]-0.054344[/C][C]-0.5648[/C][C]0.286705[/C][/ROW]
[ROW][C]23[/C][C]-0.045365[/C][C]-0.4714[/C][C]0.319137[/C][/ROW]
[ROW][C]24[/C][C]-0.089738[/C][C]-0.9326[/C][C]0.176557[/C][/ROW]
[ROW][C]25[/C][C]-0.10636[/C][C]-1.1053[/C][C]0.135737[/C][/ROW]
[ROW][C]26[/C][C]0.063095[/C][C]0.6557[/C][C]0.256704[/C][/ROW]
[ROW][C]27[/C][C]-0.066181[/C][C]-0.6878[/C][C]0.246534[/C][/ROW]
[ROW][C]28[/C][C]-0.002821[/C][C]-0.0293[/C][C]0.488334[/C][/ROW]
[ROW][C]29[/C][C]-0.129492[/C][C]-1.3457[/C][C]0.090605[/C][/ROW]
[ROW][C]30[/C][C]0.049466[/C][C]0.5141[/C][C]0.304129[/C][/ROW]
[ROW][C]31[/C][C]-0.043936[/C][C]-0.4566[/C][C]0.324438[/C][/ROW]
[ROW][C]32[/C][C]-0.005265[/C][C]-0.0547[/C][C]0.478232[/C][/ROW]
[ROW][C]33[/C][C]-0.007565[/C][C]-0.0786[/C][C]0.46874[/C][/ROW]
[ROW][C]34[/C][C]-0.019805[/C][C]-0.2058[/C][C]0.41866[/C][/ROW]
[ROW][C]35[/C][C]-0.027394[/C][C]-0.2847[/C][C]0.388216[/C][/ROW]
[ROW][C]36[/C][C]-0.047481[/C][C]-0.4934[/C][C]0.311351[/C][/ROW]
[ROW][C]37[/C][C]-0.078298[/C][C]-0.8137[/C][C]0.208804[/C][/ROW]
[ROW][C]38[/C][C]-0.099124[/C][C]-1.0301[/C][C]0.152625[/C][/ROW]
[ROW][C]39[/C][C]-0.066777[/C][C]-0.694[/C][C]0.244595[/C][/ROW]
[ROW][C]40[/C][C]-0.035654[/C][C]-0.3705[/C][C]0.355859[/C][/ROW]
[ROW][C]41[/C][C]0.144702[/C][C]1.5038[/C][C]0.067778[/C][/ROW]
[ROW][C]42[/C][C]-0.11407[/C][C]-1.1854[/C][C]0.119221[/C][/ROW]
[ROW][C]43[/C][C]0.027947[/C][C]0.2904[/C][C]0.386022[/C][/ROW]
[ROW][C]44[/C][C]0.072111[/C][C]0.7494[/C][C]0.227624[/C][/ROW]
[ROW][C]45[/C][C]0.04535[/C][C]0.4713[/C][C]0.319193[/C][/ROW]
[ROW][C]46[/C][C]-0.030266[/C][C]-0.3145[/C][C]0.376862[/C][/ROW]
[ROW][C]47[/C][C]-0.021956[/C][C]-0.2282[/C][C]0.409972[/C][/ROW]
[ROW][C]48[/C][C]-0.029696[/C][C]-0.3086[/C][C]0.379105[/C][/ROW]
[/TABLE]
Source: https://freestatistics.org/blog/index.php?pk=&T=2

Globally Unique Identifier (entire table): ba.freestatistics.org/blog/index.php?pk=&T=2

As an alternative you can also use a QR Code:  

The GUIDs for individual cells are displayed in the table below:

Partial Autocorrelation Function
Time lag kPACF(k)T-STATP-value
1-0.268106-2.78620.00315
2-0.044987-0.46750.320536
30.1387151.44160.076159
40.0509360.52930.298828
50.1996052.07440.020212
6-0.294837-3.0640.001379
70.0174950.18180.428037
8-0.064811-0.67350.251024
90.2637162.74060.003589
100.0686160.71310.238667
11-0.243124-2.52660.006483
120.6517256.77290
130.1217561.26530.10424
14-0.054349-0.56480.286688
150.1053051.09440.138116
160.0001450.00150.499399
17-0.142143-1.47720.071267
180.0584310.60720.272485
19-0.011577-0.12030.45223
20-0.053763-0.55870.288752
21-0.062079-0.64510.260103
22-0.054344-0.56480.286705
23-0.045365-0.47140.319137
24-0.089738-0.93260.176557
25-0.10636-1.10530.135737
260.0630950.65570.256704
27-0.066181-0.68780.246534
28-0.002821-0.02930.488334
29-0.129492-1.34570.090605
300.0494660.51410.304129
31-0.043936-0.45660.324438
32-0.005265-0.05470.478232
33-0.007565-0.07860.46874
34-0.019805-0.20580.41866
35-0.027394-0.28470.388216
36-0.047481-0.49340.311351
37-0.078298-0.81370.208804
38-0.099124-1.03010.152625
39-0.066777-0.6940.244595
40-0.035654-0.37050.355859
410.1447021.50380.067778
42-0.11407-1.18540.119221
430.0279470.29040.386022
440.0721110.74940.227624
450.045350.47130.319193
46-0.030266-0.31450.376862
47-0.021956-0.22820.409972
48-0.029696-0.30860.379105


Parameters (Session):
par1 = 48 ; par2 = 1 ; par3 = 0 ; par4 = 0 ; par5 = 12 ; par6 = White Noise ; par7 = 0.95 ;
Parameters (R input):
par1 = 48 ; par2 = 1 ; par3 = 0 ; par4 = 0 ; par5 = 12 ; par6 = White Noise ; par7 = 0.95 ; par8 = ;
R code (references can be found in the software module):
if (par1 == 'Default') {
par1 = 10*log10(length(x))
} else {
par1 <- as.numeric(par1)
}
par2 <- as.numeric(par2)
par3 <- as.numeric(par3)
par4 <- as.numeric(par4)
par5 <- as.numeric(par5)
if (par6 == 'White Noise') par6 <- 'white' else par6 <- 'ma'
par7 <- as.numeric(par7)
if (par8 != '') par8 <- as.numeric(par8)
x <- na.omit(x)
ox <- x
if (par8 == '') {
if (par2 == 0) {
x <- log(x)
} else {
x <- (x ^ par2 - 1) / par2
}
} else {
x <- log(x,base=par8)
}
if (par3 > 0) x <- diff(x,lag=1,difference=par3)
if (par4 > 0) x <- diff(x,lag=par5,difference=par4)
bitmap(file='picts.png')
op <- par(mfrow=c(2,1))
plot(ox,type='l',main='Original Time Series',xlab='time',ylab='value')
if (par8=='') {
mytitle <- paste('Working Time Series (lambda=',par2,', d=',par3,', D=',par4,')',sep='')
mysub <- paste('(lambda=',par2,', d=',par3,', D=',par4,', CI=', par7, ', CI type=',par6,')',sep='')
} else {
mytitle <- paste('Working Time Series (base=',par8,', d=',par3,', D=',par4,')',sep='')
mysub <- paste('(base=',par8,', d=',par3,', D=',par4,', CI=', par7, ', CI type=',par6,')',sep='')
}
plot(x,type='l', main=mytitle,xlab='time',ylab='value')
par(op)
dev.off()
bitmap(file='pic1.png')
racf <- acf(x, par1, main='Autocorrelation', xlab='time lag', ylab='ACF', ci.type=par6, ci=par7, sub=mysub)
dev.off()
bitmap(file='pic2.png')
rpacf <- pacf(x,par1,main='Partial Autocorrelation',xlab='lags',ylab='PACF',sub=mysub)
dev.off()
(myacf <- c(racf$acf))
(mypacf <- c(rpacf$acf))
lengthx <- length(x)
sqrtn <- sqrt(lengthx)
load(file='createtable')
a<-table.start()
a<-table.row.start(a)
a<-table.element(a,'Autocorrelation Function',4,TRUE)
a<-table.row.end(a)
a<-table.row.start(a)
a<-table.element(a,'Time lag k',header=TRUE)
a<-table.element(a,hyperlink('basics.htm','ACF(k)','click here for more information about the Autocorrelation Function'),header=TRUE)
a<-table.element(a,'T-STAT',header=TRUE)
a<-table.element(a,'P-value',header=TRUE)
a<-table.row.end(a)
for (i in 2:(par1+1)) {
a<-table.row.start(a)
a<-table.element(a,i-1,header=TRUE)
a<-table.element(a,round(myacf[i],6))
mytstat <- myacf[i]*sqrtn
a<-table.element(a,round(mytstat,4))
a<-table.element(a,round(1-pt(abs(mytstat),lengthx),6))
a<-table.row.end(a)
}
a<-table.end(a)
table.save(a,file='mytable.tab')
a<-table.start()
a<-table.row.start(a)
a<-table.element(a,'Partial Autocorrelation Function',4,TRUE)
a<-table.row.end(a)
a<-table.row.start(a)
a<-table.element(a,'Time lag k',header=TRUE)
a<-table.element(a,hyperlink('basics.htm','PACF(k)','click here for more information about the Partial Autocorrelation Function'),header=TRUE)
a<-table.element(a,'T-STAT',header=TRUE)
a<-table.element(a,'P-value',header=TRUE)
a<-table.row.end(a)
for (i in 1:par1) {
a<-table.row.start(a)
a<-table.element(a,i,header=TRUE)
a<-table.element(a,round(mypacf[i],6))
mytstat <- mypacf[i]*sqrtn
a<-table.element(a,round(mytstat,4))
a<-table.element(a,round(1-pt(abs(mytstat),lengthx),6))
a<-table.row.end(a)
}
a<-table.end(a)
table.save(a,file='mytable1.tab')