Free Statistics

of Irreproducible Research!

Author's title

Author*Unverified author*
R Software Modulerwasp_smp.wasp
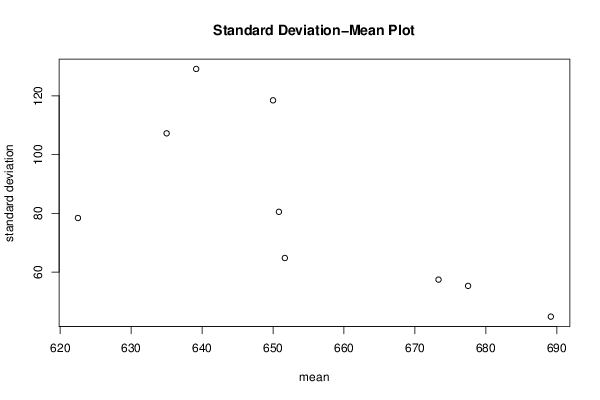
Title produced by softwareStandard Deviation-Mean Plot
Date of computationMon, 15 Aug 2016 23:00:10 +0100
Cite this page as followsStatistical Computations at FreeStatistics.org, Office for Research Development and Education, URL https://freestatistics.org/blog/index.php?v=date/2016/Aug/15/t14712984489ro03zgb837t1qz.htm/, Retrieved Sun, 28 Apr 2024 12:22:15 +0200
Statistical Computations at FreeStatistics.org, Office for Research Development and Education, URL https://freestatistics.org/blog/index.php?pk=, Retrieved Sun, 28 Apr 2024 12:22:15 +0200
QR Codes:

Original text written by user:
IsPrivate?No (this computation is public)
User-defined keywords
Estimated Impact0
Dataseries X:
700
700
620
680
700
670
660
730
680
680
650
800
660
710
660
590
660
710
620
700
690
680
640
810
620
700
720
620
630
680
670
720
660
630
620
810
540
690
720
620
650
690
660
700
630
590
570
760
500
660
750
680
710
620
640
720
680
580
530
740
480
640
690
600
640
580
690
690
720
550
510
680
450
560
730
650
680
580
750
670
670
590
480
810
350
570
710
650
710
510
800
680
660
620
580
830
480
550
720
620
730
520
870
660
650
620
560
820


Summary of computational transaction
Raw Inputview raw input (R code)
Raw Outputview raw output of R engine
Computing time1 seconds
R Server'Gertrude Mary Cox' @ cox.wessa.net
R Framework error message
Warning: there are blank lines in the 'Data' field.
Please, use NA for missing data - blank lines are simply
 deleted and are NOT treated as missing values.

\begin{tabular}{lllllllll}
\hline
Summary of computational transaction \tabularnewline
Raw Input & view raw input (R code)  \tabularnewline
Raw Output & view raw output of R engine  \tabularnewline
Computing time & 1 seconds \tabularnewline
R Server & 'Gertrude Mary Cox' @ cox.wessa.net \tabularnewline
R Framework error message & 
Warning: there are blank lines in the 'Data' field.
Please, use NA for missing data - blank lines are simply
 deleted and are NOT treated as missing values.
\tabularnewline \hline \end{tabular} %Source: https://freestatistics.org/blog/index.php?pk=&T=0

[TABLE]
[ROW][C]Summary of computational transaction[/C][/ROW]
[ROW][C]Raw Input[/C][C]view raw input (R code) [/C][/ROW]
[ROW][C]Raw Output[/C][C]view raw output of R engine [/C][/ROW]
[ROW][C]Computing time[/C][C]1 seconds[/C][/ROW]
[ROW][C]R Server[/C][C]'Gertrude Mary Cox' @ cox.wessa.net[/C][/ROW]
[ROW][C]R Framework error message[/C][C]
Warning: there are blank lines in the 'Data' field.
Please, use NA for missing data - blank lines are simply
 deleted and are NOT treated as missing values.
[/C][/ROW] [/TABLE] Source: https://freestatistics.org/blog/index.php?pk=&T=0

Globally Unique Identifier (entire table): ba.freestatistics.org/blog/index.php?pk=&T=0

As an alternative you can also use a QR Code:  

The GUIDs for individual cells are displayed in the table below:

Summary of computational transaction
Raw Inputview raw input (R code)
Raw Outputview raw output of R engine
Computing time1 seconds
R Server'Gertrude Mary Cox' @ cox.wessa.net
R Framework error message
Warning: there are blank lines in the 'Data' field.
Please, use NA for missing data - blank lines are simply
 deleted and are NOT treated as missing values.


Standard Deviation-Mean Plot
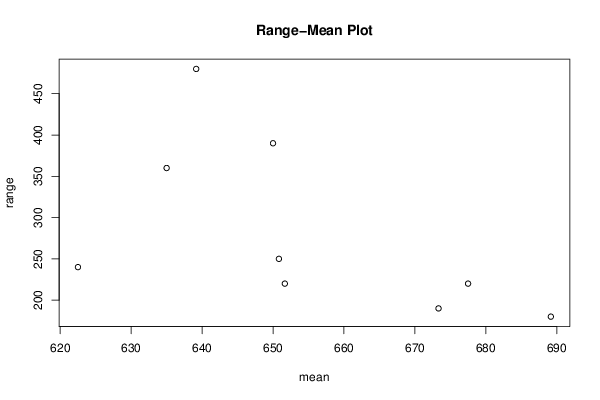
SectionMeanStandard DeviationRange
1689.16666666666744.8144321991625180
2677.555.2884995439213220
3673.33333333333357.4192450052219190
4651.66666666666764.7840234700632220
5650.83333333333380.5050346628123250
6622.578.4074439879739240
7635107.238052947636360
8639.166666666667129.155180329945480
9650118.475160419236390

\begin{tabular}{lllllllll}
\hline
Standard Deviation-Mean Plot \tabularnewline
Section & Mean & Standard Deviation & Range \tabularnewline
1 & 689.166666666667 & 44.8144321991625 & 180 \tabularnewline
2 & 677.5 & 55.2884995439213 & 220 \tabularnewline
3 & 673.333333333333 & 57.4192450052219 & 190 \tabularnewline
4 & 651.666666666667 & 64.7840234700632 & 220 \tabularnewline
5 & 650.833333333333 & 80.5050346628123 & 250 \tabularnewline
6 & 622.5 & 78.4074439879739 & 240 \tabularnewline
7 & 635 & 107.238052947636 & 360 \tabularnewline
8 & 639.166666666667 & 129.155180329945 & 480 \tabularnewline
9 & 650 & 118.475160419236 & 390 \tabularnewline
\hline
\end{tabular}
%Source: https://freestatistics.org/blog/index.php?pk=&T=1

[TABLE]
[ROW][C]Standard Deviation-Mean Plot[/C][/ROW]
[ROW][C]Section[/C][C]Mean[/C][C]Standard Deviation[/C][C]Range[/C][/ROW]
[ROW][C]1[/C][C]689.166666666667[/C][C]44.8144321991625[/C][C]180[/C][/ROW]
[ROW][C]2[/C][C]677.5[/C][C]55.2884995439213[/C][C]220[/C][/ROW]
[ROW][C]3[/C][C]673.333333333333[/C][C]57.4192450052219[/C][C]190[/C][/ROW]
[ROW][C]4[/C][C]651.666666666667[/C][C]64.7840234700632[/C][C]220[/C][/ROW]
[ROW][C]5[/C][C]650.833333333333[/C][C]80.5050346628123[/C][C]250[/C][/ROW]
[ROW][C]6[/C][C]622.5[/C][C]78.4074439879739[/C][C]240[/C][/ROW]
[ROW][C]7[/C][C]635[/C][C]107.238052947636[/C][C]360[/C][/ROW]
[ROW][C]8[/C][C]639.166666666667[/C][C]129.155180329945[/C][C]480[/C][/ROW]
[ROW][C]9[/C][C]650[/C][C]118.475160419236[/C][C]390[/C][/ROW]
[/TABLE]
Source: https://freestatistics.org/blog/index.php?pk=&T=1

Globally Unique Identifier (entire table): ba.freestatistics.org/blog/index.php?pk=&T=1

As an alternative you can also use a QR Code:  

The GUIDs for individual cells are displayed in the table below:

Standard Deviation-Mean Plot
SectionMeanStandard DeviationRange
1689.16666666666744.8144321991625180
2677.555.2884995439213220
3673.33333333333357.4192450052219190
4651.66666666666764.7840234700632220
5650.83333333333380.5050346628123250
6622.578.4074439879739240
7635107.238052947636360
8639.166666666667129.155180329945480
9650118.475160419236390


Regression: S.E.(k) = alpha + beta * Mean(k)
alpha703.204444601237
beta-0.949667965843242
S.D.0.379941073547076
T-STAT-2.49951382454463
p-value0.0410213903114019

\begin{tabular}{lllllllll}
\hline
Regression: S.E.(k) = alpha + beta * Mean(k) \tabularnewline
alpha & 703.204444601237 \tabularnewline
beta & -0.949667965843242 \tabularnewline
S.D. & 0.379941073547076 \tabularnewline
T-STAT & -2.49951382454463 \tabularnewline
p-value & 0.0410213903114019 \tabularnewline
\hline
\end{tabular}
%Source: https://freestatistics.org/blog/index.php?pk=&T=2

[TABLE]
[ROW][C]Regression: S.E.(k) = alpha + beta * Mean(k)[/C][/ROW]
[ROW][C]alpha[/C][C]703.204444601237[/C][/ROW]
[ROW][C]beta[/C][C]-0.949667965843242[/C][/ROW]
[ROW][C]S.D.[/C][C]0.379941073547076[/C][/ROW]
[ROW][C]T-STAT[/C][C]-2.49951382454463[/C][/ROW]
[ROW][C]p-value[/C][C]0.0410213903114019[/C][/ROW]
[/TABLE]
Source: https://freestatistics.org/blog/index.php?pk=&T=2

Globally Unique Identifier (entire table): ba.freestatistics.org/blog/index.php?pk=&T=2

As an alternative you can also use a QR Code:  

The GUIDs for individual cells are displayed in the table below:

Regression: S.E.(k) = alpha + beta * Mean(k)
alpha703.204444601237
beta-0.949667965843242
S.D.0.379941073547076
T-STAT-2.49951382454463
p-value0.0410213903114019


Regression: ln S.E.(k) = alpha + beta * ln Mean(k)
alpha58.7332105768637
beta-8.38928117904891
S.D.2.76629298385889
T-STAT-3.03267991785386
p-value0.0190424668252982
Lambda9.38928117904891

\begin{tabular}{lllllllll}
\hline
Regression: ln S.E.(k) = alpha + beta * ln Mean(k) \tabularnewline
alpha & 58.7332105768637 \tabularnewline
beta & -8.38928117904891 \tabularnewline
S.D. & 2.76629298385889 \tabularnewline
T-STAT & -3.03267991785386 \tabularnewline
p-value & 0.0190424668252982 \tabularnewline
Lambda & 9.38928117904891 \tabularnewline
\hline
\end{tabular}
%Source: https://freestatistics.org/blog/index.php?pk=&T=3

[TABLE]
[ROW][C]Regression: ln S.E.(k) = alpha + beta * ln Mean(k)[/C][/ROW]
[ROW][C]alpha[/C][C]58.7332105768637[/C][/ROW]
[ROW][C]beta[/C][C]-8.38928117904891[/C][/ROW]
[ROW][C]S.D.[/C][C]2.76629298385889[/C][/ROW]
[ROW][C]T-STAT[/C][C]-3.03267991785386[/C][/ROW]
[ROW][C]p-value[/C][C]0.0190424668252982[/C][/ROW]
[ROW][C]Lambda[/C][C]9.38928117904891[/C][/ROW]
[/TABLE]
Source: https://freestatistics.org/blog/index.php?pk=&T=3

Globally Unique Identifier (entire table): ba.freestatistics.org/blog/index.php?pk=&T=3

As an alternative you can also use a QR Code:  

The GUIDs for individual cells are displayed in the table below:

Regression: ln S.E.(k) = alpha + beta * ln Mean(k)
alpha58.7332105768637
beta-8.38928117904891
S.D.2.76629298385889
T-STAT-3.03267991785386
p-value0.0190424668252982
Lambda9.38928117904891


Parameters (Session):
par1 = 12 ;
Parameters (R input):
par1 = 12 ;
R code (references can be found in the software module):
par1 <- as.numeric(par1)
(n <- length(x))
(np <- floor(n / par1))
arr <- array(NA,dim=c(par1,np))
j <- 0
k <- 1
for (i in 1:(np*par1))
{
j = j + 1
arr[j,k] <- x[i]
if (j == par1) {
j = 0
k=k+1
}
}
arr
arr.mean <- array(NA,dim=np)
arr.sd <- array(NA,dim=np)
arr.range <- array(NA,dim=np)
for (j in 1:np)
{
arr.mean[j] <- mean(arr[,j],na.rm=TRUE)
arr.sd[j] <- sd(arr[,j],na.rm=TRUE)
arr.range[j] <- max(arr[,j],na.rm=TRUE) - min(arr[,j],na.rm=TRUE)
}
arr.mean
arr.sd
arr.range
(lm1 <- lm(arr.sd~arr.mean))
(lnlm1 <- lm(log(arr.sd)~log(arr.mean)))
(lm2 <- lm(arr.range~arr.mean))
bitmap(file='test1.png')
plot(arr.mean,arr.sd,main='Standard Deviation-Mean Plot',xlab='mean',ylab='standard deviation')
dev.off()
bitmap(file='test2.png')
plot(arr.mean,arr.range,main='Range-Mean Plot',xlab='mean',ylab='range')
dev.off()
load(file='createtable')
a<-table.start()
a<-table.row.start(a)
a<-table.element(a,'Standard Deviation-Mean Plot',4,TRUE)
a<-table.row.end(a)
a<-table.row.start(a)
a<-table.element(a,'Section',header=TRUE)
a<-table.element(a,'Mean',header=TRUE)
a<-table.element(a,'Standard Deviation',header=TRUE)
a<-table.element(a,'Range',header=TRUE)
a<-table.row.end(a)
for (j in 1:np) {
a<-table.row.start(a)
a<-table.element(a,j,header=TRUE)
a<-table.element(a,arr.mean[j])
a<-table.element(a,arr.sd[j] )
a<-table.element(a,arr.range[j] )
a<-table.row.end(a)
}
a<-table.end(a)
table.save(a,file='mytable.tab')
a<-table.start()
a<-table.row.start(a)
a<-table.element(a,'Regression: S.E.(k) = alpha + beta * Mean(k)',2,TRUE)
a<-table.row.end(a)
a<-table.row.start(a)
a<-table.element(a,'alpha',header=TRUE)
a<-table.element(a,lm1$coefficients[[1]])
a<-table.row.end(a)
a<-table.row.start(a)
a<-table.element(a,'beta',header=TRUE)
a<-table.element(a,lm1$coefficients[[2]])
a<-table.row.end(a)
a<-table.row.start(a)
a<-table.element(a,'S.D.',header=TRUE)
a<-table.element(a,summary(lm1)$coefficients[2,2])
a<-table.row.end(a)
a<-table.row.start(a)
a<-table.element(a,'T-STAT',header=TRUE)
a<-table.element(a,summary(lm1)$coefficients[2,3])
a<-table.row.end(a)
a<-table.row.start(a)
a<-table.element(a,'p-value',header=TRUE)
a<-table.element(a,summary(lm1)$coefficients[2,4])
a<-table.row.end(a)
a<-table.end(a)
table.save(a,file='mytable1.tab')
a<-table.start()
a<-table.row.start(a)
a<-table.element(a,'Regression: ln S.E.(k) = alpha + beta * ln Mean(k)',2,TRUE)
a<-table.row.end(a)
a<-table.row.start(a)
a<-table.element(a,'alpha',header=TRUE)
a<-table.element(a,lnlm1$coefficients[[1]])
a<-table.row.end(a)
a<-table.row.start(a)
a<-table.element(a,'beta',header=TRUE)
a<-table.element(a,lnlm1$coefficients[[2]])
a<-table.row.end(a)
a<-table.row.start(a)
a<-table.element(a,'S.D.',header=TRUE)
a<-table.element(a,summary(lnlm1)$coefficients[2,2])
a<-table.row.end(a)
a<-table.row.start(a)
a<-table.element(a,'T-STAT',header=TRUE)
a<-table.element(a,summary(lnlm1)$coefficients[2,3])
a<-table.row.end(a)
a<-table.row.start(a)
a<-table.element(a,'p-value',header=TRUE)
a<-table.element(a,summary(lnlm1)$coefficients[2,4])
a<-table.row.end(a)
a<-table.row.start(a)
a<-table.element(a,'Lambda',header=TRUE)
a<-table.element(a,1-lnlm1$coefficients[[2]])
a<-table.row.end(a)
a<-table.end(a)
table.save(a,file='mytable2.tab')