Free Statistics

of Irreproducible Research!

Author's title

Author*Unverified author*
R Software Modulerwasp_autocorrelation.wasp
Title produced by software(Partial) Autocorrelation Function
Date of computationTue, 16 Aug 2016 08:50:26 +0100
Cite this page as followsStatistical Computations at FreeStatistics.org, Office for Research Development and Education, URL https://freestatistics.org/blog/index.php?v=date/2016/Aug/16/t1471333858158ooeliqbwmr9v.htm/, Retrieved Sat, 04 May 2024 21:21:00 +0200
Statistical Computations at FreeStatistics.org, Office for Research Development and Education, URL https://freestatistics.org/blog/index.php?pk=, Retrieved Sat, 04 May 2024 21:21:00 +0200
QR Codes:

Original text written by user:
IsPrivate?No (this computation is public)
User-defined keywords
Estimated Impact0
Dataseries X:
1230
1360
1360
1250
1420
1390
1280
1330
1400
1370
1290
1500
1260
1360
1320
1300
1440
1360
1330
1420
1510
1280
1310
1460
1280
1370
1390
1390
1460
1410
1230
1260
1590
1250
1400
1450
1220
1290
1400
1400
1460
1450
1270
1260
1550
1230
1380
1490
1180
1190
1400
1380
1510
1400
1290
1200
1600
1220
1380
1450
1260
1130
1390
1380
1570
1320
1210
1190
1580
1150
1330
1420
1260
1040
1450
1360
1500
1240
1260
1220
1680
1210
1350
1480
1270
1040
1450
1310
1510
1160
1290
1230
1680
1190
1310
1480
1320
1050
1380
1320
1480
1150
1250
1260
1680
1150
1310
1470


Summary of computational transaction
Raw Inputview raw input (R code)
Raw Outputview raw output of R engine
Computing time2 seconds
R Server'George Udny Yule' @ yule.wessa.net

\begin{tabular}{lllllllll}
\hline
Summary of computational transaction \tabularnewline
Raw Input & view raw input (R code)  \tabularnewline
Raw Output & view raw output of R engine  \tabularnewline
Computing time & 2 seconds \tabularnewline
R Server & 'George Udny Yule' @ yule.wessa.net \tabularnewline
\hline
\end{tabular}
%Source: https://freestatistics.org/blog/index.php?pk=&T=0

[TABLE]
[ROW][C]Summary of computational transaction[/C][/ROW]
[ROW][C]Raw Input[/C][C]view raw input (R code) [/C][/ROW]
[ROW][C]Raw Output[/C][C]view raw output of R engine [/C][/ROW]
[ROW][C]Computing time[/C][C]2 seconds[/C][/ROW]
[ROW][C]R Server[/C][C]'George Udny Yule' @ yule.wessa.net[/C][/ROW]
[/TABLE]
Source: https://freestatistics.org/blog/index.php?pk=&T=0

Globally Unique Identifier (entire table): ba.freestatistics.org/blog/index.php?pk=&T=0

As an alternative you can also use a QR Code:  

The GUIDs for individual cells are displayed in the table below:

Summary of computational transaction
Raw Inputview raw input (R code)
Raw Outputview raw output of R engine
Computing time2 seconds
R Server'George Udny Yule' @ yule.wessa.net


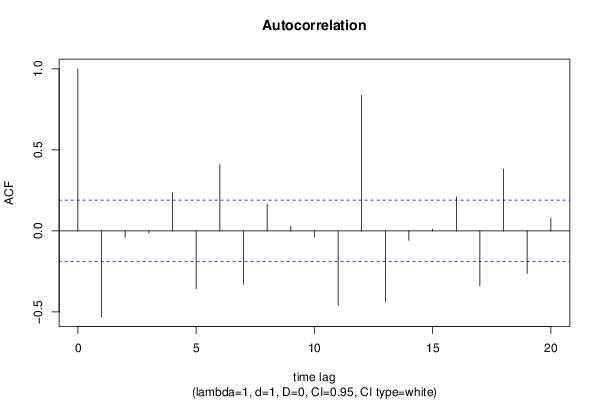
Autocorrelation Function
Time lag kACF(k)T-STATP-value
1-0.529169-5.47380
2-0.03725-0.38530.350385
3-0.012895-0.13340.447069
40.2351322.43220.008333
5-0.357174-3.69460.000174
60.410264.24382.3e-05
7-0.329065-3.40390.000468
80.1662861.72010.044155
90.031020.32090.374465
10-0.036273-0.37520.354124
11-0.458942-4.74733e-06
120.8370768.65880
13-0.436838-4.51878e-06
14-0.057737-0.59720.275807
150.0124920.12920.448712
160.2103152.17550.015896
17-0.339211-3.50880.00033
180.3827153.95886.8e-05
19-0.263286-2.72350.003773
200.0791160.81840.207477

\begin{tabular}{lllllllll}
\hline
Autocorrelation Function \tabularnewline
Time lag k & ACF(k) & T-STAT & P-value \tabularnewline
1 & -0.529169 & -5.4738 & 0 \tabularnewline
2 & -0.03725 & -0.3853 & 0.350385 \tabularnewline
3 & -0.012895 & -0.1334 & 0.447069 \tabularnewline
4 & 0.235132 & 2.4322 & 0.008333 \tabularnewline
5 & -0.357174 & -3.6946 & 0.000174 \tabularnewline
6 & 0.41026 & 4.2438 & 2.3e-05 \tabularnewline
7 & -0.329065 & -3.4039 & 0.000468 \tabularnewline
8 & 0.166286 & 1.7201 & 0.044155 \tabularnewline
9 & 0.03102 & 0.3209 & 0.374465 \tabularnewline
10 & -0.036273 & -0.3752 & 0.354124 \tabularnewline
11 & -0.458942 & -4.7473 & 3e-06 \tabularnewline
12 & 0.837076 & 8.6588 & 0 \tabularnewline
13 & -0.436838 & -4.5187 & 8e-06 \tabularnewline
14 & -0.057737 & -0.5972 & 0.275807 \tabularnewline
15 & 0.012492 & 0.1292 & 0.448712 \tabularnewline
16 & 0.210315 & 2.1755 & 0.015896 \tabularnewline
17 & -0.339211 & -3.5088 & 0.00033 \tabularnewline
18 & 0.382715 & 3.9588 & 6.8e-05 \tabularnewline
19 & -0.263286 & -2.7235 & 0.003773 \tabularnewline
20 & 0.079116 & 0.8184 & 0.207477 \tabularnewline
\hline
\end{tabular}
%Source: https://freestatistics.org/blog/index.php?pk=&T=1

[TABLE]
[ROW][C]Autocorrelation Function[/C][/ROW]
[ROW][C]Time lag k[/C][C]ACF(k)[/C][C]T-STAT[/C][C]P-value[/C][/ROW]
[ROW][C]1[/C][C]-0.529169[/C][C]-5.4738[/C][C]0[/C][/ROW]
[ROW][C]2[/C][C]-0.03725[/C][C]-0.3853[/C][C]0.350385[/C][/ROW]
[ROW][C]3[/C][C]-0.012895[/C][C]-0.1334[/C][C]0.447069[/C][/ROW]
[ROW][C]4[/C][C]0.235132[/C][C]2.4322[/C][C]0.008333[/C][/ROW]
[ROW][C]5[/C][C]-0.357174[/C][C]-3.6946[/C][C]0.000174[/C][/ROW]
[ROW][C]6[/C][C]0.41026[/C][C]4.2438[/C][C]2.3e-05[/C][/ROW]
[ROW][C]7[/C][C]-0.329065[/C][C]-3.4039[/C][C]0.000468[/C][/ROW]
[ROW][C]8[/C][C]0.166286[/C][C]1.7201[/C][C]0.044155[/C][/ROW]
[ROW][C]9[/C][C]0.03102[/C][C]0.3209[/C][C]0.374465[/C][/ROW]
[ROW][C]10[/C][C]-0.036273[/C][C]-0.3752[/C][C]0.354124[/C][/ROW]
[ROW][C]11[/C][C]-0.458942[/C][C]-4.7473[/C][C]3e-06[/C][/ROW]
[ROW][C]12[/C][C]0.837076[/C][C]8.6588[/C][C]0[/C][/ROW]
[ROW][C]13[/C][C]-0.436838[/C][C]-4.5187[/C][C]8e-06[/C][/ROW]
[ROW][C]14[/C][C]-0.057737[/C][C]-0.5972[/C][C]0.275807[/C][/ROW]
[ROW][C]15[/C][C]0.012492[/C][C]0.1292[/C][C]0.448712[/C][/ROW]
[ROW][C]16[/C][C]0.210315[/C][C]2.1755[/C][C]0.015896[/C][/ROW]
[ROW][C]17[/C][C]-0.339211[/C][C]-3.5088[/C][C]0.00033[/C][/ROW]
[ROW][C]18[/C][C]0.382715[/C][C]3.9588[/C][C]6.8e-05[/C][/ROW]
[ROW][C]19[/C][C]-0.263286[/C][C]-2.7235[/C][C]0.003773[/C][/ROW]
[ROW][C]20[/C][C]0.079116[/C][C]0.8184[/C][C]0.207477[/C][/ROW]
[/TABLE]
Source: https://freestatistics.org/blog/index.php?pk=&T=1

Globally Unique Identifier (entire table): ba.freestatistics.org/blog/index.php?pk=&T=1

As an alternative you can also use a QR Code:  

The GUIDs for individual cells are displayed in the table below:

Autocorrelation Function
Time lag kACF(k)T-STATP-value
1-0.529169-5.47380
2-0.03725-0.38530.350385
3-0.012895-0.13340.447069
40.2351322.43220.008333
5-0.357174-3.69460.000174
60.410264.24382.3e-05
7-0.329065-3.40390.000468
80.1662861.72010.044155
90.031020.32090.374465
10-0.036273-0.37520.354124
11-0.458942-4.74733e-06
120.8370768.65880
13-0.436838-4.51878e-06
14-0.057737-0.59720.275807
150.0124920.12920.448712
160.2103152.17550.015896
17-0.339211-3.50880.00033
180.3827153.95886.8e-05
19-0.263286-2.72350.003773
200.0791160.81840.207477


Partial Autocorrelation Function
Time lag kPACF(k)T-STATP-value
1-0.529169-5.47380
2-0.440663-4.55837e-06
3-0.473098-4.89382e-06
4-0.127877-1.32280.094366
5-0.488191-5.04991e-06
60.0160750.16630.434126
7-0.247722-2.56250.005892
8-0.068507-0.70860.240044
90.3118783.22610.000833
100.2498582.58450.005549
11-0.648319-6.70630
120.1704221.76290.04039
130.0667430.69040.245721
14-0.034733-0.35930.360045
150.1610481.66590.04933
16-0.030316-0.31360.37722
170.0072320.07480.470255
18-0.021167-0.2190.41355
190.1002541.0370.15103
200.0574970.59480.276631

\begin{tabular}{lllllllll}
\hline
Partial Autocorrelation Function \tabularnewline
Time lag k & PACF(k) & T-STAT & P-value \tabularnewline
1 & -0.529169 & -5.4738 & 0 \tabularnewline
2 & -0.440663 & -4.5583 & 7e-06 \tabularnewline
3 & -0.473098 & -4.8938 & 2e-06 \tabularnewline
4 & -0.127877 & -1.3228 & 0.094366 \tabularnewline
5 & -0.488191 & -5.0499 & 1e-06 \tabularnewline
6 & 0.016075 & 0.1663 & 0.434126 \tabularnewline
7 & -0.247722 & -2.5625 & 0.005892 \tabularnewline
8 & -0.068507 & -0.7086 & 0.240044 \tabularnewline
9 & 0.311878 & 3.2261 & 0.000833 \tabularnewline
10 & 0.249858 & 2.5845 & 0.005549 \tabularnewline
11 & -0.648319 & -6.7063 & 0 \tabularnewline
12 & 0.170422 & 1.7629 & 0.04039 \tabularnewline
13 & 0.066743 & 0.6904 & 0.245721 \tabularnewline
14 & -0.034733 & -0.3593 & 0.360045 \tabularnewline
15 & 0.161048 & 1.6659 & 0.04933 \tabularnewline
16 & -0.030316 & -0.3136 & 0.37722 \tabularnewline
17 & 0.007232 & 0.0748 & 0.470255 \tabularnewline
18 & -0.021167 & -0.219 & 0.41355 \tabularnewline
19 & 0.100254 & 1.037 & 0.15103 \tabularnewline
20 & 0.057497 & 0.5948 & 0.276631 \tabularnewline
\hline
\end{tabular}
%Source: https://freestatistics.org/blog/index.php?pk=&T=2

[TABLE]
[ROW][C]Partial Autocorrelation Function[/C][/ROW]
[ROW][C]Time lag k[/C][C]PACF(k)[/C][C]T-STAT[/C][C]P-value[/C][/ROW]
[ROW][C]1[/C][C]-0.529169[/C][C]-5.4738[/C][C]0[/C][/ROW]
[ROW][C]2[/C][C]-0.440663[/C][C]-4.5583[/C][C]7e-06[/C][/ROW]
[ROW][C]3[/C][C]-0.473098[/C][C]-4.8938[/C][C]2e-06[/C][/ROW]
[ROW][C]4[/C][C]-0.127877[/C][C]-1.3228[/C][C]0.094366[/C][/ROW]
[ROW][C]5[/C][C]-0.488191[/C][C]-5.0499[/C][C]1e-06[/C][/ROW]
[ROW][C]6[/C][C]0.016075[/C][C]0.1663[/C][C]0.434126[/C][/ROW]
[ROW][C]7[/C][C]-0.247722[/C][C]-2.5625[/C][C]0.005892[/C][/ROW]
[ROW][C]8[/C][C]-0.068507[/C][C]-0.7086[/C][C]0.240044[/C][/ROW]
[ROW][C]9[/C][C]0.311878[/C][C]3.2261[/C][C]0.000833[/C][/ROW]
[ROW][C]10[/C][C]0.249858[/C][C]2.5845[/C][C]0.005549[/C][/ROW]
[ROW][C]11[/C][C]-0.648319[/C][C]-6.7063[/C][C]0[/C][/ROW]
[ROW][C]12[/C][C]0.170422[/C][C]1.7629[/C][C]0.04039[/C][/ROW]
[ROW][C]13[/C][C]0.066743[/C][C]0.6904[/C][C]0.245721[/C][/ROW]
[ROW][C]14[/C][C]-0.034733[/C][C]-0.3593[/C][C]0.360045[/C][/ROW]
[ROW][C]15[/C][C]0.161048[/C][C]1.6659[/C][C]0.04933[/C][/ROW]
[ROW][C]16[/C][C]-0.030316[/C][C]-0.3136[/C][C]0.37722[/C][/ROW]
[ROW][C]17[/C][C]0.007232[/C][C]0.0748[/C][C]0.470255[/C][/ROW]
[ROW][C]18[/C][C]-0.021167[/C][C]-0.219[/C][C]0.41355[/C][/ROW]
[ROW][C]19[/C][C]0.100254[/C][C]1.037[/C][C]0.15103[/C][/ROW]
[ROW][C]20[/C][C]0.057497[/C][C]0.5948[/C][C]0.276631[/C][/ROW]
[/TABLE]
Source: https://freestatistics.org/blog/index.php?pk=&T=2

Globally Unique Identifier (entire table): ba.freestatistics.org/blog/index.php?pk=&T=2

As an alternative you can also use a QR Code:  

The GUIDs for individual cells are displayed in the table below:

Partial Autocorrelation Function
Time lag kPACF(k)T-STATP-value
1-0.529169-5.47380
2-0.440663-4.55837e-06
3-0.473098-4.89382e-06
4-0.127877-1.32280.094366
5-0.488191-5.04991e-06
60.0160750.16630.434126
7-0.247722-2.56250.005892
8-0.068507-0.70860.240044
90.3118783.22610.000833
100.2498582.58450.005549
11-0.648319-6.70630
120.1704221.76290.04039
130.0667430.69040.245721
14-0.034733-0.35930.360045
150.1610481.66590.04933
16-0.030316-0.31360.37722
170.0072320.07480.470255
18-0.021167-0.2190.41355
190.1002541.0370.15103
200.0574970.59480.276631


Parameters (Session):
par1 = Default ; par2 = 1 ; par3 = 1 ; par4 = 0 ; par5 = 12 ; par6 = White Noise ; par7 = 0.95 ;
Parameters (R input):
par1 = Default ; par2 = 1 ; par3 = 1 ; par4 = 0 ; par5 = 12 ; par6 = White Noise ; par7 = 0.95 ; par8 = ;
R code (references can be found in the software module):
if (par1 == 'Default') {
par1 = 10*log10(length(x))
} else {
par1 <- as.numeric(par1)
}
par2 <- as.numeric(par2)
par3 <- as.numeric(par3)
par4 <- as.numeric(par4)
par5 <- as.numeric(par5)
if (par6 == 'White Noise') par6 <- 'white' else par6 <- 'ma'
par7 <- as.numeric(par7)
if (par8 != '') par8 <- as.numeric(par8)
x <- na.omit(x)
ox <- x
if (par8 == '') {
if (par2 == 0) {
x <- log(x)
} else {
x <- (x ^ par2 - 1) / par2
}
} else {
x <- log(x,base=par8)
}
if (par3 > 0) x <- diff(x,lag=1,difference=par3)
if (par4 > 0) x <- diff(x,lag=par5,difference=par4)
bitmap(file='picts.png')
op <- par(mfrow=c(2,1))
plot(ox,type='l',main='Original Time Series',xlab='time',ylab='value')
if (par8=='') {
mytitle <- paste('Working Time Series (lambda=',par2,', d=',par3,', D=',par4,')',sep='')
mysub <- paste('(lambda=',par2,', d=',par3,', D=',par4,', CI=', par7, ', CI type=',par6,')',sep='')
} else {
mytitle <- paste('Working Time Series (base=',par8,', d=',par3,', D=',par4,')',sep='')
mysub <- paste('(base=',par8,', d=',par3,', D=',par4,', CI=', par7, ', CI type=',par6,')',sep='')
}
plot(x,type='l', main=mytitle,xlab='time',ylab='value')
par(op)
dev.off()
bitmap(file='pic1.png')
racf <- acf(x, par1, main='Autocorrelation', xlab='time lag', ylab='ACF', ci.type=par6, ci=par7, sub=mysub)
dev.off()
bitmap(file='pic2.png')
rpacf <- pacf(x,par1,main='Partial Autocorrelation',xlab='lags',ylab='PACF',sub=mysub)
dev.off()
(myacf <- c(racf$acf))
(mypacf <- c(rpacf$acf))
lengthx <- length(x)
sqrtn <- sqrt(lengthx)
load(file='createtable')
a<-table.start()
a<-table.row.start(a)
a<-table.element(a,'Autocorrelation Function',4,TRUE)
a<-table.row.end(a)
a<-table.row.start(a)
a<-table.element(a,'Time lag k',header=TRUE)
a<-table.element(a,hyperlink('basics.htm','ACF(k)','click here for more information about the Autocorrelation Function'),header=TRUE)
a<-table.element(a,'T-STAT',header=TRUE)
a<-table.element(a,'P-value',header=TRUE)
a<-table.row.end(a)
for (i in 2:(par1+1)) {
a<-table.row.start(a)
a<-table.element(a,i-1,header=TRUE)
a<-table.element(a,round(myacf[i],6))
mytstat <- myacf[i]*sqrtn
a<-table.element(a,round(mytstat,4))
a<-table.element(a,round(1-pt(abs(mytstat),lengthx),6))
a<-table.row.end(a)
}
a<-table.end(a)
table.save(a,file='mytable.tab')
a<-table.start()
a<-table.row.start(a)
a<-table.element(a,'Partial Autocorrelation Function',4,TRUE)
a<-table.row.end(a)
a<-table.row.start(a)
a<-table.element(a,'Time lag k',header=TRUE)
a<-table.element(a,hyperlink('basics.htm','PACF(k)','click here for more information about the Partial Autocorrelation Function'),header=TRUE)
a<-table.element(a,'T-STAT',header=TRUE)
a<-table.element(a,'P-value',header=TRUE)
a<-table.row.end(a)
for (i in 1:par1) {
a<-table.row.start(a)
a<-table.element(a,i,header=TRUE)
a<-table.element(a,round(mypacf[i],6))
mytstat <- mypacf[i]*sqrtn
a<-table.element(a,round(mytstat,4))
a<-table.element(a,round(1-pt(abs(mytstat),lengthx),6))
a<-table.row.end(a)
}
a<-table.end(a)
table.save(a,file='mytable1.tab')