Free Statistics

of Irreproducible Research!

Author's title

Author*Unverified author*
R Software Modulerwasp_density.wasp
Title produced by softwareKernel Density Estimation
Date of computationTue, 16 Aug 2016 11:23:11 +0100
Cite this page as followsStatistical Computations at FreeStatistics.org, Office for Research Development and Education, URL https://freestatistics.org/blog/index.php?v=date/2016/Aug/16/t1471343029tezsaes48za7hbp.htm/, Retrieved Sat, 04 May 2024 21:04:16 +0200
Statistical Computations at FreeStatistics.org, Office for Research Development and Education, URL https://freestatistics.org/blog/index.php?pk=, Retrieved Sat, 04 May 2024 21:04:16 +0200
QR Codes:

Original text written by user:
IsPrivate?No (this computation is public)
User-defined keywords
Estimated Impact0
Dataseries X:
2350
2375
2300
2325
2325
2250
2350
2100
2225
2125
2075
2350
2400
2250
2350
2300
2325
2425
2325
1950
2025
2175
1800
2200
2300
2300
2375
2375
2225
2400
1950
1950
1900
2150
1850
2550
2225
2600
2300
2250
2375
2475
2100
1850
2100
2400
1975
2525
2250
2425
2300
2450
2225
2500
2200
1850
2150
2350
1900
2525
2175
2450
2300
2375
2200
2450
2275
1825
2200
2050
1725
2475
2000
2400
2275
2375
2350
2525
2225
1650
2150
2100
1850
2450
2050
2700
2325
2425
2325
2525
2200
1850
2150
2025
1875
2225
1975
2500
2225
2425
2250
2475
2275
1825
2125
2100
2075
2375


Summary of computational transaction
Raw Inputview raw input (R code)
Raw Outputview raw output of R engine
Computing time3 seconds
R Server'George Udny Yule' @ yule.wessa.net

\begin{tabular}{lllllllll}
\hline
Summary of computational transaction \tabularnewline
Raw Input & view raw input (R code)  \tabularnewline
Raw Output & view raw output of R engine  \tabularnewline
Computing time & 3 seconds \tabularnewline
R Server & 'George Udny Yule' @ yule.wessa.net \tabularnewline
\hline
\end{tabular}
%Source: https://freestatistics.org/blog/index.php?pk=&T=0

[TABLE]
[ROW][C]Summary of computational transaction[/C][/ROW]
[ROW][C]Raw Input[/C][C]view raw input (R code) [/C][/ROW]
[ROW][C]Raw Output[/C][C]view raw output of R engine [/C][/ROW]
[ROW][C]Computing time[/C][C]3 seconds[/C][/ROW]
[ROW][C]R Server[/C][C]'George Udny Yule' @ yule.wessa.net[/C][/ROW]
[/TABLE]
Source: https://freestatistics.org/blog/index.php?pk=&T=0

Globally Unique Identifier (entire table): ba.freestatistics.org/blog/index.php?pk=&T=0

As an alternative you can also use a QR Code:  

The GUIDs for individual cells are displayed in the table below:

Summary of computational transaction
Raw Inputview raw input (R code)
Raw Outputview raw output of R engine
Computing time3 seconds
R Server'George Udny Yule' @ yule.wessa.net


Properties of Density Trace
Bandwidth72.4078502673773
#Observations108

\begin{tabular}{lllllllll}
\hline
Properties of Density Trace \tabularnewline
Bandwidth & 72.4078502673773 \tabularnewline
#Observations & 108 \tabularnewline
\hline
\end{tabular}
%Source: https://freestatistics.org/blog/index.php?pk=&T=1

[TABLE]
[ROW][C]Properties of Density Trace[/C][/ROW]
[ROW][C]Bandwidth[/C][C]72.4078502673773[/C][/ROW]
[ROW][C]#Observations[/C][C]108[/C][/ROW]
[/TABLE]
Source: https://freestatistics.org/blog/index.php?pk=&T=1

Globally Unique Identifier (entire table): ba.freestatistics.org/blog/index.php?pk=&T=1

As an alternative you can also use a QR Code:  

The GUIDs for individual cells are displayed in the table below:

Properties of Density Trace
Bandwidth72.4078502673773
#Observations108


Maximum Density Values
Kernelx-valuemax. density
Gaussian2318.796734891220.00198025081790254
Epanechnikov2321.701719434470.00197265357949927
Rectangular2324.606703977730.00207001986842826
Triangular2321.701719434470.00197510115595538
Biweight2312.98676580470.00197305206091564
Cosine2312.98676580470.00197321491601181
Optcosine2321.701719434470.0019703076677938

\begin{tabular}{lllllllll}
\hline
Maximum Density Values \tabularnewline
Kernel & x-value & max. density \tabularnewline
Gaussian & 2318.79673489122 & 0.00198025081790254 \tabularnewline
Epanechnikov & 2321.70171943447 & 0.00197265357949927 \tabularnewline
Rectangular & 2324.60670397773 & 0.00207001986842826 \tabularnewline
Triangular & 2321.70171943447 & 0.00197510115595538 \tabularnewline
Biweight & 2312.9867658047 & 0.00197305206091564 \tabularnewline
Cosine & 2312.9867658047 & 0.00197321491601181 \tabularnewline
Optcosine & 2321.70171943447 & 0.0019703076677938 \tabularnewline
\hline
\end{tabular}
%Source: https://freestatistics.org/blog/index.php?pk=&T=2

[TABLE]
[ROW][C]Maximum Density Values[/C][/ROW]
[ROW][C]Kernel[/C][C]x-value[/C][C]max. density[/C][/ROW]
[ROW][C]Gaussian[/C][C]2318.79673489122[/C][C]0.00198025081790254[/C][/ROW]
[ROW][C]Epanechnikov[/C][C]2321.70171943447[/C][C]0.00197265357949927[/C][/ROW]
[ROW][C]Rectangular[/C][C]2324.60670397773[/C][C]0.00207001986842826[/C][/ROW]
[ROW][C]Triangular[/C][C]2321.70171943447[/C][C]0.00197510115595538[/C][/ROW]
[ROW][C]Biweight[/C][C]2312.9867658047[/C][C]0.00197305206091564[/C][/ROW]
[ROW][C]Cosine[/C][C]2312.9867658047[/C][C]0.00197321491601181[/C][/ROW]
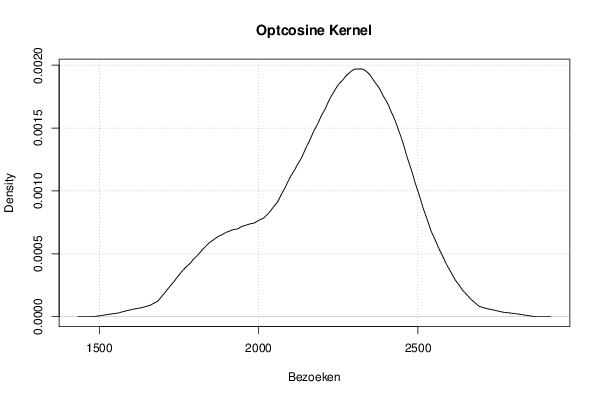
[ROW][C]Optcosine[/C][C]2321.70171943447[/C][C]0.0019703076677938[/C][/ROW]
[/TABLE]
Source: https://freestatistics.org/blog/index.php?pk=&T=2

Globally Unique Identifier (entire table): ba.freestatistics.org/blog/index.php?pk=&T=2

As an alternative you can also use a QR Code:  

The GUIDs for individual cells are displayed in the table below:

Maximum Density Values
Kernelx-valuemax. density
Gaussian2318.796734891220.00198025081790254
Epanechnikov2321.701719434470.00197265357949927
Rectangular2324.606703977730.00207001986842826
Triangular2321.701719434470.00197510115595538
Biweight2312.98676580470.00197305206091564
Cosine2312.98676580470.00197321491601181
Optcosine2321.701719434470.0019703076677938


Kernel Density Values
x-valueGaussianEpanechnikovRectangularTriangularBiweightCosineOptcosine
Kernel Density Values are not shown

\begin{tabular}{lllllllll}
\hline
Kernel Density Values \tabularnewline
x-value & Gaussian & Epanechnikov & Rectangular & Triangular & Biweight & Cosine & Optcosine \tabularnewline
Kernel Density Values are not shown \tabularnewline
\hline
\end{tabular}
%Source: https://freestatistics.org/blog/index.php?pk=&T=3

[TABLE]
[ROW][C]Kernel Density Values[/C][/ROW]
[ROW][C]x-value[/C][C]Gaussian[/C][C]Epanechnikov[/C][C]Rectangular[/C][C]Triangular[/C][C]Biweight[/C][C]Cosine[/C][C]Optcosine[/C][/ROW]
[ROW][C]Kernel Density Values are not shown[/C][/ROW]
[/TABLE]
Source: https://freestatistics.org/blog/index.php?pk=&T=3

Globally Unique Identifier (entire table): ba.freestatistics.org/blog/index.php?pk=&T=3

As an alternative you can also use a QR Code:  

The GUIDs for individual cells are displayed in the table below:

Kernel Density Values
x-valueGaussianEpanechnikovRectangularTriangularBiweightCosineOptcosine
Kernel Density Values are not shown


Parameters (Session):
Parameters (R input):
par1 = 0 ; par2 = no ; par3 = 512 ;
R code (references can be found in the software module):
if (par1 == '0') bw <- 'nrd0'
if (par1 != '0') bw <- as.numeric(par1)
par3 <- as.numeric(par3)
mydensity <- array(NA, dim=c(par3,8))
bitmap(file='density1.png')
mydensity1<-density(x,bw=bw,kernel='gaussian',na.rm=TRUE)
mydensity[,8] = signif(mydensity1$x,3)
mydensity[,1] = signif(mydensity1$y,3)
plot(mydensity1,main='Gaussian Kernel',xlab=xlab,ylab=ylab)
grid()
dev.off()
mydensity1
bitmap(file='density2.png')
mydensity2<-density(x,bw=bw,kernel='epanechnikov',na.rm=TRUE)
mydensity[,2] = signif(mydensity2$y,3)
plot(mydensity2,main='Epanechnikov Kernel',xlab=xlab,ylab=ylab)
grid()
dev.off()
bitmap(file='density3.png')
mydensity3<-density(x,bw=bw,kernel='rectangular',na.rm=TRUE)
mydensity[,3] = signif(mydensity3$y,3)
plot(mydensity3,main='Rectangular Kernel',xlab=xlab,ylab=ylab)
grid()
dev.off()
bitmap(file='density4.png')
mydensity4<-density(x,bw=bw,kernel='triangular',na.rm=TRUE)
mydensity[,4] = signif(mydensity4$y,3)
plot(mydensity4,main='Triangular Kernel',xlab=xlab,ylab=ylab)
grid()
dev.off()
bitmap(file='density5.png')
mydensity5<-density(x,bw=bw,kernel='biweight',na.rm=TRUE)
mydensity[,5] = signif(mydensity5$y,3)
plot(mydensity5,main='Biweight Kernel',xlab=xlab,ylab=ylab)
grid()
dev.off()
bitmap(file='density6.png')
mydensity6<-density(x,bw=bw,kernel='cosine',na.rm=TRUE)
mydensity[,6] = signif(mydensity6$y,3)
plot(mydensity6,main='Cosine Kernel',xlab=xlab,ylab=ylab)
grid()
dev.off()
bitmap(file='density7.png')
mydensity7<-density(x,bw=bw,kernel='optcosine',na.rm=TRUE)
mydensity[,7] = signif(mydensity7$y,3)
plot(mydensity7,main='Optcosine Kernel',xlab=xlab,ylab=ylab)
grid()
dev.off()
load(file='createtable')
ab<-table.start()
ab<-table.row.start(ab)
ab<-table.element(ab,'Properties of Density Trace',2,TRUE)
ab<-table.row.end(ab)
ab<-table.row.start(ab)
ab<-table.element(ab,'Bandwidth',header=TRUE)
ab<-table.element(ab,mydensity1$bw)
ab<-table.row.end(ab)
ab<-table.row.start(ab)
ab<-table.element(ab,'#Observations',header=TRUE)
ab<-table.element(ab,mydensity1$n)
ab<-table.row.end(ab)
ab<-table.end(ab)
a <- ab
table.save(ab,file='mytable123.tab')
b<-table.start()
b<-table.row.start(b)
b<-table.element(b,'Maximum Density Values',3,TRUE)
b<-table.row.end(b)
b<-table.row.start(b)
b<-table.element(b,'Kernel',1,TRUE)
b<-table.element(b,'x-value',1,TRUE)
b<-table.element(b,'max. density',1,TRUE)
b<-table.row.end(b)
b<-table.row.start(b)
b<-table.element(b,'Gaussian',1,TRUE)
b<-table.element(b,mydensity1$x[mydensity1$y==max(mydensity1$y)],1)
b<-table.element(b,mydensity1$y[mydensity1$y==max(mydensity1$y)],1)
b<-table.row.end(b)
b<-table.row.start(b)
b<-table.element(b,'Epanechnikov',1,TRUE)
b<-table.element(b,mydensity2$x[mydensity2$y==max(mydensity2$y)],1)
b<-table.element(b,mydensity2$y[mydensity2$y==max(mydensity2$y)],1)
b<-table.row.end(b)
b<-table.row.start(b)
b<-table.element(b,'Rectangular',1,TRUE)
b<-table.element(b,mydensity3$x[mydensity3$y==max(mydensity3$y)],1)
b<-table.element(b,mydensity3$y[mydensity3$y==max(mydensity3$y)],1)
b<-table.row.end(b)
b<-table.row.start(b)
b<-table.element(b,'Triangular',1,TRUE)
b<-table.element(b,mydensity4$x[mydensity4$y==max(mydensity4$y)],1)
b<-table.element(b,mydensity4$y[mydensity4$y==max(mydensity4$y)],1)
b<-table.row.end(b)
b<-table.row.start(b)
b<-table.element(b,'Biweight',1,TRUE)
b<-table.element(b,mydensity5$x[mydensity5$y==max(mydensity5$y)],1)
b<-table.element(b,mydensity5$y[mydensity5$y==max(mydensity5$y)],1)
b<-table.row.end(b)
b<-table.row.start(b)
b<-table.element(b,'Cosine',1,TRUE)
b<-table.element(b,mydensity6$x[mydensity6$y==max(mydensity6$y)],1)
b<-table.element(b,mydensity6$y[mydensity6$y==max(mydensity6$y)],1)
b<-table.row.end(b)
b<-table.row.start(b)
b<-table.element(b,'Optcosine',1,TRUE)
b<-table.element(b,mydensity7$x[mydensity7$y==max(mydensity7$y)],1)
b<-table.element(b,mydensity7$y[mydensity7$y==max(mydensity7$y)],1)
b<-table.row.end(b)
b<-table.end(b)
a <- b[1]
table.save(b,file='mytable2a.tab')
a<-table.start()
a<-table.row.start(a)
a<-table.element(a,'Kernel Density Values',8,TRUE)
a<-table.row.end(a)
a<-table.row.start(a)
a<-table.element(a,'x-value',1,TRUE)
a<-table.element(a,'Gaussian',1,TRUE)
a<-table.element(a,'Epanechnikov',1,TRUE)
a<-table.element(a,'Rectangular',1,TRUE)
a<-table.element(a,'Triangular',1,TRUE)
a<-table.element(a,'Biweight',1,TRUE)
a<-table.element(a,'Cosine',1,TRUE)
a<-table.element(a,'Optcosine',1,TRUE)
a<-table.row.end(a)
if (par2=='yes') {
for(i in 1:par3) {
a<-table.row.start(a)
a<-table.element(a,mydensity[i,8],1,TRUE)
for(j in 1:7) {
a<-table.element(a,mydensity[i,j],1)
}
a<-table.row.end(a)
}
} else {
a<-table.row.start(a)
a<-table.element(a,'Kernel Density Values are not shown',8)
a<-table.row.end(a)
}
a<-table.end(a)
table.save(a,file='mytable1.tab')