Free Statistics

of Irreproducible Research!

Author's title

Author*Unverified author*
R Software Modulerwasp_smp.wasp
Title produced by softwareStandard Deviation-Mean Plot
Date of computationTue, 16 Aug 2016 11:57:00 +0100
Cite this page as followsStatistical Computations at FreeStatistics.org, Office for Research Development and Education, URL https://freestatistics.org/blog/index.php?v=date/2016/Aug/16/t14713450544kimth9i6yu1r0i.htm/, Retrieved Sat, 04 May 2024 21:58:21 +0200
Statistical Computations at FreeStatistics.org, Office for Research Development and Education, URL https://freestatistics.org/blog/index.php?pk=, Retrieved Sat, 04 May 2024 21:58:21 +0200
QR Codes:

Original text written by user:
IsPrivate?No (this computation is public)
User-defined keywords
Estimated Impact0
Dataseries X:
2350
2375
2300
2325
2325
2250
2350
2100
2225
2125
2075
2350
2400
2250
2350
2300
2325
2425
2325
1950
2025
2175
1800
2200
2300
2300
2375
2375
2225
2400
1950
1950
1900
2150
1850
2550
2225
2600
2300
2250
2375
2475
2100
1850
2100
2400
1975
2525
2250
2425
2300
2450
2225
2500
2200
1850
2150
2350
1900
2525
2175
2450
2300
2375
2200
2450
2275
1825
2200
2050
1725
2475
2000
2400
2275
2375
2350
2525
2225
1650
2150
2100
1850
2450
2050
2700
2325
2425
2325
2525
2200
1850
2150
2025
1875
2225
1975
2500
2225
2425
2250
2475
2275
1825
2125
2100
2075
2375


Summary of computational transaction
Raw Inputview raw input (R code)
Raw Outputview raw output of R engine
Computing time1 seconds
R Server'Sir Ronald Aylmer Fisher' @ fisher.wessa.net

\begin{tabular}{lllllllll}
\hline
Summary of computational transaction \tabularnewline
Raw Input & view raw input (R code)  \tabularnewline
Raw Output & view raw output of R engine  \tabularnewline
Computing time & 1 seconds \tabularnewline
R Server & 'Sir Ronald Aylmer Fisher' @ fisher.wessa.net \tabularnewline
\hline
\end{tabular}
%Source: https://freestatistics.org/blog/index.php?pk=&T=0

[TABLE]
[ROW][C]Summary of computational transaction[/C][/ROW]
[ROW][C]Raw Input[/C][C]view raw input (R code) [/C][/ROW]
[ROW][C]Raw Output[/C][C]view raw output of R engine [/C][/ROW]
[ROW][C]Computing time[/C][C]1 seconds[/C][/ROW]
[ROW][C]R Server[/C][C]'Sir Ronald Aylmer Fisher' @ fisher.wessa.net[/C][/ROW]
[/TABLE]
Source: https://freestatistics.org/blog/index.php?pk=&T=0

Globally Unique Identifier (entire table): ba.freestatistics.org/blog/index.php?pk=&T=0

As an alternative you can also use a QR Code:  

The GUIDs for individual cells are displayed in the table below:

Summary of computational transaction
Raw Inputview raw input (R code)
Raw Outputview raw output of R engine
Computing time1 seconds
R Server'Sir Ronald Aylmer Fisher' @ fisher.wessa.net


Standard Deviation-Mean Plot
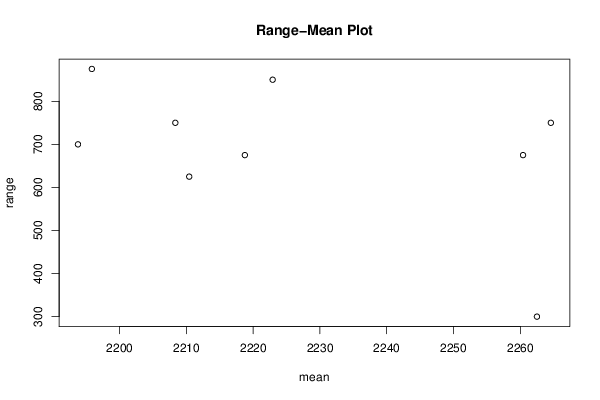
SectionMeanStandard DeviationRange
12262.5107.396885006461300
22210.41666666667192.90198091887625
32193.75230.396150930601700
42264.58333333333227.250945925957750
52260.41666666667216.495416005779675
62208.33333333333240.34381938205750
72195.83333333333260.208249933267875
82222.91666666667255.053099046715850
92218.75207.562969634847675

\begin{tabular}{lllllllll}
\hline
Standard Deviation-Mean Plot \tabularnewline
Section & Mean & Standard Deviation & Range \tabularnewline
1 & 2262.5 & 107.396885006461 & 300 \tabularnewline
2 & 2210.41666666667 & 192.90198091887 & 625 \tabularnewline
3 & 2193.75 & 230.396150930601 & 700 \tabularnewline
4 & 2264.58333333333 & 227.250945925957 & 750 \tabularnewline
5 & 2260.41666666667 & 216.495416005779 & 675 \tabularnewline
6 & 2208.33333333333 & 240.34381938205 & 750 \tabularnewline
7 & 2195.83333333333 & 260.208249933267 & 875 \tabularnewline
8 & 2222.91666666667 & 255.053099046715 & 850 \tabularnewline
9 & 2218.75 & 207.562969634847 & 675 \tabularnewline
\hline
\end{tabular}
%Source: https://freestatistics.org/blog/index.php?pk=&T=1

[TABLE]
[ROW][C]Standard Deviation-Mean Plot[/C][/ROW]
[ROW][C]Section[/C][C]Mean[/C][C]Standard Deviation[/C][C]Range[/C][/ROW]
[ROW][C]1[/C][C]2262.5[/C][C]107.396885006461[/C][C]300[/C][/ROW]
[ROW][C]2[/C][C]2210.41666666667[/C][C]192.90198091887[/C][C]625[/C][/ROW]
[ROW][C]3[/C][C]2193.75[/C][C]230.396150930601[/C][C]700[/C][/ROW]
[ROW][C]4[/C][C]2264.58333333333[/C][C]227.250945925957[/C][C]750[/C][/ROW]
[ROW][C]5[/C][C]2260.41666666667[/C][C]216.495416005779[/C][C]675[/C][/ROW]
[ROW][C]6[/C][C]2208.33333333333[/C][C]240.34381938205[/C][C]750[/C][/ROW]
[ROW][C]7[/C][C]2195.83333333333[/C][C]260.208249933267[/C][C]875[/C][/ROW]
[ROW][C]8[/C][C]2222.91666666667[/C][C]255.053099046715[/C][C]850[/C][/ROW]
[ROW][C]9[/C][C]2218.75[/C][C]207.562969634847[/C][C]675[/C][/ROW]
[/TABLE]
Source: https://freestatistics.org/blog/index.php?pk=&T=1

Globally Unique Identifier (entire table): ba.freestatistics.org/blog/index.php?pk=&T=1

As an alternative you can also use a QR Code:  

The GUIDs for individual cells are displayed in the table below:

Standard Deviation-Mean Plot
SectionMeanStandard DeviationRange
12262.5107.396885006461300
22210.41666666667192.90198091887625
32193.75230.396150930601700
42264.58333333333227.250945925957750
52260.41666666667216.495416005779675
62208.33333333333240.34381938205750
72195.83333333333260.208249933267875
82222.91666666667255.053099046715850
92218.75207.562969634847675


Regression: S.E.(k) = alpha + beta * Mean(k)
alpha2057.62461936424
beta-0.82749904217061
S.D.0.517137450209238
T-STAT-1.60015299962476
p-value0.153597847849157

\begin{tabular}{lllllllll}
\hline
Regression: S.E.(k) = alpha + beta * Mean(k) \tabularnewline
alpha & 2057.62461936424 \tabularnewline
beta & -0.82749904217061 \tabularnewline
S.D. & 0.517137450209238 \tabularnewline
T-STAT & -1.60015299962476 \tabularnewline
p-value & 0.153597847849157 \tabularnewline
\hline
\end{tabular}
%Source: https://freestatistics.org/blog/index.php?pk=&T=2

[TABLE]
[ROW][C]Regression: S.E.(k) = alpha + beta * Mean(k)[/C][/ROW]
[ROW][C]alpha[/C][C]2057.62461936424[/C][/ROW]
[ROW][C]beta[/C][C]-0.82749904217061[/C][/ROW]
[ROW][C]S.D.[/C][C]0.517137450209238[/C][/ROW]
[ROW][C]T-STAT[/C][C]-1.60015299962476[/C][/ROW]
[ROW][C]p-value[/C][C]0.153597847849157[/C][/ROW]
[/TABLE]
Source: https://freestatistics.org/blog/index.php?pk=&T=2

Globally Unique Identifier (entire table): ba.freestatistics.org/blog/index.php?pk=&T=2

As an alternative you can also use a QR Code:  

The GUIDs for individual cells are displayed in the table below:

Regression: S.E.(k) = alpha + beta * Mean(k)
alpha2057.62461936424
beta-0.82749904217061
S.D.0.517137450209238
T-STAT-1.60015299962476
p-value0.153597847849157


Regression: ln S.E.(k) = alpha + beta * ln Mean(k)
alpha87.5125227340907
beta-10.6599792892201
S.D.6.78041946243842
T-STAT-1.57217106526718
p-value0.159906974605254
Lambda11.6599792892201

\begin{tabular}{lllllllll}
\hline
Regression: ln S.E.(k) = alpha + beta * ln Mean(k) \tabularnewline
alpha & 87.5125227340907 \tabularnewline
beta & -10.6599792892201 \tabularnewline
S.D. & 6.78041946243842 \tabularnewline
T-STAT & -1.57217106526718 \tabularnewline
p-value & 0.159906974605254 \tabularnewline
Lambda & 11.6599792892201 \tabularnewline
\hline
\end{tabular}
%Source: https://freestatistics.org/blog/index.php?pk=&T=3

[TABLE]
[ROW][C]Regression: ln S.E.(k) = alpha + beta * ln Mean(k)[/C][/ROW]
[ROW][C]alpha[/C][C]87.5125227340907[/C][/ROW]
[ROW][C]beta[/C][C]-10.6599792892201[/C][/ROW]
[ROW][C]S.D.[/C][C]6.78041946243842[/C][/ROW]
[ROW][C]T-STAT[/C][C]-1.57217106526718[/C][/ROW]
[ROW][C]p-value[/C][C]0.159906974605254[/C][/ROW]
[ROW][C]Lambda[/C][C]11.6599792892201[/C][/ROW]
[/TABLE]
Source: https://freestatistics.org/blog/index.php?pk=&T=3

Globally Unique Identifier (entire table): ba.freestatistics.org/blog/index.php?pk=&T=3

As an alternative you can also use a QR Code:  

The GUIDs for individual cells are displayed in the table below:

Regression: ln S.E.(k) = alpha + beta * ln Mean(k)
alpha87.5125227340907
beta-10.6599792892201
S.D.6.78041946243842
T-STAT-1.57217106526718
p-value0.159906974605254
Lambda11.6599792892201


Parameters (Session):
Parameters (R input):
par1 = 12 ;
R code (references can be found in the software module):
par1 <- as.numeric(par1)
(n <- length(x))
(np <- floor(n / par1))
arr <- array(NA,dim=c(par1,np))
j <- 0
k <- 1
for (i in 1:(np*par1))
{
j = j + 1
arr[j,k] <- x[i]
if (j == par1) {
j = 0
k=k+1
}
}
arr
arr.mean <- array(NA,dim=np)
arr.sd <- array(NA,dim=np)
arr.range <- array(NA,dim=np)
for (j in 1:np)
{
arr.mean[j] <- mean(arr[,j],na.rm=TRUE)
arr.sd[j] <- sd(arr[,j],na.rm=TRUE)
arr.range[j] <- max(arr[,j],na.rm=TRUE) - min(arr[,j],na.rm=TRUE)
}
arr.mean
arr.sd
arr.range
(lm1 <- lm(arr.sd~arr.mean))
(lnlm1 <- lm(log(arr.sd)~log(arr.mean)))
(lm2 <- lm(arr.range~arr.mean))
bitmap(file='test1.png')
plot(arr.mean,arr.sd,main='Standard Deviation-Mean Plot',xlab='mean',ylab='standard deviation')
dev.off()
bitmap(file='test2.png')
plot(arr.mean,arr.range,main='Range-Mean Plot',xlab='mean',ylab='range')
dev.off()
load(file='createtable')
a<-table.start()
a<-table.row.start(a)
a<-table.element(a,'Standard Deviation-Mean Plot',4,TRUE)
a<-table.row.end(a)
a<-table.row.start(a)
a<-table.element(a,'Section',header=TRUE)
a<-table.element(a,'Mean',header=TRUE)
a<-table.element(a,'Standard Deviation',header=TRUE)
a<-table.element(a,'Range',header=TRUE)
a<-table.row.end(a)
for (j in 1:np) {
a<-table.row.start(a)
a<-table.element(a,j,header=TRUE)
a<-table.element(a,arr.mean[j])
a<-table.element(a,arr.sd[j] )
a<-table.element(a,arr.range[j] )
a<-table.row.end(a)
}
a<-table.end(a)
table.save(a,file='mytable.tab')
a<-table.start()
a<-table.row.start(a)
a<-table.element(a,'Regression: S.E.(k) = alpha + beta * Mean(k)',2,TRUE)
a<-table.row.end(a)
a<-table.row.start(a)
a<-table.element(a,'alpha',header=TRUE)
a<-table.element(a,lm1$coefficients[[1]])
a<-table.row.end(a)
a<-table.row.start(a)
a<-table.element(a,'beta',header=TRUE)
a<-table.element(a,lm1$coefficients[[2]])
a<-table.row.end(a)
a<-table.row.start(a)
a<-table.element(a,'S.D.',header=TRUE)
a<-table.element(a,summary(lm1)$coefficients[2,2])
a<-table.row.end(a)
a<-table.row.start(a)
a<-table.element(a,'T-STAT',header=TRUE)
a<-table.element(a,summary(lm1)$coefficients[2,3])
a<-table.row.end(a)
a<-table.row.start(a)
a<-table.element(a,'p-value',header=TRUE)
a<-table.element(a,summary(lm1)$coefficients[2,4])
a<-table.row.end(a)
a<-table.end(a)
table.save(a,file='mytable1.tab')
a<-table.start()
a<-table.row.start(a)
a<-table.element(a,'Regression: ln S.E.(k) = alpha + beta * ln Mean(k)',2,TRUE)
a<-table.row.end(a)
a<-table.row.start(a)
a<-table.element(a,'alpha',header=TRUE)
a<-table.element(a,lnlm1$coefficients[[1]])
a<-table.row.end(a)
a<-table.row.start(a)
a<-table.element(a,'beta',header=TRUE)
a<-table.element(a,lnlm1$coefficients[[2]])
a<-table.row.end(a)
a<-table.row.start(a)
a<-table.element(a,'S.D.',header=TRUE)
a<-table.element(a,summary(lnlm1)$coefficients[2,2])
a<-table.row.end(a)
a<-table.row.start(a)
a<-table.element(a,'T-STAT',header=TRUE)
a<-table.element(a,summary(lnlm1)$coefficients[2,3])
a<-table.row.end(a)
a<-table.row.start(a)
a<-table.element(a,'p-value',header=TRUE)
a<-table.element(a,summary(lnlm1)$coefficients[2,4])
a<-table.row.end(a)
a<-table.row.start(a)
a<-table.element(a,'Lambda',header=TRUE)
a<-table.element(a,1-lnlm1$coefficients[[2]])
a<-table.row.end(a)
a<-table.end(a)
table.save(a,file='mytable2.tab')