Free Statistics

of Irreproducible Research!

Author's title

Author*The author of this computation has been verified*
R Software Modulerwasp_harrell_davis.wasp
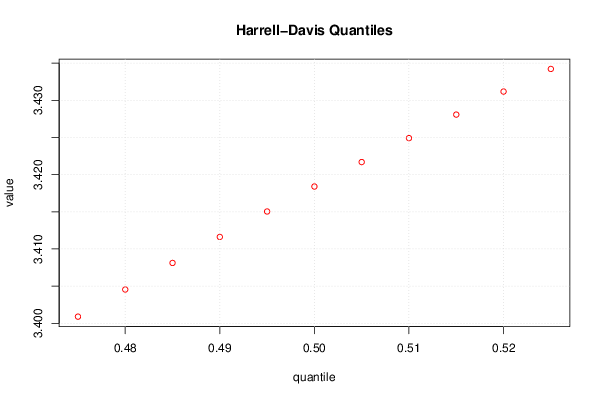
Title produced by softwareHarrell-Davis Quantiles
Date of computationWed, 31 Aug 2016 08:46:39 +0100
Cite this page as followsStatistical Computations at FreeStatistics.org, Office for Research Development and Education, URL https://freestatistics.org/blog/index.php?v=date/2016/Aug/31/t14726296433cb6j2eyf2kplvt.htm/, Retrieved Sun, 05 May 2024 18:16:27 +0200
Statistical Computations at FreeStatistics.org, Office for Research Development and Education, URL https://freestatistics.org/blog/index.php?pk=, Retrieved Sun, 05 May 2024 18:16:27 +0200
QR Codes:

Original text written by user:
IsPrivate?No (this computation is public)
User-defined keywords
Estimated Impact0
Dataseries X:
3.3
3.5
2.7
3.5
3.4
3.5
3.8
3.3
3.6
2.8


Summary of computational transaction
Raw Inputview raw input (R code)
Raw Outputview raw output of R engine
Computing time1 seconds
R Server'Gwilym Jenkins' @ jenkins.wessa.net

\begin{tabular}{lllllllll}
\hline
Summary of computational transaction \tabularnewline
Raw Input & view raw input (R code)  \tabularnewline
Raw Output & view raw output of R engine  \tabularnewline
Computing time & 1 seconds \tabularnewline
R Server & 'Gwilym Jenkins' @ jenkins.wessa.net \tabularnewline
\hline
\end{tabular}
%Source: https://freestatistics.org/blog/index.php?pk=&T=0

[TABLE]
[ROW][C]Summary of computational transaction[/C][/ROW]
[ROW][C]Raw Input[/C][C]view raw input (R code) [/C][/ROW]
[ROW][C]Raw Output[/C][C]view raw output of R engine [/C][/ROW]
[ROW][C]Computing time[/C][C]1 seconds[/C][/ROW]
[ROW][C]R Server[/C][C]'Gwilym Jenkins' @ jenkins.wessa.net[/C][/ROW]
[/TABLE]
Source: https://freestatistics.org/blog/index.php?pk=&T=0

Globally Unique Identifier (entire table): ba.freestatistics.org/blog/index.php?pk=&T=0

As an alternative you can also use a QR Code:  

The GUIDs for individual cells are displayed in the table below:

Summary of computational transaction
Raw Inputview raw input (R code)
Raw Outputview raw output of R engine
Computing time1 seconds
R Server'Gwilym Jenkins' @ jenkins.wessa.net


Harrell-Davis Quantiles
quantilesvaluestandard error
0.4753.40089221602760.0897011318809967
0.483.404541824185560.0882190133284568
0.4853.408114828984920.086755308560773
0.493.411613596156840.0853073357609525
0.4953.415040432413180.0838718640070402
0.53.418397592502970.0824466186028745
0.5053.421687286768890.0810308936196372
0.513.424911689116560.0796224289995122
0.5153.428072945311290.0782206194604166
0.523.431173181519270.0768253728862466
0.5253.43421451301290.0754361226764079

\begin{tabular}{lllllllll}
\hline
Harrell-Davis Quantiles \tabularnewline
quantiles & value & standard error \tabularnewline
0.475 & 3.4008922160276 & 0.0897011318809967 \tabularnewline
0.48 & 3.40454182418556 & 0.0882190133284568 \tabularnewline
0.485 & 3.40811482898492 & 0.086755308560773 \tabularnewline
0.49 & 3.41161359615684 & 0.0853073357609525 \tabularnewline
0.495 & 3.41504043241318 & 0.0838718640070402 \tabularnewline
0.5 & 3.41839759250297 & 0.0824466186028745 \tabularnewline
0.505 & 3.42168728676889 & 0.0810308936196372 \tabularnewline
0.51 & 3.42491168911656 & 0.0796224289995122 \tabularnewline
0.515 & 3.42807294531129 & 0.0782206194604166 \tabularnewline
0.52 & 3.43117318151927 & 0.0768253728862466 \tabularnewline
0.525 & 3.4342145130129 & 0.0754361226764079 \tabularnewline
\hline
\end{tabular}
%Source: https://freestatistics.org/blog/index.php?pk=&T=1

[TABLE]
[ROW][C]Harrell-Davis Quantiles[/C][/ROW]
[ROW][C]quantiles[/C][C]value[/C][C]standard error[/C][/ROW]
[ROW][C]0.475[/C][C]3.4008922160276[/C][C]0.0897011318809967[/C][/ROW]
[ROW][C]0.48[/C][C]3.40454182418556[/C][C]0.0882190133284568[/C][/ROW]
[ROW][C]0.485[/C][C]3.40811482898492[/C][C]0.086755308560773[/C][/ROW]
[ROW][C]0.49[/C][C]3.41161359615684[/C][C]0.0853073357609525[/C][/ROW]
[ROW][C]0.495[/C][C]3.41504043241318[/C][C]0.0838718640070402[/C][/ROW]
[ROW][C]0.5[/C][C]3.41839759250297[/C][C]0.0824466186028745[/C][/ROW]
[ROW][C]0.505[/C][C]3.42168728676889[/C][C]0.0810308936196372[/C][/ROW]
[ROW][C]0.51[/C][C]3.42491168911656[/C][C]0.0796224289995122[/C][/ROW]
[ROW][C]0.515[/C][C]3.42807294531129[/C][C]0.0782206194604166[/C][/ROW]
[ROW][C]0.52[/C][C]3.43117318151927[/C][C]0.0768253728862466[/C][/ROW]
[ROW][C]0.525[/C][C]3.4342145130129[/C][C]0.0754361226764079[/C][/ROW]
[/TABLE]
Source: https://freestatistics.org/blog/index.php?pk=&T=1

Globally Unique Identifier (entire table): ba.freestatistics.org/blog/index.php?pk=&T=1

As an alternative you can also use a QR Code:  

The GUIDs for individual cells are displayed in the table below:

Harrell-Davis Quantiles
quantilesvaluestandard error
0.4753.40089221602760.0897011318809967
0.483.404541824185560.0882190133284568
0.4853.408114828984920.086755308560773
0.493.411613596156840.0853073357609525
0.4953.415040432413180.0838718640070402
0.53.418397592502970.0824466186028745
0.5053.421687286768890.0810308936196372
0.513.424911689116560.0796224289995122
0.5153.428072945311290.0782206194604166
0.523.431173181519270.0768253728862466
0.5253.43421451301290.0754361226764079


Parameters (Session):
par1 = grey ; par2 = no ;
Parameters (R input):
par1 = 0.475 ; par2 = 0.525 ; par3 = 0.005 ;
R code (references can be found in the software module):
par1 <- as(par1,'numeric')
par2 <- as(par2,'numeric')
par3 <- as(par3,'numeric')
library(Hmisc)
myseq <- seq(par1, par2, par3)
hd <- hdquantile(x, probs = myseq, se = TRUE, na.rm = FALSE, names = TRUE, weights=FALSE)
bitmap(file='test1.png')
plot(myseq,hd,col=2,main=main,xlab=xlab,ylab=ylab)
grid()
dev.off()
load(file='createtable')
a<-table.start()
a<-table.row.start(a)
a<-table.element(a,'Harrell-Davis Quantiles',3,TRUE)
a<-table.row.end(a)
a<-table.row.start(a)
a<-table.element(a,'quantiles',header=TRUE)
a<-table.element(a,'value',header=TRUE)
a<-table.element(a,'standard error',header=TRUE)
a<-table.row.end(a)
length(hd)
for (i in 1:length(hd))
{
a<-table.row.start(a)
a<-table.element(a,as(labels(hd)[i],'numeric'),header=TRUE)
a<-table.element(a,as.matrix(hd[i])[1,1])
a<-table.element(a,as.matrix(attr(hd,'se')[i])[1,1])
a<-table.row.end(a)
}
a<-table.end(a)
table.save(a,file='mytable.tab')