Free Statistics

of Irreproducible Research!

Author's title

Author*The author of this computation has been verified*
R Software Modulerwasp_autocorrelation.wasp
Title produced by software(Partial) Autocorrelation Function
Date of computationTue, 06 Dec 2016 12:10:55 +0100
Cite this page as followsStatistical Computations at FreeStatistics.org, Office for Research Development and Education, URL https://freestatistics.org/blog/index.php?v=date/2016/Dec/06/t1481022688kbe7phq1ery8dfg.htm/, Retrieved Sat, 04 May 2024 10:14:30 +0000
Statistical Computations at FreeStatistics.org, Office for Research Development and Education, URL https://freestatistics.org/blog/index.php?pk=297787, Retrieved Sat, 04 May 2024 10:14:30 +0000
QR Codes:

Original text written by user:
IsPrivate?No (this computation is public)
User-defined keywords
Estimated Impact114
Family? (F = Feedback message, R = changed R code, M = changed R Module, P = changed Parameters, D = changed Data)
-       [(Partial) Autocorrelation Function] [] [2016-12-06 11:10:55] [219800a2f11ddd28e3280d87dbde8c8d] [Current]
Feedback Forum

Post a new message
Dataseries X:
-1.546
1.96
0.9041
0.5292
-1.222
3.157
-0.248
2.354
-1.646
-0.7949
2.231
4.328
0.2355
-1.345
-2.769
-0.3448
-0.769
-1.516
-5.918
1.555
2.157
-0.09593
-2.092
1.105
0.8303
4.004
-0.3925
2.354
3.354
-10.12
1.73
-1.092
-1.594
-0.8426
1.105
-0.3448
-1.646
0.9041
3.458
2.904
-9.646
-3.222
0.3308
1.655
1.406
-0.8947
0.2829
2.581
0.5057
-3.895
-0.09593
-3.17
-5.144
0.3541
1.454
1.205
0.2049
-0.04375
-1.743
-2.39
0.9821
-2.345
4.454
-2.821
-3.646
1.335
-1.921
4.056
1.231
-0.6953
0.8042
2.904
-0.7951
-2.843
0.3541
0.9344
-3.594
1.058
1.354
3.354
-1.345
-1.594
-1.791
3.458
-2.642
1.804
1.157
0.9083
-1.345
3.209
0.3541
-4.646
1.458
1.361
3.354
-0.1958
-1.542
-0.3448
1.105
1.904
-2.717
-0.672
-3.546
1.254
-2.345
1.157
0.3541
0.1351
2.804
-0.6459
-1.869
-0.9208
1.354
2.608
0.9041
0.9041
0.532
0.7069
-1.222
0.3541
1.904
0.7074
2.908
-2.267
-1.642
-0.672
1.209
-1.044
0.3065
3.209
2.354
-3.642
1.004
-1.096
0.1572
1.28
5.354
-0.3925
1.707
-0.7949
-0.5417
-5.293
-1.345
2.878
0.9041
0.454
-4.241
2.956
0.6592
-0.546
1.856
1.157
0.454
-0.3448
0.07916
-2.121


Summary of computational transaction
Raw Input view raw input (R code)
Raw Outputview raw output of R engine
Computing time1 seconds
R ServerBig Analytics Cloud Computing Center

\begin{tabular}{lllllllll}
\hline
Summary of computational transaction \tabularnewline
Raw Input view raw input (R code)  \tabularnewline
Raw Outputview raw output of R engine  \tabularnewline
Computing time1 seconds \tabularnewline
R ServerBig Analytics Cloud Computing Center \tabularnewline
\hline
\end{tabular}
%Source: https://freestatistics.org/blog/index.php?pk=297787&T=0

[TABLE]
[ROW]
Summary of computational transaction[/C][/ROW] [ROW]Raw Input[/C] view raw input (R code) [/C][/ROW] [ROW]Raw Output[/C]view raw output of R engine [/C][/ROW] [ROW]Computing time[/C]1 seconds[/C][/ROW] [ROW]R Server[/C]Big Analytics Cloud Computing Center[/C][/ROW] [/TABLE] Source: https://freestatistics.org/blog/index.php?pk=297787&T=0

Globally Unique Identifier (entire table): ba.freestatistics.org/blog/index.php?pk=297787&T=0

As an alternative you can also use a QR Code:  

The GUIDs for individual cells are displayed in the table below:

Summary of computational transaction
Raw Input view raw input (R code)
Raw Outputview raw output of R engine
Computing time1 seconds
R ServerBig Analytics Cloud Computing Center


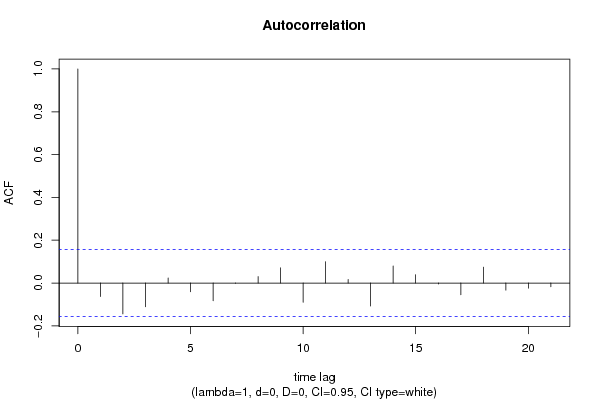
Autocorrelation Function
Time lag kACF(k)T-STATP-value
1-0.062879-0.78540.216717
2-0.144177-1.80080.036836
3-0.11074-1.38310.084299
40.0235860.29460.384351
5-0.040637-0.50760.30624
6-0.082415-1.02940.152451
7-0.001085-0.01360.494603
80.0299870.37450.354256
90.0711110.88820.187908
10-0.08949-1.11770.1327
110.099881.24750.107041
120.0168580.21060.416754
13-0.10717-1.33850.091333
140.0796280.99450.160748
150.0385690.48170.315339
16-0.004322-0.0540.47851
17-0.054633-0.68240.248011
180.0742670.92760.177524
19-0.033258-0.41540.339213
20-0.023818-0.29750.383247
21-0.017696-0.2210.41268

\begin{tabular}{lllllllll}
\hline
Autocorrelation Function \tabularnewline
Time lag k & ACF(k) & T-STAT & P-value \tabularnewline
1 & -0.062879 & -0.7854 & 0.216717 \tabularnewline
2 & -0.144177 & -1.8008 & 0.036836 \tabularnewline
3 & -0.11074 & -1.3831 & 0.084299 \tabularnewline
4 & 0.023586 & 0.2946 & 0.384351 \tabularnewline
5 & -0.040637 & -0.5076 & 0.30624 \tabularnewline
6 & -0.082415 & -1.0294 & 0.152451 \tabularnewline
7 & -0.001085 & -0.0136 & 0.494603 \tabularnewline
8 & 0.029987 & 0.3745 & 0.354256 \tabularnewline
9 & 0.071111 & 0.8882 & 0.187908 \tabularnewline
10 & -0.08949 & -1.1177 & 0.1327 \tabularnewline
11 & 0.09988 & 1.2475 & 0.107041 \tabularnewline
12 & 0.016858 & 0.2106 & 0.416754 \tabularnewline
13 & -0.10717 & -1.3385 & 0.091333 \tabularnewline
14 & 0.079628 & 0.9945 & 0.160748 \tabularnewline
15 & 0.038569 & 0.4817 & 0.315339 \tabularnewline
16 & -0.004322 & -0.054 & 0.47851 \tabularnewline
17 & -0.054633 & -0.6824 & 0.248011 \tabularnewline
18 & 0.074267 & 0.9276 & 0.177524 \tabularnewline
19 & -0.033258 & -0.4154 & 0.339213 \tabularnewline
20 & -0.023818 & -0.2975 & 0.383247 \tabularnewline
21 & -0.017696 & -0.221 & 0.41268 \tabularnewline
\hline
\end{tabular}
%Source: https://freestatistics.org/blog/index.php?pk=297787&T=1

[TABLE]
[ROW][C]Autocorrelation Function[/C][/ROW]
[ROW][C]Time lag k[/C][C]ACF(k)[/C][C]T-STAT[/C][C]P-value[/C][/ROW]
[ROW][C]1[/C][C]-0.062879[/C][C]-0.7854[/C][C]0.216717[/C][/ROW]
[ROW][C]2[/C][C]-0.144177[/C][C]-1.8008[/C][C]0.036836[/C][/ROW]
[ROW][C]3[/C][C]-0.11074[/C][C]-1.3831[/C][C]0.084299[/C][/ROW]
[ROW][C]4[/C][C]0.023586[/C][C]0.2946[/C][C]0.384351[/C][/ROW]
[ROW][C]5[/C][C]-0.040637[/C][C]-0.5076[/C][C]0.30624[/C][/ROW]
[ROW][C]6[/C][C]-0.082415[/C][C]-1.0294[/C][C]0.152451[/C][/ROW]
[ROW][C]7[/C][C]-0.001085[/C][C]-0.0136[/C][C]0.494603[/C][/ROW]
[ROW][C]8[/C][C]0.029987[/C][C]0.3745[/C][C]0.354256[/C][/ROW]
[ROW][C]9[/C][C]0.071111[/C][C]0.8882[/C][C]0.187908[/C][/ROW]
[ROW][C]10[/C][C]-0.08949[/C][C]-1.1177[/C][C]0.1327[/C][/ROW]
[ROW][C]11[/C][C]0.09988[/C][C]1.2475[/C][C]0.107041[/C][/ROW]
[ROW][C]12[/C][C]0.016858[/C][C]0.2106[/C][C]0.416754[/C][/ROW]
[ROW][C]13[/C][C]-0.10717[/C][C]-1.3385[/C][C]0.091333[/C][/ROW]
[ROW][C]14[/C][C]0.079628[/C][C]0.9945[/C][C]0.160748[/C][/ROW]
[ROW][C]15[/C][C]0.038569[/C][C]0.4817[/C][C]0.315339[/C][/ROW]
[ROW][C]16[/C][C]-0.004322[/C][C]-0.054[/C][C]0.47851[/C][/ROW]
[ROW][C]17[/C][C]-0.054633[/C][C]-0.6824[/C][C]0.248011[/C][/ROW]
[ROW][C]18[/C][C]0.074267[/C][C]0.9276[/C][C]0.177524[/C][/ROW]
[ROW][C]19[/C][C]-0.033258[/C][C]-0.4154[/C][C]0.339213[/C][/ROW]
[ROW][C]20[/C][C]-0.023818[/C][C]-0.2975[/C][C]0.383247[/C][/ROW]
[ROW][C]21[/C][C]-0.017696[/C][C]-0.221[/C][C]0.41268[/C][/ROW]
[/TABLE]
Source: https://freestatistics.org/blog/index.php?pk=297787&T=1

Globally Unique Identifier (entire table): ba.freestatistics.org/blog/index.php?pk=297787&T=1

As an alternative you can also use a QR Code:  

The GUIDs for individual cells are displayed in the table below:

Autocorrelation Function
Time lag kACF(k)T-STATP-value
1-0.062879-0.78540.216717
2-0.144177-1.80080.036836
3-0.11074-1.38310.084299
40.0235860.29460.384351
5-0.040637-0.50760.30624
6-0.082415-1.02940.152451
7-0.001085-0.01360.494603
80.0299870.37450.354256
90.0711110.88820.187908
10-0.08949-1.11770.1327
110.099881.24750.107041
120.0168580.21060.416754
13-0.10717-1.33850.091333
140.0796280.99450.160748
150.0385690.48170.315339
16-0.004322-0.0540.47851
17-0.054633-0.68240.248011
180.0742670.92760.177524
19-0.033258-0.41540.339213
20-0.023818-0.29750.383247
21-0.017696-0.2210.41268


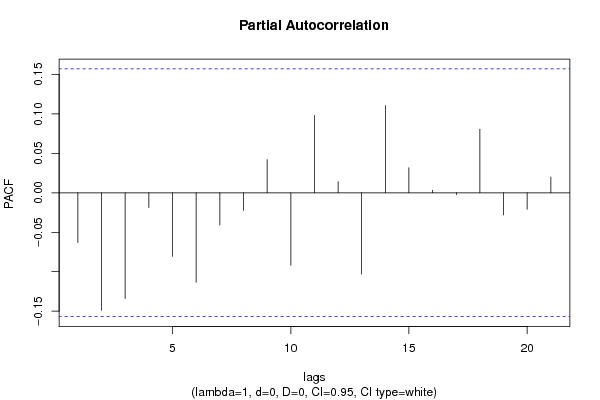
Partial Autocorrelation Function
Time lag kPACF(k)T-STATP-value
1-0.062879-0.78540.216717
2-0.148718-1.85750.032563
3-0.133987-1.67350.048117
4-0.018694-0.23350.407843
5-0.080543-1.0060.157991
6-0.113249-1.41450.079607
7-0.040903-0.51090.30508
8-0.02231-0.27870.390438
90.0420740.52550.299988
10-0.091809-1.14670.126631
110.0978951.22270.111641
120.0140240.17520.430589
13-0.102847-1.28460.100425
140.1104821.37990.084794
150.0317770.39690.345992
160.0032380.04040.483898
17-0.002307-0.02880.488525
180.0805241.00570.158049
19-0.027975-0.34940.363629
20-0.020957-0.26180.396927
210.0198360.24780.402324

\begin{tabular}{lllllllll}
\hline
Partial Autocorrelation Function \tabularnewline
Time lag k & PACF(k) & T-STAT & P-value \tabularnewline
1 & -0.062879 & -0.7854 & 0.216717 \tabularnewline
2 & -0.148718 & -1.8575 & 0.032563 \tabularnewline
3 & -0.133987 & -1.6735 & 0.048117 \tabularnewline
4 & -0.018694 & -0.2335 & 0.407843 \tabularnewline
5 & -0.080543 & -1.006 & 0.157991 \tabularnewline
6 & -0.113249 & -1.4145 & 0.079607 \tabularnewline
7 & -0.040903 & -0.5109 & 0.30508 \tabularnewline
8 & -0.02231 & -0.2787 & 0.390438 \tabularnewline
9 & 0.042074 & 0.5255 & 0.299988 \tabularnewline
10 & -0.091809 & -1.1467 & 0.126631 \tabularnewline
11 & 0.097895 & 1.2227 & 0.111641 \tabularnewline
12 & 0.014024 & 0.1752 & 0.430589 \tabularnewline
13 & -0.102847 & -1.2846 & 0.100425 \tabularnewline
14 & 0.110482 & 1.3799 & 0.084794 \tabularnewline
15 & 0.031777 & 0.3969 & 0.345992 \tabularnewline
16 & 0.003238 & 0.0404 & 0.483898 \tabularnewline
17 & -0.002307 & -0.0288 & 0.488525 \tabularnewline
18 & 0.080524 & 1.0057 & 0.158049 \tabularnewline
19 & -0.027975 & -0.3494 & 0.363629 \tabularnewline
20 & -0.020957 & -0.2618 & 0.396927 \tabularnewline
21 & 0.019836 & 0.2478 & 0.402324 \tabularnewline
\hline
\end{tabular}
%Source: https://freestatistics.org/blog/index.php?pk=297787&T=2

[TABLE]
[ROW][C]Partial Autocorrelation Function[/C][/ROW]
[ROW][C]Time lag k[/C][C]PACF(k)[/C][C]T-STAT[/C][C]P-value[/C][/ROW]
[ROW][C]1[/C][C]-0.062879[/C][C]-0.7854[/C][C]0.216717[/C][/ROW]
[ROW][C]2[/C][C]-0.148718[/C][C]-1.8575[/C][C]0.032563[/C][/ROW]
[ROW][C]3[/C][C]-0.133987[/C][C]-1.6735[/C][C]0.048117[/C][/ROW]
[ROW][C]4[/C][C]-0.018694[/C][C]-0.2335[/C][C]0.407843[/C][/ROW]
[ROW][C]5[/C][C]-0.080543[/C][C]-1.006[/C][C]0.157991[/C][/ROW]
[ROW][C]6[/C][C]-0.113249[/C][C]-1.4145[/C][C]0.079607[/C][/ROW]
[ROW][C]7[/C][C]-0.040903[/C][C]-0.5109[/C][C]0.30508[/C][/ROW]
[ROW][C]8[/C][C]-0.02231[/C][C]-0.2787[/C][C]0.390438[/C][/ROW]
[ROW][C]9[/C][C]0.042074[/C][C]0.5255[/C][C]0.299988[/C][/ROW]
[ROW][C]10[/C][C]-0.091809[/C][C]-1.1467[/C][C]0.126631[/C][/ROW]
[ROW][C]11[/C][C]0.097895[/C][C]1.2227[/C][C]0.111641[/C][/ROW]
[ROW][C]12[/C][C]0.014024[/C][C]0.1752[/C][C]0.430589[/C][/ROW]
[ROW][C]13[/C][C]-0.102847[/C][C]-1.2846[/C][C]0.100425[/C][/ROW]
[ROW][C]14[/C][C]0.110482[/C][C]1.3799[/C][C]0.084794[/C][/ROW]
[ROW][C]15[/C][C]0.031777[/C][C]0.3969[/C][C]0.345992[/C][/ROW]
[ROW][C]16[/C][C]0.003238[/C][C]0.0404[/C][C]0.483898[/C][/ROW]
[ROW][C]17[/C][C]-0.002307[/C][C]-0.0288[/C][C]0.488525[/C][/ROW]
[ROW][C]18[/C][C]0.080524[/C][C]1.0057[/C][C]0.158049[/C][/ROW]
[ROW][C]19[/C][C]-0.027975[/C][C]-0.3494[/C][C]0.363629[/C][/ROW]
[ROW][C]20[/C][C]-0.020957[/C][C]-0.2618[/C][C]0.396927[/C][/ROW]
[ROW][C]21[/C][C]0.019836[/C][C]0.2478[/C][C]0.402324[/C][/ROW]
[/TABLE]
Source: https://freestatistics.org/blog/index.php?pk=297787&T=2

Globally Unique Identifier (entire table): ba.freestatistics.org/blog/index.php?pk=297787&T=2

As an alternative you can also use a QR Code:  

The GUIDs for individual cells are displayed in the table below:

Partial Autocorrelation Function
Time lag kPACF(k)T-STATP-value
1-0.062879-0.78540.216717
2-0.148718-1.85750.032563
3-0.133987-1.67350.048117
4-0.018694-0.23350.407843
5-0.080543-1.0060.157991
6-0.113249-1.41450.079607
7-0.040903-0.51090.30508
8-0.02231-0.27870.390438
90.0420740.52550.299988
10-0.091809-1.14670.126631
110.0978951.22270.111641
120.0140240.17520.430589
13-0.102847-1.28460.100425
140.1104821.37990.084794
150.0317770.39690.345992
160.0032380.04040.483898
17-0.002307-0.02880.488525
180.0805241.00570.158049
19-0.027975-0.34940.363629
20-0.020957-0.26180.396927
210.0198360.24780.402324


Parameters (Session):
par1 = Default ; par2 = 1 ; par3 = 0 ; par4 = 0 ; par5 = 12 ; par6 = White Noise ; par7 = 0.95 ;
Parameters (R input):
par1 = Default ; par2 = 1 ; par3 = 0 ; par4 = 0 ; par5 = 12 ; par6 = White Noise ; par7 = 0.95 ; par8 = ;
R code (references can be found in the software module):
if (par1 == 'Default') {
par1 = 10*log10(length(x))
} else {
par1 <- as.numeric(par1)
}
par2 <- as.numeric(par2)
par3 <- as.numeric(par3)
par4 <- as.numeric(par4)
par5 <- as.numeric(par5)
if (par6 == 'White Noise') par6 <- 'white' else par6 <- 'ma'
par7 <- as.numeric(par7)
if (par8 != '') par8 <- as.numeric(par8)
x <- na.omit(x)
ox <- x
if (par8 == '') {
if (par2 == 0) {
x <- log(x)
} else {
x <- (x ^ par2 - 1) / par2
}
} else {
x <- log(x,base=par8)
}
if (par3 > 0) x <- diff(x,lag=1,difference=par3)
if (par4 > 0) x <- diff(x,lag=par5,difference=par4)
bitmap(file='picts.png')
op <- par(mfrow=c(2,1))
plot(ox,type='l',main='Original Time Series',xlab='time',ylab='value')
if (par8=='') {
mytitle <- paste('Working Time Series (lambda=',par2,', d=',par3,', D=',par4,')',sep='')
mysub <- paste('(lambda=',par2,', d=',par3,', D=',par4,', CI=', par7, ', CI type=',par6,')',sep='')
} else {
mytitle <- paste('Working Time Series (base=',par8,', d=',par3,', D=',par4,')',sep='')
mysub <- paste('(base=',par8,', d=',par3,', D=',par4,', CI=', par7, ', CI type=',par6,')',sep='')
}
plot(x,type='l', main=mytitle,xlab='time',ylab='value')
par(op)
dev.off()
bitmap(file='pic1.png')
racf <- acf(x, par1, main='Autocorrelation', xlab='time lag', ylab='ACF', ci.type=par6, ci=par7, sub=mysub)
dev.off()
bitmap(file='pic2.png')
rpacf <- pacf(x,par1,main='Partial Autocorrelation',xlab='lags',ylab='PACF',sub=mysub)
dev.off()
(myacf <- c(racf$acf))
(mypacf <- c(rpacf$acf))
lengthx <- length(x)
sqrtn <- sqrt(lengthx)
load(file='createtable')
a<-table.start()
a<-table.row.start(a)
a<-table.element(a,'Autocorrelation Function',4,TRUE)
a<-table.row.end(a)
a<-table.row.start(a)
a<-table.element(a,'Time lag k',header=TRUE)
a<-table.element(a,'ACF(k)',header=TRUE)
a<-table.element(a,'T-STAT',header=TRUE)
a<-table.element(a,'P-value',header=TRUE)
a<-table.row.end(a)
for (i in 2:(par1+1)) {
a<-table.row.start(a)
a<-table.element(a,i-1,header=TRUE)
a<-table.element(a,round(myacf[i],6))
mytstat <- myacf[i]*sqrtn
a<-table.element(a,round(mytstat,4))
a<-table.element(a,round(1-pt(abs(mytstat),lengthx),6))
a<-table.row.end(a)
}
a<-table.end(a)
table.save(a,file='mytable.tab')
a<-table.start()
a<-table.row.start(a)
a<-table.element(a,'Partial Autocorrelation Function',4,TRUE)
a<-table.row.end(a)
a<-table.row.start(a)
a<-table.element(a,'Time lag k',header=TRUE)
a<-table.element(a,'PACF(k)',header=TRUE)
a<-table.element(a,'T-STAT',header=TRUE)
a<-table.element(a,'P-value',header=TRUE)
a<-table.row.end(a)
for (i in 1:par1) {
a<-table.row.start(a)
a<-table.element(a,i,header=TRUE)
a<-table.element(a,round(mypacf[i],6))
mytstat <- mypacf[i]*sqrtn
a<-table.element(a,round(mytstat,4))
a<-table.element(a,round(1-pt(abs(mytstat),lengthx),6))
a<-table.row.end(a)
}
a<-table.end(a)
table.save(a,file='mytable1.tab')