Free Statistics

of Irreproducible Research!

Author's title

Author*The author of this computation has been verified*
R Software Modulerwasp_exponentialsmoothing.wasp
Title produced by softwareExponential Smoothing
Date of computationWed, 07 Dec 2016 11:33:49 +0100
Cite this page as followsStatistical Computations at FreeStatistics.org, Office for Research Development and Education, URL https://freestatistics.org/blog/index.php?v=date/2016/Dec/07/t1481106881edx0tb1uyicej3q.htm/, Retrieved Tue, 07 May 2024 22:07:46 +0000
Statistical Computations at FreeStatistics.org, Office for Research Development and Education, URL https://freestatistics.org/blog/index.php?pk=297979, Retrieved Tue, 07 May 2024 22:07:46 +0000
QR Codes:

Original text written by user:
IsPrivate?No (this computation is public)
User-defined keywords
Estimated Impact111
Family? (F = Feedback message, R = changed R code, M = changed R Module, P = changed Parameters, D = changed Data)
-       [Exponential Smoothing] [Exponential smoot...] [2016-12-07 10:33:49] [fd005a509166a1985dac46f39e8d81c5] [Current]
Feedback Forum

Post a new message
Dataseries X:
6908
6694
6564
6800
6820
6752
6632
6756
6898
6844
6750
6892
7104
7022
6858
7018
7218
7134
7006
7160
7374
7276
7128
7272
7462
7366
7218
7366
7546
7464
7332
7502
7736
7628
7494
7668
7888
7774
7644
7826
8056
7990
7814
7978
8238
8138
8000
8176
8412
8332
8194
8354
8576
8500
8376
8538


Summary of computational transaction
Raw Input view raw input (R code)
Raw Outputview raw output of R engine
Computing time1 seconds
R ServerBig Analytics Cloud Computing Center

\begin{tabular}{lllllllll}
\hline
Summary of computational transaction \tabularnewline
Raw Input view raw input (R code)  \tabularnewline
Raw Outputview raw output of R engine  \tabularnewline
Computing time1 seconds \tabularnewline
R ServerBig Analytics Cloud Computing Center \tabularnewline
\hline
\end{tabular}
%Source: https://freestatistics.org/blog/index.php?pk=297979&T=0

[TABLE]
[ROW]
Summary of computational transaction[/C][/ROW] [ROW]Raw Input[/C] view raw input (R code) [/C][/ROW] [ROW]Raw Output[/C]view raw output of R engine [/C][/ROW] [ROW]Computing time[/C]1 seconds[/C][/ROW] [ROW]R Server[/C]Big Analytics Cloud Computing Center[/C][/ROW] [/TABLE] Source: https://freestatistics.org/blog/index.php?pk=297979&T=0

Globally Unique Identifier (entire table): ba.freestatistics.org/blog/index.php?pk=297979&T=0

As an alternative you can also use a QR Code:  

The GUIDs for individual cells are displayed in the table below:

Summary of computational transaction
Raw Input view raw input (R code)
Raw Outputview raw output of R engine
Computing time1 seconds
R ServerBig Analytics Cloud Computing Center


Estimated Parameters of Exponential Smoothing
ParameterValue
alpha0.815225442321146
beta0.0280712260414709
gamma1

\begin{tabular}{lllllllll}
\hline
Estimated Parameters of Exponential Smoothing \tabularnewline
Parameter & Value \tabularnewline
alpha & 0.815225442321146 \tabularnewline
beta & 0.0280712260414709 \tabularnewline
gamma & 1 \tabularnewline
\hline
\end{tabular}
%Source: https://freestatistics.org/blog/index.php?pk=297979&T=1

[TABLE]
[ROW][C]Estimated Parameters of Exponential Smoothing[/C][/ROW]
[ROW][C]Parameter[/C][C]Value[/C][/ROW]
[ROW][C]alpha[/C][C]0.815225442321146[/C][/ROW]
[ROW][C]beta[/C][C]0.0280712260414709[/C][/ROW]
[ROW][C]gamma[/C][C]1[/C][/ROW]
[/TABLE]
Source: https://freestatistics.org/blog/index.php?pk=297979&T=1

Globally Unique Identifier (entire table): ba.freestatistics.org/blog/index.php?pk=297979&T=1

As an alternative you can also use a QR Code:  

The GUIDs for individual cells are displayed in the table below:

Estimated Parameters of Exponential Smoothing
ParameterValue
alpha0.815225442321146
beta0.0280712260414709
gamma1


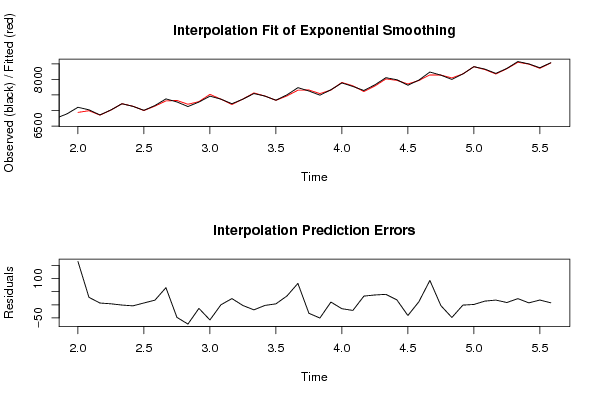
Interpolation Forecasts of Exponential Smoothing
tObservedFittedResiduals
1371046939.00320512821164.996794871791
1470226993.5683594564128.431640543592
1568586851.202765841616.79723415838816
1670187014.189137518983.81086248101838
1772187218.91148557432-0.91148557431643
1871347137.92986323399-3.92986323399145
1970066998.980983489887.01901651012213
2071607142.2852015694117.7147984305921
2173747308.6309520002665.3690479997422
2272767323.90492243004-47.9049224300361
2371287201.40546254244-73.405462542436
2472727285.60414190136-13.6041419013636
2574627519.73026680107-57.7302668010661
2673667365.924888340380.0751116596202337
2772187194.231922102323.768077897701
2873667368.67699811462-2.67699811462171
2975467565.26468296767-19.2646829676705
3074647466.37032186148-2.37032186147826
3173327328.358557562253.64144243774626
3275027468.4509692452433.5490307547598
3377367654.4382077117981.5617922882093
3476287660.28105445934-32.281054459344
3574947544.46254769983-50.4625476998326
3676687657.595501328310.4044986717017
3778887902.87098224518-14.8709822451829
3877747795.39764088185-21.3976408818453
3976447610.7971018845233.2028981154754
4078267788.482920220737.5170797792953
4180568016.128288391939.8717116080952
4279907971.27379891918.7262010810009
4378147854.76278886203-40.7627888620282
4479787966.3572505519811.6427494480204
4582388145.0315040179792.9684959820333
4681388141.07319558437-3.07319558436939
4780008048.30967620463-48.3096762046316
4881768177.09712922554-1.09712922553626
4984128410.715459254351.28454074564797
5083328317.9657945023614.0342054976427
5181948175.9090680361518.0909319638504
5283548345.29662960198.70337039810329
5385768552.4522725563123.5477274436889
5485008492.574207003117.42579299688805
5583768357.7914656426118.2085343573926
5685388530.42628326037.57371673970192

\begin{tabular}{lllllllll}
\hline
Interpolation Forecasts of Exponential Smoothing \tabularnewline
t & Observed & Fitted & Residuals \tabularnewline
13 & 7104 & 6939.00320512821 & 164.996794871791 \tabularnewline
14 & 7022 & 6993.56835945641 & 28.431640543592 \tabularnewline
15 & 6858 & 6851.20276584161 & 6.79723415838816 \tabularnewline
16 & 7018 & 7014.18913751898 & 3.81086248101838 \tabularnewline
17 & 7218 & 7218.91148557432 & -0.91148557431643 \tabularnewline
18 & 7134 & 7137.92986323399 & -3.92986323399145 \tabularnewline
19 & 7006 & 6998.98098348988 & 7.01901651012213 \tabularnewline
20 & 7160 & 7142.28520156941 & 17.7147984305921 \tabularnewline
21 & 7374 & 7308.63095200026 & 65.3690479997422 \tabularnewline
22 & 7276 & 7323.90492243004 & -47.9049224300361 \tabularnewline
23 & 7128 & 7201.40546254244 & -73.405462542436 \tabularnewline
24 & 7272 & 7285.60414190136 & -13.6041419013636 \tabularnewline
25 & 7462 & 7519.73026680107 & -57.7302668010661 \tabularnewline
26 & 7366 & 7365.92488834038 & 0.0751116596202337 \tabularnewline
27 & 7218 & 7194.2319221023 & 23.768077897701 \tabularnewline
28 & 7366 & 7368.67699811462 & -2.67699811462171 \tabularnewline
29 & 7546 & 7565.26468296767 & -19.2646829676705 \tabularnewline
30 & 7464 & 7466.37032186148 & -2.37032186147826 \tabularnewline
31 & 7332 & 7328.35855756225 & 3.64144243774626 \tabularnewline
32 & 7502 & 7468.45096924524 & 33.5490307547598 \tabularnewline
33 & 7736 & 7654.43820771179 & 81.5617922882093 \tabularnewline
34 & 7628 & 7660.28105445934 & -32.281054459344 \tabularnewline
35 & 7494 & 7544.46254769983 & -50.4625476998326 \tabularnewline
36 & 7668 & 7657.5955013283 & 10.4044986717017 \tabularnewline
37 & 7888 & 7902.87098224518 & -14.8709822451829 \tabularnewline
38 & 7774 & 7795.39764088185 & -21.3976408818453 \tabularnewline
39 & 7644 & 7610.79710188452 & 33.2028981154754 \tabularnewline
40 & 7826 & 7788.4829202207 & 37.5170797792953 \tabularnewline
41 & 8056 & 8016.1282883919 & 39.8717116080952 \tabularnewline
42 & 7990 & 7971.273798919 & 18.7262010810009 \tabularnewline
43 & 7814 & 7854.76278886203 & -40.7627888620282 \tabularnewline
44 & 7978 & 7966.35725055198 & 11.6427494480204 \tabularnewline
45 & 8238 & 8145.03150401797 & 92.9684959820333 \tabularnewline
46 & 8138 & 8141.07319558437 & -3.07319558436939 \tabularnewline
47 & 8000 & 8048.30967620463 & -48.3096762046316 \tabularnewline
48 & 8176 & 8177.09712922554 & -1.09712922553626 \tabularnewline
49 & 8412 & 8410.71545925435 & 1.28454074564797 \tabularnewline
50 & 8332 & 8317.96579450236 & 14.0342054976427 \tabularnewline
51 & 8194 & 8175.90906803615 & 18.0909319638504 \tabularnewline
52 & 8354 & 8345.2966296019 & 8.70337039810329 \tabularnewline
53 & 8576 & 8552.45227255631 & 23.5477274436889 \tabularnewline
54 & 8500 & 8492.57420700311 & 7.42579299688805 \tabularnewline
55 & 8376 & 8357.79146564261 & 18.2085343573926 \tabularnewline
56 & 8538 & 8530.4262832603 & 7.57371673970192 \tabularnewline
\hline
\end{tabular}
%Source: https://freestatistics.org/blog/index.php?pk=297979&T=2

[TABLE]
[ROW][C]Interpolation Forecasts of Exponential Smoothing[/C][/ROW]
[ROW][C]t[/C][C]Observed[/C][C]Fitted[/C][C]Residuals[/C][/ROW]
[ROW][C]13[/C][C]7104[/C][C]6939.00320512821[/C][C]164.996794871791[/C][/ROW]
[ROW][C]14[/C][C]7022[/C][C]6993.56835945641[/C][C]28.431640543592[/C][/ROW]
[ROW][C]15[/C][C]6858[/C][C]6851.20276584161[/C][C]6.79723415838816[/C][/ROW]
[ROW][C]16[/C][C]7018[/C][C]7014.18913751898[/C][C]3.81086248101838[/C][/ROW]
[ROW][C]17[/C][C]7218[/C][C]7218.91148557432[/C][C]-0.91148557431643[/C][/ROW]
[ROW][C]18[/C][C]7134[/C][C]7137.92986323399[/C][C]-3.92986323399145[/C][/ROW]
[ROW][C]19[/C][C]7006[/C][C]6998.98098348988[/C][C]7.01901651012213[/C][/ROW]
[ROW][C]20[/C][C]7160[/C][C]7142.28520156941[/C][C]17.7147984305921[/C][/ROW]
[ROW][C]21[/C][C]7374[/C][C]7308.63095200026[/C][C]65.3690479997422[/C][/ROW]
[ROW][C]22[/C][C]7276[/C][C]7323.90492243004[/C][C]-47.9049224300361[/C][/ROW]
[ROW][C]23[/C][C]7128[/C][C]7201.40546254244[/C][C]-73.405462542436[/C][/ROW]
[ROW][C]24[/C][C]7272[/C][C]7285.60414190136[/C][C]-13.6041419013636[/C][/ROW]
[ROW][C]25[/C][C]7462[/C][C]7519.73026680107[/C][C]-57.7302668010661[/C][/ROW]
[ROW][C]26[/C][C]7366[/C][C]7365.92488834038[/C][C]0.0751116596202337[/C][/ROW]
[ROW][C]27[/C][C]7218[/C][C]7194.2319221023[/C][C]23.768077897701[/C][/ROW]
[ROW][C]28[/C][C]7366[/C][C]7368.67699811462[/C][C]-2.67699811462171[/C][/ROW]
[ROW][C]29[/C][C]7546[/C][C]7565.26468296767[/C][C]-19.2646829676705[/C][/ROW]
[ROW][C]30[/C][C]7464[/C][C]7466.37032186148[/C][C]-2.37032186147826[/C][/ROW]
[ROW][C]31[/C][C]7332[/C][C]7328.35855756225[/C][C]3.64144243774626[/C][/ROW]
[ROW][C]32[/C][C]7502[/C][C]7468.45096924524[/C][C]33.5490307547598[/C][/ROW]
[ROW][C]33[/C][C]7736[/C][C]7654.43820771179[/C][C]81.5617922882093[/C][/ROW]
[ROW][C]34[/C][C]7628[/C][C]7660.28105445934[/C][C]-32.281054459344[/C][/ROW]
[ROW][C]35[/C][C]7494[/C][C]7544.46254769983[/C][C]-50.4625476998326[/C][/ROW]
[ROW][C]36[/C][C]7668[/C][C]7657.5955013283[/C][C]10.4044986717017[/C][/ROW]
[ROW][C]37[/C][C]7888[/C][C]7902.87098224518[/C][C]-14.8709822451829[/C][/ROW]
[ROW][C]38[/C][C]7774[/C][C]7795.39764088185[/C][C]-21.3976408818453[/C][/ROW]
[ROW][C]39[/C][C]7644[/C][C]7610.79710188452[/C][C]33.2028981154754[/C][/ROW]
[ROW][C]40[/C][C]7826[/C][C]7788.4829202207[/C][C]37.5170797792953[/C][/ROW]
[ROW][C]41[/C][C]8056[/C][C]8016.1282883919[/C][C]39.8717116080952[/C][/ROW]
[ROW][C]42[/C][C]7990[/C][C]7971.273798919[/C][C]18.7262010810009[/C][/ROW]
[ROW][C]43[/C][C]7814[/C][C]7854.76278886203[/C][C]-40.7627888620282[/C][/ROW]
[ROW][C]44[/C][C]7978[/C][C]7966.35725055198[/C][C]11.6427494480204[/C][/ROW]
[ROW][C]45[/C][C]8238[/C][C]8145.03150401797[/C][C]92.9684959820333[/C][/ROW]
[ROW][C]46[/C][C]8138[/C][C]8141.07319558437[/C][C]-3.07319558436939[/C][/ROW]
[ROW][C]47[/C][C]8000[/C][C]8048.30967620463[/C][C]-48.3096762046316[/C][/ROW]
[ROW][C]48[/C][C]8176[/C][C]8177.09712922554[/C][C]-1.09712922553626[/C][/ROW]
[ROW][C]49[/C][C]8412[/C][C]8410.71545925435[/C][C]1.28454074564797[/C][/ROW]
[ROW][C]50[/C][C]8332[/C][C]8317.96579450236[/C][C]14.0342054976427[/C][/ROW]
[ROW][C]51[/C][C]8194[/C][C]8175.90906803615[/C][C]18.0909319638504[/C][/ROW]
[ROW][C]52[/C][C]8354[/C][C]8345.2966296019[/C][C]8.70337039810329[/C][/ROW]
[ROW][C]53[/C][C]8576[/C][C]8552.45227255631[/C][C]23.5477274436889[/C][/ROW]
[ROW][C]54[/C][C]8500[/C][C]8492.57420700311[/C][C]7.42579299688805[/C][/ROW]
[ROW][C]55[/C][C]8376[/C][C]8357.79146564261[/C][C]18.2085343573926[/C][/ROW]
[ROW][C]56[/C][C]8538[/C][C]8530.4262832603[/C][C]7.57371673970192[/C][/ROW]
[/TABLE]
Source: https://freestatistics.org/blog/index.php?pk=297979&T=2

Globally Unique Identifier (entire table): ba.freestatistics.org/blog/index.php?pk=297979&T=2

As an alternative you can also use a QR Code:  

The GUIDs for individual cells are displayed in the table below:

Interpolation Forecasts of Exponential Smoothing
tObservedFittedResiduals
1371046939.00320512821164.996794871791
1470226993.5683594564128.431640543592
1568586851.202765841616.79723415838816
1670187014.189137518983.81086248101838
1772187218.91148557432-0.91148557431643
1871347137.92986323399-3.92986323399145
1970066998.980983489887.01901651012213
2071607142.2852015694117.7147984305921
2173747308.6309520002665.3690479997422
2272767323.90492243004-47.9049224300361
2371287201.40546254244-73.405462542436
2472727285.60414190136-13.6041419013636
2574627519.73026680107-57.7302668010661
2673667365.924888340380.0751116596202337
2772187194.231922102323.768077897701
2873667368.67699811462-2.67699811462171
2975467565.26468296767-19.2646829676705
3074647466.37032186148-2.37032186147826
3173327328.358557562253.64144243774626
3275027468.4509692452433.5490307547598
3377367654.4382077117981.5617922882093
3476287660.28105445934-32.281054459344
3574947544.46254769983-50.4625476998326
3676687657.595501328310.4044986717017
3778887902.87098224518-14.8709822451829
3877747795.39764088185-21.3976408818453
3976447610.7971018845233.2028981154754
4078267788.482920220737.5170797792953
4180568016.128288391939.8717116080952
4279907971.27379891918.7262010810009
4378147854.76278886203-40.7627888620282
4479787966.3572505519811.6427494480204
4582388145.0315040179792.9684959820333
4681388141.07319558437-3.07319558436939
4780008048.30967620463-48.3096762046316
4881768177.09712922554-1.09712922553626
4984128410.715459254351.28454074564797
5083328317.9657945023614.0342054976427
5181948175.9090680361518.0909319638504
5283548345.29662960198.70337039810329
5385768552.4522725563123.5477274436889
5485008492.574207003117.42579299688805
5583768357.7914656426118.2085343573926
5685388530.42628326037.57371673970192


Extrapolation Forecasts of Exponential Smoothing
tForecast95% Lower Bound95% Upper Bound
578723.999392010088643.144515126698804.85426889347
588627.566318496118522.069197995738733.06343899649
598530.081503073248403.685413768528656.47759237795
608709.213355031428564.012303695098854.41440636775
618946.428716153438783.767683612739109.08974869412
628857.220830272998678.032054659139036.40960588685
638706.384633705918511.345637538668901.42362987317
648860.78741644928650.406245743759071.16858715464
659064.889530438868839.555233203029290.2238276747
668983.595780480998743.610399850339223.58116111165
678845.341730776658590.941658990519099.74180256279
689001.340763991728732.711589000989269.96993898246

\begin{tabular}{lllllllll}
\hline
Extrapolation Forecasts of Exponential Smoothing \tabularnewline
t & Forecast & 95% Lower Bound & 95% Upper Bound \tabularnewline
57 & 8723.99939201008 & 8643.14451512669 & 8804.85426889347 \tabularnewline
58 & 8627.56631849611 & 8522.06919799573 & 8733.06343899649 \tabularnewline
59 & 8530.08150307324 & 8403.68541376852 & 8656.47759237795 \tabularnewline
60 & 8709.21335503142 & 8564.01230369509 & 8854.41440636775 \tabularnewline
61 & 8946.42871615343 & 8783.76768361273 & 9109.08974869412 \tabularnewline
62 & 8857.22083027299 & 8678.03205465913 & 9036.40960588685 \tabularnewline
63 & 8706.38463370591 & 8511.34563753866 & 8901.42362987317 \tabularnewline
64 & 8860.7874164492 & 8650.40624574375 & 9071.16858715464 \tabularnewline
65 & 9064.88953043886 & 8839.55523320302 & 9290.2238276747 \tabularnewline
66 & 8983.59578048099 & 8743.61039985033 & 9223.58116111165 \tabularnewline
67 & 8845.34173077665 & 8590.94165899051 & 9099.74180256279 \tabularnewline
68 & 9001.34076399172 & 8732.71158900098 & 9269.96993898246 \tabularnewline
\hline
\end{tabular}
%Source: https://freestatistics.org/blog/index.php?pk=297979&T=3

[TABLE]
[ROW][C]Extrapolation Forecasts of Exponential Smoothing[/C][/ROW]
[ROW][C]t[/C][C]Forecast[/C][C]95% Lower Bound[/C][C]95% Upper Bound[/C][/ROW]
[ROW][C]57[/C][C]8723.99939201008[/C][C]8643.14451512669[/C][C]8804.85426889347[/C][/ROW]
[ROW][C]58[/C][C]8627.56631849611[/C][C]8522.06919799573[/C][C]8733.06343899649[/C][/ROW]
[ROW][C]59[/C][C]8530.08150307324[/C][C]8403.68541376852[/C][C]8656.47759237795[/C][/ROW]
[ROW][C]60[/C][C]8709.21335503142[/C][C]8564.01230369509[/C][C]8854.41440636775[/C][/ROW]
[ROW][C]61[/C][C]8946.42871615343[/C][C]8783.76768361273[/C][C]9109.08974869412[/C][/ROW]
[ROW][C]62[/C][C]8857.22083027299[/C][C]8678.03205465913[/C][C]9036.40960588685[/C][/ROW]
[ROW][C]63[/C][C]8706.38463370591[/C][C]8511.34563753866[/C][C]8901.42362987317[/C][/ROW]
[ROW][C]64[/C][C]8860.7874164492[/C][C]8650.40624574375[/C][C]9071.16858715464[/C][/ROW]
[ROW][C]65[/C][C]9064.88953043886[/C][C]8839.55523320302[/C][C]9290.2238276747[/C][/ROW]
[ROW][C]66[/C][C]8983.59578048099[/C][C]8743.61039985033[/C][C]9223.58116111165[/C][/ROW]
[ROW][C]67[/C][C]8845.34173077665[/C][C]8590.94165899051[/C][C]9099.74180256279[/C][/ROW]
[ROW][C]68[/C][C]9001.34076399172[/C][C]8732.71158900098[/C][C]9269.96993898246[/C][/ROW]
[/TABLE]
Source: https://freestatistics.org/blog/index.php?pk=297979&T=3

Globally Unique Identifier (entire table): ba.freestatistics.org/blog/index.php?pk=297979&T=3

As an alternative you can also use a QR Code:  

The GUIDs for individual cells are displayed in the table below:

Extrapolation Forecasts of Exponential Smoothing
tForecast95% Lower Bound95% Upper Bound
578723.999392010088643.144515126698804.85426889347
588627.566318496118522.069197995738733.06343899649
598530.081503073248403.685413768528656.47759237795
608709.213355031428564.012303695098854.41440636775
618946.428716153438783.767683612739109.08974869412
628857.220830272998678.032054659139036.40960588685
638706.384633705918511.345637538668901.42362987317
648860.78741644928650.406245743759071.16858715464
659064.889530438868839.555233203029290.2238276747
668983.595780480998743.610399850339223.58116111165
678845.341730776658590.941658990519099.74180256279
689001.340763991728732.711589000989269.96993898246


Parameters (Session):
par1 = additive ; par2 = 12 ;
Parameters (R input):
par1 = 12 ; par2 = Triple ; par3 = additive ; par4 = 12 ;
R code (references can be found in the software module):
par1 <- as.numeric(par1)
par4 <- as.numeric(par4)
if (par2 == 'Single') K <- 1
if (par2 == 'Double') K <- 2
if (par2 == 'Triple') K <- par1
nx <- length(x)
nxmK <- nx - K
x <- ts(x, frequency = par1)
if (par2 == 'Single') fit <- HoltWinters(x, gamma=F, beta=F)
if (par2 == 'Double') fit <- HoltWinters(x, gamma=F)
if (par2 == 'Triple') fit <- HoltWinters(x, seasonal=par3)
fit
myresid <- x - fit$fitted[,'xhat']
bitmap(file='test1.png')
op <- par(mfrow=c(2,1))
plot(fit,ylab='Observed (black) / Fitted (red)',main='Interpolation Fit of Exponential Smoothing')
plot(myresid,ylab='Residuals',main='Interpolation Prediction Errors')
par(op)
dev.off()
bitmap(file='test2.png')
p <- predict(fit, par4, prediction.interval=TRUE)
np <- length(p[,1])
plot(fit,p,ylab='Observed (black) / Fitted (red)',main='Extrapolation Fit of Exponential Smoothing')
dev.off()
bitmap(file='test3.png')
op <- par(mfrow = c(2,2))
acf(as.numeric(myresid),lag.max = nx/2,main='Residual ACF')
spectrum(myresid,main='Residals Periodogram')
cpgram(myresid,main='Residal Cumulative Periodogram')
qqnorm(myresid,main='Residual Normal QQ Plot')
qqline(myresid)
par(op)
dev.off()
load(file='createtable')
a<-table.start()
a<-table.row.start(a)
a<-table.element(a,'Estimated Parameters of Exponential Smoothing',2,TRUE)
a<-table.row.end(a)
a<-table.row.start(a)
a<-table.element(a,'Parameter',header=TRUE)
a<-table.element(a,'Value',header=TRUE)
a<-table.row.end(a)
a<-table.row.start(a)
a<-table.element(a,'alpha',header=TRUE)
a<-table.element(a,fit$alpha)
a<-table.row.end(a)
a<-table.row.start(a)
a<-table.element(a,'beta',header=TRUE)
a<-table.element(a,fit$beta)
a<-table.row.end(a)
a<-table.row.start(a)
a<-table.element(a,'gamma',header=TRUE)
a<-table.element(a,fit$gamma)
a<-table.row.end(a)
a<-table.end(a)
table.save(a,file='mytable.tab')
a<-table.start()
a<-table.row.start(a)
a<-table.element(a,'Interpolation Forecasts of Exponential Smoothing',4,TRUE)
a<-table.row.end(a)
a<-table.row.start(a)
a<-table.element(a,'t',header=TRUE)
a<-table.element(a,'Observed',header=TRUE)
a<-table.element(a,'Fitted',header=TRUE)
a<-table.element(a,'Residuals',header=TRUE)
a<-table.row.end(a)
for (i in 1:nxmK) {
a<-table.row.start(a)
a<-table.element(a,i+K,header=TRUE)
a<-table.element(a,x[i+K])
a<-table.element(a,fit$fitted[i,'xhat'])
a<-table.element(a,myresid[i])
a<-table.row.end(a)
}
a<-table.end(a)
table.save(a,file='mytable1.tab')
a<-table.start()
a<-table.row.start(a)
a<-table.element(a,'Extrapolation Forecasts of Exponential Smoothing',4,TRUE)
a<-table.row.end(a)
a<-table.row.start(a)
a<-table.element(a,'t',header=TRUE)
a<-table.element(a,'Forecast',header=TRUE)
a<-table.element(a,'95% Lower Bound',header=TRUE)
a<-table.element(a,'95% Upper Bound',header=TRUE)
a<-table.row.end(a)
for (i in 1:np) {
a<-table.row.start(a)
a<-table.element(a,nx+i,header=TRUE)
a<-table.element(a,p[i,'fit'])
a<-table.element(a,p[i,'lwr'])
a<-table.element(a,p[i,'upr'])
a<-table.row.end(a)
}
a<-table.end(a)
table.save(a,file='mytable2.tab')