Free Statistics

of Irreproducible Research!

Author's title

Author*The author of this computation has been verified*
R Software Modulerwasp_exponentialsmoothing.wasp
Title produced by softwareExponential Smoothing
Date of computationWed, 07 Dec 2016 11:41:17 +0100
Cite this page as followsStatistical Computations at FreeStatistics.org, Office for Research Development and Education, URL https://freestatistics.org/blog/index.php?v=date/2016/Dec/07/t1481107358xrtl6uqce675drp.htm/, Retrieved Tue, 07 May 2024 21:02:25 +0000
Statistical Computations at FreeStatistics.org, Office for Research Development and Education, URL https://freestatistics.org/blog/index.php?pk=297993, Retrieved Tue, 07 May 2024 21:02:25 +0000
QR Codes:

Original text written by user:
IsPrivate?No (this computation is public)
User-defined keywords
Estimated Impact66
Family? (F = Feedback message, R = changed R code, M = changed R Module, P = changed Parameters, D = changed Data)
-       [Exponential Smoothing] [Voorbeeld 2 Time ...] [2016-12-07 10:41:17] [bde5266f17215258f6d7c4cd7e531432] [Current]
Feedback Forum

Post a new message
Dataseries X:
1549.5
1746.5
1869.5
1784
1795
1942.5
2100
2072.5
2075
2278
2451
2290.5
2388
2574.5
2939.5
2924
3087.5
3259.5
3474.5
3376
3496
3771.5
3743
3474.5
3405
3684.5
3804
3470.5
3453.5
3842
4156.5
4055
4133.5
4552
4588
4423.5
4462.5
4846
4869.5
4637
4841
5114.5
5374.5
5166.5
5236.5
5740.5
5992
5842
5844.5
6384.5
6487
6372
6583.5
6990
6874
6710
6924
7428.5
7415.5
7228.5
6734
7158.5
7192


Summary of computational transaction
Raw Input view raw input (R code)
Raw Outputview raw output of R engine
Computing time1 seconds
R ServerBig Analytics Cloud Computing Center

\begin{tabular}{lllllllll}
\hline
Summary of computational transaction \tabularnewline
Raw Input view raw input (R code)  \tabularnewline
Raw Outputview raw output of R engine  \tabularnewline
Computing time1 seconds \tabularnewline
R ServerBig Analytics Cloud Computing Center \tabularnewline
\hline
\end{tabular}
%Source: https://freestatistics.org/blog/index.php?pk=297993&T=0

[TABLE]
[ROW]
Summary of computational transaction[/C][/ROW] [ROW]Raw Input[/C] view raw input (R code) [/C][/ROW] [ROW]Raw Output[/C]view raw output of R engine [/C][/ROW] [ROW]Computing time[/C]1 seconds[/C][/ROW] [ROW]R Server[/C]Big Analytics Cloud Computing Center[/C][/ROW] [/TABLE] Source: https://freestatistics.org/blog/index.php?pk=297993&T=0

Globally Unique Identifier (entire table): ba.freestatistics.org/blog/index.php?pk=297993&T=0

As an alternative you can also use a QR Code:  

The GUIDs for individual cells are displayed in the table below:

Summary of computational transaction
Raw Input view raw input (R code)
Raw Outputview raw output of R engine
Computing time1 seconds
R ServerBig Analytics Cloud Computing Center


Estimated Parameters of Exponential Smoothing
ParameterValue
alpha0.72579405835881
beta0
gamma1

\begin{tabular}{lllllllll}
\hline
Estimated Parameters of Exponential Smoothing \tabularnewline
Parameter & Value \tabularnewline
alpha & 0.72579405835881 \tabularnewline
beta & 0 \tabularnewline
gamma & 1 \tabularnewline
\hline
\end{tabular}
%Source: https://freestatistics.org/blog/index.php?pk=297993&T=1

[TABLE]
[ROW][C]Estimated Parameters of Exponential Smoothing[/C][/ROW]
[ROW][C]Parameter[/C][C]Value[/C][/ROW]
[ROW][C]alpha[/C][C]0.72579405835881[/C][/ROW]
[ROW][C]beta[/C][C]0[/C][/ROW]
[ROW][C]gamma[/C][C]1[/C][/ROW]
[/TABLE]
Source: https://freestatistics.org/blog/index.php?pk=297993&T=1

Globally Unique Identifier (entire table): ba.freestatistics.org/blog/index.php?pk=297993&T=1

As an alternative you can also use a QR Code:  

The GUIDs for individual cells are displayed in the table below:

Estimated Parameters of Exponential Smoothing
ParameterValue
alpha0.72579405835881
beta0
gamma1


Interpolation Forecasts of Exponential Smoothing
tObservedFittedResiduals
1323881795.64703525641592.352964743589
142574.52406.05224565373168.447754346268
152939.52885.3520730373354.1479269626652
1629242893.2770981678230.7229018321841
173087.53068.5753792416918.9246207583128
183259.53256.706371346632.79362865337089
193474.53333.4004185597141.099581440296
2033763444.43443787452-68.4344378745172
2134963423.7440776132772.2559223867347
223771.53692.6659448979978.8340551020096
2337433927.09134848922-184.091348489225
243474.53629.81205636235-155.312056362348
2534053770.43063927973-365.430639279731
263684.53569.44487329984115.055126700165
2738043978.65095698059-174.650956980586
283470.53814.09183051206-343.591830512057
293453.53714.4795441227-260.979544122701
3038423695.03454256738146.965457432624
314156.53914.29196050968242.208039490323
3240554041.2544248549413.7455751450607
334133.54118.7879624744214.7120375255781
3445524347.74858310747204.251416892531
3545884601.10545482818-13.1054548281772
364423.54435.81816128108-12.3181612810768
374462.54622.60509974486-160.105099744856
3848464702.3954422944143.604557705605
394869.55052.88340389356-183.383403893557
4046374835.66172803228-198.661728032277
4148414863.8916286806-22.8916286806034
425114.55129.11036480948-14.6103648094813
435374.55257.21309289149117.286907108508
445166.55230.86277642512-64.3627764251196
455236.55251.97074629387-15.4707462938741
465740.55510.99770576344229.502294236564
4759925723.08096854643268.919031453569
4858425762.7012520227579.298747977251
495844.55975.45914224769-130.959142247691
506384.56159.68244018058224.817559819422
5164876479.45227425987.5477257402008
5263726396.61787058528-24.6178705852799
536583.56599.36497446758-15.8649744675768
5469906871.95438623217118.045613767827
5568747132.50505101754-258.505051017544
5667106783.5977416421-73.5977416420974
5769246811.40951378811112.590486211893
587428.57230.55561817181197.944381828185
597415.57430.54263917961-15.0426391796127
607228.57212.0702209238316.4297790761666
6167347321.5442242886-587.544224288603
627158.57271.93686814524-113.436868145236
6371927286.62696875023-94.6269687502327

\begin{tabular}{lllllllll}
\hline
Interpolation Forecasts of Exponential Smoothing \tabularnewline
t & Observed & Fitted & Residuals \tabularnewline
13 & 2388 & 1795.64703525641 & 592.352964743589 \tabularnewline
14 & 2574.5 & 2406.05224565373 & 168.447754346268 \tabularnewline
15 & 2939.5 & 2885.35207303733 & 54.1479269626652 \tabularnewline
16 & 2924 & 2893.27709816782 & 30.7229018321841 \tabularnewline
17 & 3087.5 & 3068.57537924169 & 18.9246207583128 \tabularnewline
18 & 3259.5 & 3256.70637134663 & 2.79362865337089 \tabularnewline
19 & 3474.5 & 3333.4004185597 & 141.099581440296 \tabularnewline
20 & 3376 & 3444.43443787452 & -68.4344378745172 \tabularnewline
21 & 3496 & 3423.74407761327 & 72.2559223867347 \tabularnewline
22 & 3771.5 & 3692.66594489799 & 78.8340551020096 \tabularnewline
23 & 3743 & 3927.09134848922 & -184.091348489225 \tabularnewline
24 & 3474.5 & 3629.81205636235 & -155.312056362348 \tabularnewline
25 & 3405 & 3770.43063927973 & -365.430639279731 \tabularnewline
26 & 3684.5 & 3569.44487329984 & 115.055126700165 \tabularnewline
27 & 3804 & 3978.65095698059 & -174.650956980586 \tabularnewline
28 & 3470.5 & 3814.09183051206 & -343.591830512057 \tabularnewline
29 & 3453.5 & 3714.4795441227 & -260.979544122701 \tabularnewline
30 & 3842 & 3695.03454256738 & 146.965457432624 \tabularnewline
31 & 4156.5 & 3914.29196050968 & 242.208039490323 \tabularnewline
32 & 4055 & 4041.25442485494 & 13.7455751450607 \tabularnewline
33 & 4133.5 & 4118.78796247442 & 14.7120375255781 \tabularnewline
34 & 4552 & 4347.74858310747 & 204.251416892531 \tabularnewline
35 & 4588 & 4601.10545482818 & -13.1054548281772 \tabularnewline
36 & 4423.5 & 4435.81816128108 & -12.3181612810768 \tabularnewline
37 & 4462.5 & 4622.60509974486 & -160.105099744856 \tabularnewline
38 & 4846 & 4702.3954422944 & 143.604557705605 \tabularnewline
39 & 4869.5 & 5052.88340389356 & -183.383403893557 \tabularnewline
40 & 4637 & 4835.66172803228 & -198.661728032277 \tabularnewline
41 & 4841 & 4863.8916286806 & -22.8916286806034 \tabularnewline
42 & 5114.5 & 5129.11036480948 & -14.6103648094813 \tabularnewline
43 & 5374.5 & 5257.21309289149 & 117.286907108508 \tabularnewline
44 & 5166.5 & 5230.86277642512 & -64.3627764251196 \tabularnewline
45 & 5236.5 & 5251.97074629387 & -15.4707462938741 \tabularnewline
46 & 5740.5 & 5510.99770576344 & 229.502294236564 \tabularnewline
47 & 5992 & 5723.08096854643 & 268.919031453569 \tabularnewline
48 & 5842 & 5762.70125202275 & 79.298747977251 \tabularnewline
49 & 5844.5 & 5975.45914224769 & -130.959142247691 \tabularnewline
50 & 6384.5 & 6159.68244018058 & 224.817559819422 \tabularnewline
51 & 6487 & 6479.4522742598 & 7.5477257402008 \tabularnewline
52 & 6372 & 6396.61787058528 & -24.6178705852799 \tabularnewline
53 & 6583.5 & 6599.36497446758 & -15.8649744675768 \tabularnewline
54 & 6990 & 6871.95438623217 & 118.045613767827 \tabularnewline
55 & 6874 & 7132.50505101754 & -258.505051017544 \tabularnewline
56 & 6710 & 6783.5977416421 & -73.5977416420974 \tabularnewline
57 & 6924 & 6811.40951378811 & 112.590486211893 \tabularnewline
58 & 7428.5 & 7230.55561817181 & 197.944381828185 \tabularnewline
59 & 7415.5 & 7430.54263917961 & -15.0426391796127 \tabularnewline
60 & 7228.5 & 7212.07022092383 & 16.4297790761666 \tabularnewline
61 & 6734 & 7321.5442242886 & -587.544224288603 \tabularnewline
62 & 7158.5 & 7271.93686814524 & -113.436868145236 \tabularnewline
63 & 7192 & 7286.62696875023 & -94.6269687502327 \tabularnewline
\hline
\end{tabular}
%Source: https://freestatistics.org/blog/index.php?pk=297993&T=2

[TABLE]
[ROW][C]Interpolation Forecasts of Exponential Smoothing[/C][/ROW]
[ROW][C]t[/C][C]Observed[/C][C]Fitted[/C][C]Residuals[/C][/ROW]
[ROW][C]13[/C][C]2388[/C][C]1795.64703525641[/C][C]592.352964743589[/C][/ROW]
[ROW][C]14[/C][C]2574.5[/C][C]2406.05224565373[/C][C]168.447754346268[/C][/ROW]
[ROW][C]15[/C][C]2939.5[/C][C]2885.35207303733[/C][C]54.1479269626652[/C][/ROW]
[ROW][C]16[/C][C]2924[/C][C]2893.27709816782[/C][C]30.7229018321841[/C][/ROW]
[ROW][C]17[/C][C]3087.5[/C][C]3068.57537924169[/C][C]18.9246207583128[/C][/ROW]
[ROW][C]18[/C][C]3259.5[/C][C]3256.70637134663[/C][C]2.79362865337089[/C][/ROW]
[ROW][C]19[/C][C]3474.5[/C][C]3333.4004185597[/C][C]141.099581440296[/C][/ROW]
[ROW][C]20[/C][C]3376[/C][C]3444.43443787452[/C][C]-68.4344378745172[/C][/ROW]
[ROW][C]21[/C][C]3496[/C][C]3423.74407761327[/C][C]72.2559223867347[/C][/ROW]
[ROW][C]22[/C][C]3771.5[/C][C]3692.66594489799[/C][C]78.8340551020096[/C][/ROW]
[ROW][C]23[/C][C]3743[/C][C]3927.09134848922[/C][C]-184.091348489225[/C][/ROW]
[ROW][C]24[/C][C]3474.5[/C][C]3629.81205636235[/C][C]-155.312056362348[/C][/ROW]
[ROW][C]25[/C][C]3405[/C][C]3770.43063927973[/C][C]-365.430639279731[/C][/ROW]
[ROW][C]26[/C][C]3684.5[/C][C]3569.44487329984[/C][C]115.055126700165[/C][/ROW]
[ROW][C]27[/C][C]3804[/C][C]3978.65095698059[/C][C]-174.650956980586[/C][/ROW]
[ROW][C]28[/C][C]3470.5[/C][C]3814.09183051206[/C][C]-343.591830512057[/C][/ROW]
[ROW][C]29[/C][C]3453.5[/C][C]3714.4795441227[/C][C]-260.979544122701[/C][/ROW]
[ROW][C]30[/C][C]3842[/C][C]3695.03454256738[/C][C]146.965457432624[/C][/ROW]
[ROW][C]31[/C][C]4156.5[/C][C]3914.29196050968[/C][C]242.208039490323[/C][/ROW]
[ROW][C]32[/C][C]4055[/C][C]4041.25442485494[/C][C]13.7455751450607[/C][/ROW]
[ROW][C]33[/C][C]4133.5[/C][C]4118.78796247442[/C][C]14.7120375255781[/C][/ROW]
[ROW][C]34[/C][C]4552[/C][C]4347.74858310747[/C][C]204.251416892531[/C][/ROW]
[ROW][C]35[/C][C]4588[/C][C]4601.10545482818[/C][C]-13.1054548281772[/C][/ROW]
[ROW][C]36[/C][C]4423.5[/C][C]4435.81816128108[/C][C]-12.3181612810768[/C][/ROW]
[ROW][C]37[/C][C]4462.5[/C][C]4622.60509974486[/C][C]-160.105099744856[/C][/ROW]
[ROW][C]38[/C][C]4846[/C][C]4702.3954422944[/C][C]143.604557705605[/C][/ROW]
[ROW][C]39[/C][C]4869.5[/C][C]5052.88340389356[/C][C]-183.383403893557[/C][/ROW]
[ROW][C]40[/C][C]4637[/C][C]4835.66172803228[/C][C]-198.661728032277[/C][/ROW]
[ROW][C]41[/C][C]4841[/C][C]4863.8916286806[/C][C]-22.8916286806034[/C][/ROW]
[ROW][C]42[/C][C]5114.5[/C][C]5129.11036480948[/C][C]-14.6103648094813[/C][/ROW]
[ROW][C]43[/C][C]5374.5[/C][C]5257.21309289149[/C][C]117.286907108508[/C][/ROW]
[ROW][C]44[/C][C]5166.5[/C][C]5230.86277642512[/C][C]-64.3627764251196[/C][/ROW]
[ROW][C]45[/C][C]5236.5[/C][C]5251.97074629387[/C][C]-15.4707462938741[/C][/ROW]
[ROW][C]46[/C][C]5740.5[/C][C]5510.99770576344[/C][C]229.502294236564[/C][/ROW]
[ROW][C]47[/C][C]5992[/C][C]5723.08096854643[/C][C]268.919031453569[/C][/ROW]
[ROW][C]48[/C][C]5842[/C][C]5762.70125202275[/C][C]79.298747977251[/C][/ROW]
[ROW][C]49[/C][C]5844.5[/C][C]5975.45914224769[/C][C]-130.959142247691[/C][/ROW]
[ROW][C]50[/C][C]6384.5[/C][C]6159.68244018058[/C][C]224.817559819422[/C][/ROW]
[ROW][C]51[/C][C]6487[/C][C]6479.4522742598[/C][C]7.5477257402008[/C][/ROW]
[ROW][C]52[/C][C]6372[/C][C]6396.61787058528[/C][C]-24.6178705852799[/C][/ROW]
[ROW][C]53[/C][C]6583.5[/C][C]6599.36497446758[/C][C]-15.8649744675768[/C][/ROW]
[ROW][C]54[/C][C]6990[/C][C]6871.95438623217[/C][C]118.045613767827[/C][/ROW]
[ROW][C]55[/C][C]6874[/C][C]7132.50505101754[/C][C]-258.505051017544[/C][/ROW]
[ROW][C]56[/C][C]6710[/C][C]6783.5977416421[/C][C]-73.5977416420974[/C][/ROW]
[ROW][C]57[/C][C]6924[/C][C]6811.40951378811[/C][C]112.590486211893[/C][/ROW]
[ROW][C]58[/C][C]7428.5[/C][C]7230.55561817181[/C][C]197.944381828185[/C][/ROW]
[ROW][C]59[/C][C]7415.5[/C][C]7430.54263917961[/C][C]-15.0426391796127[/C][/ROW]
[ROW][C]60[/C][C]7228.5[/C][C]7212.07022092383[/C][C]16.4297790761666[/C][/ROW]
[ROW][C]61[/C][C]6734[/C][C]7321.5442242886[/C][C]-587.544224288603[/C][/ROW]
[ROW][C]62[/C][C]7158.5[/C][C]7271.93686814524[/C][C]-113.436868145236[/C][/ROW]
[ROW][C]63[/C][C]7192[/C][C]7286.62696875023[/C][C]-94.6269687502327[/C][/ROW]
[/TABLE]
Source: https://freestatistics.org/blog/index.php?pk=297993&T=2

Globally Unique Identifier (entire table): ba.freestatistics.org/blog/index.php?pk=297993&T=2

As an alternative you can also use a QR Code:  

The GUIDs for individual cells are displayed in the table below:

Interpolation Forecasts of Exponential Smoothing
tObservedFittedResiduals
1323881795.64703525641592.352964743589
142574.52406.05224565373168.447754346268
152939.52885.3520730373354.1479269626652
1629242893.2770981678230.7229018321841
173087.53068.5753792416918.9246207583128
183259.53256.706371346632.79362865337089
193474.53333.4004185597141.099581440296
2033763444.43443787452-68.4344378745172
2134963423.7440776132772.2559223867347
223771.53692.6659448979978.8340551020096
2337433927.09134848922-184.091348489225
243474.53629.81205636235-155.312056362348
2534053770.43063927973-365.430639279731
263684.53569.44487329984115.055126700165
2738043978.65095698059-174.650956980586
283470.53814.09183051206-343.591830512057
293453.53714.4795441227-260.979544122701
3038423695.03454256738146.965457432624
314156.53914.29196050968242.208039490323
3240554041.2544248549413.7455751450607
334133.54118.7879624744214.7120375255781
3445524347.74858310747204.251416892531
3545884601.10545482818-13.1054548281772
364423.54435.81816128108-12.3181612810768
374462.54622.60509974486-160.105099744856
3848464702.3954422944143.604557705605
394869.55052.88340389356-183.383403893557
4046374835.66172803228-198.661728032277
4148414863.8916286806-22.8916286806034
425114.55129.11036480948-14.6103648094813
435374.55257.21309289149117.286907108508
445166.55230.86277642512-64.3627764251196
455236.55251.97074629387-15.4707462938741
465740.55510.99770576344229.502294236564
4759925723.08096854643268.919031453569
4858425762.7012520227579.298747977251
495844.55975.45914224769-130.959142247691
506384.56159.68244018058224.817559819422
5164876479.45227425987.5477257402008
5263726396.61787058528-24.6178705852799
536583.56599.36497446758-15.8649744675768
5469906871.95438623217118.045613767827
5568747132.50505101754-258.505051017544
5667106783.5977416421-73.5977416420974
5769246811.40951378811112.590486211893
587428.57230.55561817181197.944381828185
597415.57430.54263917961-15.0426391796127
607228.57212.0702209238316.4297790761666
6167347321.5442242886-587.544224288603
627158.57271.93686814524-113.436868145236
6371927286.62696875023-94.6269687502327


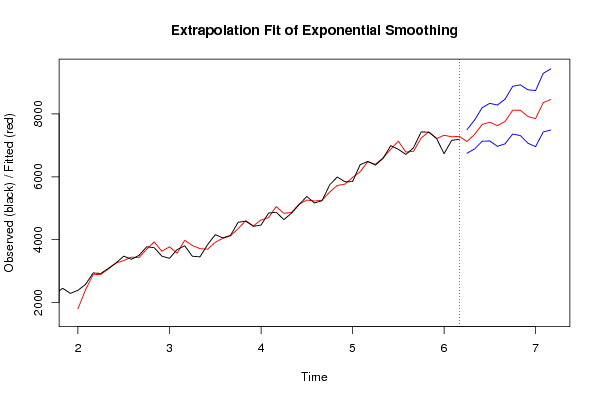
Extrapolation Forecasts of Exponential Smoothing
tForecast95% Lower Bound95% Upper Bound
647120.814781271056748.21643948927493.41312305291
657343.829485475636883.436472145567804.22249880571
667664.652680387627130.710802326258198.594558449
677736.27411047197137.754159616248334.79406132756
687625.690914064366968.912158320228282.4696698085
697757.973408144047047.698435741538468.24838054655
708118.806551927647358.79159230788878.82151154747
718116.724410066237310.030576402878923.4182437296
727917.79977403267066.984198425848768.61534963937
737849.735881044316956.976481138818742.49528094981
748356.567685942957423.748545624659289.38682626126
758458.747377622387487.519417270779429.97533797398

\begin{tabular}{lllllllll}
\hline
Extrapolation Forecasts of Exponential Smoothing \tabularnewline
t & Forecast & 95% Lower Bound & 95% Upper Bound \tabularnewline
64 & 7120.81478127105 & 6748.2164394892 & 7493.41312305291 \tabularnewline
65 & 7343.82948547563 & 6883.43647214556 & 7804.22249880571 \tabularnewline
66 & 7664.65268038762 & 7130.71080232625 & 8198.594558449 \tabularnewline
67 & 7736.2741104719 & 7137.75415961624 & 8334.79406132756 \tabularnewline
68 & 7625.69091406436 & 6968.91215832022 & 8282.4696698085 \tabularnewline
69 & 7757.97340814404 & 7047.69843574153 & 8468.24838054655 \tabularnewline
70 & 8118.80655192764 & 7358.7915923078 & 8878.82151154747 \tabularnewline
71 & 8116.72441006623 & 7310.03057640287 & 8923.4182437296 \tabularnewline
72 & 7917.7997740326 & 7066.98419842584 & 8768.61534963937 \tabularnewline
73 & 7849.73588104431 & 6956.97648113881 & 8742.49528094981 \tabularnewline
74 & 8356.56768594295 & 7423.74854562465 & 9289.38682626126 \tabularnewline
75 & 8458.74737762238 & 7487.51941727077 & 9429.97533797398 \tabularnewline
\hline
\end{tabular}
%Source: https://freestatistics.org/blog/index.php?pk=297993&T=3

[TABLE]
[ROW][C]Extrapolation Forecasts of Exponential Smoothing[/C][/ROW]
[ROW][C]t[/C][C]Forecast[/C][C]95% Lower Bound[/C][C]95% Upper Bound[/C][/ROW]
[ROW][C]64[/C][C]7120.81478127105[/C][C]6748.2164394892[/C][C]7493.41312305291[/C][/ROW]
[ROW][C]65[/C][C]7343.82948547563[/C][C]6883.43647214556[/C][C]7804.22249880571[/C][/ROW]
[ROW][C]66[/C][C]7664.65268038762[/C][C]7130.71080232625[/C][C]8198.594558449[/C][/ROW]
[ROW][C]67[/C][C]7736.2741104719[/C][C]7137.75415961624[/C][C]8334.79406132756[/C][/ROW]
[ROW][C]68[/C][C]7625.69091406436[/C][C]6968.91215832022[/C][C]8282.4696698085[/C][/ROW]
[ROW][C]69[/C][C]7757.97340814404[/C][C]7047.69843574153[/C][C]8468.24838054655[/C][/ROW]
[ROW][C]70[/C][C]8118.80655192764[/C][C]7358.7915923078[/C][C]8878.82151154747[/C][/ROW]
[ROW][C]71[/C][C]8116.72441006623[/C][C]7310.03057640287[/C][C]8923.4182437296[/C][/ROW]
[ROW][C]72[/C][C]7917.7997740326[/C][C]7066.98419842584[/C][C]8768.61534963937[/C][/ROW]
[ROW][C]73[/C][C]7849.73588104431[/C][C]6956.97648113881[/C][C]8742.49528094981[/C][/ROW]
[ROW][C]74[/C][C]8356.56768594295[/C][C]7423.74854562465[/C][C]9289.38682626126[/C][/ROW]
[ROW][C]75[/C][C]8458.74737762238[/C][C]7487.51941727077[/C][C]9429.97533797398[/C][/ROW]
[/TABLE]
Source: https://freestatistics.org/blog/index.php?pk=297993&T=3

Globally Unique Identifier (entire table): ba.freestatistics.org/blog/index.php?pk=297993&T=3

As an alternative you can also use a QR Code:  

The GUIDs for individual cells are displayed in the table below:

Extrapolation Forecasts of Exponential Smoothing
tForecast95% Lower Bound95% Upper Bound
647120.814781271056748.21643948927493.41312305291
657343.829485475636883.436472145567804.22249880571
667664.652680387627130.710802326258198.594558449
677736.27411047197137.754159616248334.79406132756
687625.690914064366968.912158320228282.4696698085
697757.973408144047047.698435741538468.24838054655
708118.806551927647358.79159230788878.82151154747
718116.724410066237310.030576402878923.4182437296
727917.79977403267066.984198425848768.61534963937
737849.735881044316956.976481138818742.49528094981
748356.567685942957423.748545624659289.38682626126
758458.747377622387487.519417270779429.97533797398


Parameters (Session):
par4 = 12 ;
Parameters (R input):
par1 = 12 ; par2 = Triple ; par3 = additive ; par4 = 12 ;
R code (references can be found in the software module):
par4 <- '12'
par3 <- 'additive'
par2 <- 'Double'
par1 <- '12'
par1 <- as.numeric(par1)
par4 <- as.numeric(par4)
if (par2 == 'Single') K <- 1
if (par2 == 'Double') K <- 2
if (par2 == 'Triple') K <- par1
nx <- length(x)
nxmK <- nx - K
x <- ts(x, frequency = par1)
if (par2 == 'Single') fit <- HoltWinters(x, gamma=F, beta=F)
if (par2 == 'Double') fit <- HoltWinters(x, gamma=F)
if (par2 == 'Triple') fit <- HoltWinters(x, seasonal=par3)
fit
myresid <- x - fit$fitted[,'xhat']
bitmap(file='test1.png')
op <- par(mfrow=c(2,1))
plot(fit,ylab='Observed (black) / Fitted (red)',main='Interpolation Fit of Exponential Smoothing')
plot(myresid,ylab='Residuals',main='Interpolation Prediction Errors')
par(op)
dev.off()
bitmap(file='test2.png')
p <- predict(fit, par4, prediction.interval=TRUE)
np <- length(p[,1])
plot(fit,p,ylab='Observed (black) / Fitted (red)',main='Extrapolation Fit of Exponential Smoothing')
dev.off()
bitmap(file='test3.png')
op <- par(mfrow = c(2,2))
acf(as.numeric(myresid),lag.max = nx/2,main='Residual ACF')
spectrum(myresid,main='Residals Periodogram')
cpgram(myresid,main='Residal Cumulative Periodogram')
qqnorm(myresid,main='Residual Normal QQ Plot')
qqline(myresid)
par(op)
dev.off()
load(file='createtable')
a<-table.start()
a<-table.row.start(a)
a<-table.element(a,'Estimated Parameters of Exponential Smoothing',2,TRUE)
a<-table.row.end(a)
a<-table.row.start(a)
a<-table.element(a,'Parameter',header=TRUE)
a<-table.element(a,'Value',header=TRUE)
a<-table.row.end(a)
a<-table.row.start(a)
a<-table.element(a,'alpha',header=TRUE)
a<-table.element(a,fit$alpha)
a<-table.row.end(a)
a<-table.row.start(a)
a<-table.element(a,'beta',header=TRUE)
a<-table.element(a,fit$beta)
a<-table.row.end(a)
a<-table.row.start(a)
a<-table.element(a,'gamma',header=TRUE)
a<-table.element(a,fit$gamma)
a<-table.row.end(a)
a<-table.end(a)
table.save(a,file='mytable.tab')
a<-table.start()
a<-table.row.start(a)
a<-table.element(a,'Interpolation Forecasts of Exponential Smoothing',4,TRUE)
a<-table.row.end(a)
a<-table.row.start(a)
a<-table.element(a,'t',header=TRUE)
a<-table.element(a,'Observed',header=TRUE)
a<-table.element(a,'Fitted',header=TRUE)
a<-table.element(a,'Residuals',header=TRUE)
a<-table.row.end(a)
for (i in 1:nxmK) {
a<-table.row.start(a)
a<-table.element(a,i+K,header=TRUE)
a<-table.element(a,x[i+K])
a<-table.element(a,fit$fitted[i,'xhat'])
a<-table.element(a,myresid[i])
a<-table.row.end(a)
}
a<-table.end(a)
table.save(a,file='mytable1.tab')
a<-table.start()
a<-table.row.start(a)
a<-table.element(a,'Extrapolation Forecasts of Exponential Smoothing',4,TRUE)
a<-table.row.end(a)
a<-table.row.start(a)
a<-table.element(a,'t',header=TRUE)
a<-table.element(a,'Forecast',header=TRUE)
a<-table.element(a,'95% Lower Bound',header=TRUE)
a<-table.element(a,'95% Upper Bound',header=TRUE)
a<-table.row.end(a)
for (i in 1:np) {
a<-table.row.start(a)
a<-table.element(a,nx+i,header=TRUE)
a<-table.element(a,p[i,'fit'])
a<-table.element(a,p[i,'lwr'])
a<-table.element(a,p[i,'upr'])
a<-table.row.end(a)
}
a<-table.end(a)
table.save(a,file='mytable2.tab')