Free Statistics

of Irreproducible Research!

Author's title

Author*The author of this computation has been verified*
R Software Modulerwasp_structuraltimeseries.wasp
Title produced by softwareStructural Time Series Models
Date of computationWed, 07 Dec 2016 15:22:44 +0100
Cite this page as followsStatistical Computations at FreeStatistics.org, Office for Research Development and Education, URL https://freestatistics.org/blog/index.php?v=date/2016/Dec/07/t1481120992adxz4j2oev3ey0e.htm/, Retrieved Tue, 07 May 2024 13:44:15 +0000
Statistical Computations at FreeStatistics.org, Office for Research Development and Education, URL https://freestatistics.org/blog/index.php?pk=298146, Retrieved Tue, 07 May 2024 13:44:15 +0000
QR Codes:

Original text written by user:
IsPrivate?No (this computation is public)
User-defined keywords
Estimated Impact65
Family? (F = Feedback message, R = changed R code, M = changed R Module, P = changed Parameters, D = changed Data)
-       [Structural Time Series Models] [N581 F1 comp] [2016-12-07 14:22:44] [fe6e63930acb843607fc81833855c27b] [Current]
Feedback Forum

Post a new message
Dataseries X:
5461
6429
7065
7440
7722
8098
7993
7958
7989
8021
7897
7715
7545
7534
7905
8426
8863
9297
8706


Summary of computational transaction
Raw Input view raw input (R code)
Raw Outputview raw output of R engine
Computing time4 seconds
R ServerBig Analytics Cloud Computing Center
R Framework error message
Warning: there are blank lines in the 'Data' field.
Please, use NA for missing data - blank lines are simply
 deleted and are NOT treated as missing values.

\begin{tabular}{lllllllll}
\hline
Summary of computational transaction \tabularnewline
Raw Input view raw input (R code)  \tabularnewline
Raw Outputview raw output of R engine  \tabularnewline
Computing time4 seconds \tabularnewline
R ServerBig Analytics Cloud Computing Center \tabularnewline
R Framework error message & 
Warning: there are blank lines in the 'Data' field.
Please, use NA for missing data - blank lines are simply
 deleted and are NOT treated as missing values.
\tabularnewline \hline \end{tabular} %Source: https://freestatistics.org/blog/index.php?pk=298146&T=0

[TABLE]
[ROW]
Summary of computational transaction[/C][/ROW] [ROW]Raw Input[/C] view raw input (R code) [/C][/ROW] [ROW]Raw Output[/C]view raw output of R engine [/C][/ROW] [ROW]Computing time[/C]4 seconds[/C][/ROW] [ROW]R Server[/C]Big Analytics Cloud Computing Center[/C][/ROW] [ROW]R Framework error message[/C][C]
Warning: there are blank lines in the 'Data' field.
Please, use NA for missing data - blank lines are simply
 deleted and are NOT treated as missing values.
[/C][/ROW] [/TABLE] Source: https://freestatistics.org/blog/index.php?pk=298146&T=0

Globally Unique Identifier (entire table): ba.freestatistics.org/blog/index.php?pk=298146&T=0

As an alternative you can also use a QR Code:  

The GUIDs for individual cells are displayed in the table below:

Summary of computational transaction
Raw Input view raw input (R code)
Raw Outputview raw output of R engine
Computing time4 seconds
R ServerBig Analytics Cloud Computing Center
R Framework error message
Warning: there are blank lines in the 'Data' field.
Please, use NA for missing data - blank lines are simply
 deleted and are NOT treated as missing values.


Structural Time Series Model -- Interpolation
tObservedLevelSlopeSeasonalStand. Residuals
154615461000
264296420.15078599242896.6949006205638.849214007584452.60853114761913
370657067.81771221293657.81182776865-2.81771221292955-0.661993322789835
474407438.88894777301383.5924834840841.11105222698945-0.768946318153227
577227718.22358820577283.8190451406193.77641179423127-0.279888833424795
680988092.17699492297370.0753046642695.823005077028190.241969151911478
779937995.55669712013-76.5370669846499-2.5566971201275-1.25285299291296
879587951.69451526271-45.26821569585426.305484737292550.087716500230998
979897983.8339353682428.80850824522125.166064631764490.207802675970477
1080218017.0010631312932.97957272021573.998936868709070.0117008192781479
1178977894.94703924037-115.3827982959242.05296075962817-0.416191430591483
1277157711.18822954699-180.8165327264613.81177045300655-0.183557052607533
1375457590.56457624053-123.402987065112-45.56457624052750.164056757388243
1475347523.18575614312-72.612521344681310.81424385688350.142066566814563
1579057893.34857843495345.81637052863311.6514215650521.16628207591725
1684268419.50168791401515.6751133673056.498312085989520.476079098579963
1788638870.31056198127454.520937946221-7.31056198127309-0.171553420625237
1892979282.97018531582415.054837648914.0298146841775-0.110711636120129
1987068732.09459462227-495.579169854877-26.094594622272-2.55454301987727

\begin{tabular}{lllllllll}
\hline
Structural Time Series Model -- Interpolation \tabularnewline
t & Observed & Level & Slope & Seasonal & Stand. Residuals \tabularnewline
1 & 5461 & 5461 & 0 & 0 & 0 \tabularnewline
2 & 6429 & 6420.15078599242 & 896.694900620563 & 8.84921400758445 & 2.60853114761913 \tabularnewline
3 & 7065 & 7067.81771221293 & 657.81182776865 & -2.81771221292955 & -0.661993322789835 \tabularnewline
4 & 7440 & 7438.88894777301 & 383.592483484084 & 1.11105222698945 & -0.768946318153227 \tabularnewline
5 & 7722 & 7718.22358820577 & 283.819045140619 & 3.77641179423127 & -0.279888833424795 \tabularnewline
6 & 8098 & 8092.17699492297 & 370.075304664269 & 5.82300507702819 & 0.241969151911478 \tabularnewline
7 & 7993 & 7995.55669712013 & -76.5370669846499 & -2.5566971201275 & -1.25285299291296 \tabularnewline
8 & 7958 & 7951.69451526271 & -45.2682156958542 & 6.30548473729255 & 0.087716500230998 \tabularnewline
9 & 7989 & 7983.83393536824 & 28.8085082452212 & 5.16606463176449 & 0.207802675970477 \tabularnewline
10 & 8021 & 8017.00106313129 & 32.9795727202157 & 3.99893686870907 & 0.0117008192781479 \tabularnewline
11 & 7897 & 7894.94703924037 & -115.382798295924 & 2.05296075962817 & -0.416191430591483 \tabularnewline
12 & 7715 & 7711.18822954699 & -180.816532726461 & 3.81177045300655 & -0.183557052607533 \tabularnewline
13 & 7545 & 7590.56457624053 & -123.402987065112 & -45.5645762405275 & 0.164056757388243 \tabularnewline
14 & 7534 & 7523.18575614312 & -72.6125213446813 & 10.8142438568835 & 0.142066566814563 \tabularnewline
15 & 7905 & 7893.34857843495 & 345.816370528633 & 11.651421565052 & 1.16628207591725 \tabularnewline
16 & 8426 & 8419.50168791401 & 515.675113367305 & 6.49831208598952 & 0.476079098579963 \tabularnewline
17 & 8863 & 8870.31056198127 & 454.520937946221 & -7.31056198127309 & -0.171553420625237 \tabularnewline
18 & 9297 & 9282.97018531582 & 415.0548376489 & 14.0298146841775 & -0.110711636120129 \tabularnewline
19 & 8706 & 8732.09459462227 & -495.579169854877 & -26.094594622272 & -2.55454301987727 \tabularnewline
\hline
\end{tabular}
%Source: https://freestatistics.org/blog/index.php?pk=298146&T=1

[TABLE]
[ROW][C]Structural Time Series Model -- Interpolation[/C][/ROW]
[ROW][C]t[/C][C]Observed[/C][C]Level[/C][C]Slope[/C][C]Seasonal[/C][C]Stand. Residuals[/C][/ROW]
[ROW][C]1[/C][C]5461[/C][C]5461[/C][C]0[/C][C]0[/C][C]0[/C][/ROW]
[ROW][C]2[/C][C]6429[/C][C]6420.15078599242[/C][C]896.694900620563[/C][C]8.84921400758445[/C][C]2.60853114761913[/C][/ROW]
[ROW][C]3[/C][C]7065[/C][C]7067.81771221293[/C][C]657.81182776865[/C][C]-2.81771221292955[/C][C]-0.661993322789835[/C][/ROW]
[ROW][C]4[/C][C]7440[/C][C]7438.88894777301[/C][C]383.592483484084[/C][C]1.11105222698945[/C][C]-0.768946318153227[/C][/ROW]
[ROW][C]5[/C][C]7722[/C][C]7718.22358820577[/C][C]283.819045140619[/C][C]3.77641179423127[/C][C]-0.279888833424795[/C][/ROW]
[ROW][C]6[/C][C]8098[/C][C]8092.17699492297[/C][C]370.075304664269[/C][C]5.82300507702819[/C][C]0.241969151911478[/C][/ROW]
[ROW][C]7[/C][C]7993[/C][C]7995.55669712013[/C][C]-76.5370669846499[/C][C]-2.5566971201275[/C][C]-1.25285299291296[/C][/ROW]
[ROW][C]8[/C][C]7958[/C][C]7951.69451526271[/C][C]-45.2682156958542[/C][C]6.30548473729255[/C][C]0.087716500230998[/C][/ROW]
[ROW][C]9[/C][C]7989[/C][C]7983.83393536824[/C][C]28.8085082452212[/C][C]5.16606463176449[/C][C]0.207802675970477[/C][/ROW]
[ROW][C]10[/C][C]8021[/C][C]8017.00106313129[/C][C]32.9795727202157[/C][C]3.99893686870907[/C][C]0.0117008192781479[/C][/ROW]
[ROW][C]11[/C][C]7897[/C][C]7894.94703924037[/C][C]-115.382798295924[/C][C]2.05296075962817[/C][C]-0.416191430591483[/C][/ROW]
[ROW][C]12[/C][C]7715[/C][C]7711.18822954699[/C][C]-180.816532726461[/C][C]3.81177045300655[/C][C]-0.183557052607533[/C][/ROW]
[ROW][C]13[/C][C]7545[/C][C]7590.56457624053[/C][C]-123.402987065112[/C][C]-45.5645762405275[/C][C]0.164056757388243[/C][/ROW]
[ROW][C]14[/C][C]7534[/C][C]7523.18575614312[/C][C]-72.6125213446813[/C][C]10.8142438568835[/C][C]0.142066566814563[/C][/ROW]
[ROW][C]15[/C][C]7905[/C][C]7893.34857843495[/C][C]345.816370528633[/C][C]11.651421565052[/C][C]1.16628207591725[/C][/ROW]
[ROW][C]16[/C][C]8426[/C][C]8419.50168791401[/C][C]515.675113367305[/C][C]6.49831208598952[/C][C]0.476079098579963[/C][/ROW]
[ROW][C]17[/C][C]8863[/C][C]8870.31056198127[/C][C]454.520937946221[/C][C]-7.31056198127309[/C][C]-0.171553420625237[/C][/ROW]
[ROW][C]18[/C][C]9297[/C][C]9282.97018531582[/C][C]415.0548376489[/C][C]14.0298146841775[/C][C]-0.110711636120129[/C][/ROW]
[ROW][C]19[/C][C]8706[/C][C]8732.09459462227[/C][C]-495.579169854877[/C][C]-26.094594622272[/C][C]-2.55454301987727[/C][/ROW]
[/TABLE]
Source: https://freestatistics.org/blog/index.php?pk=298146&T=1

Globally Unique Identifier (entire table): ba.freestatistics.org/blog/index.php?pk=298146&T=1

As an alternative you can also use a QR Code:  

The GUIDs for individual cells are displayed in the table below:

Structural Time Series Model -- Interpolation
tObservedLevelSlopeSeasonalStand. Residuals
154615461000
264296420.15078599242896.6949006205638.849214007584452.60853114761913
370657067.81771221293657.81182776865-2.81771221292955-0.661993322789835
474407438.88894777301383.5924834840841.11105222698945-0.768946318153227
577227718.22358820577283.8190451406193.77641179423127-0.279888833424795
680988092.17699492297370.0753046642695.823005077028190.241969151911478
779937995.55669712013-76.5370669846499-2.5566971201275-1.25285299291296
879587951.69451526271-45.26821569585426.305484737292550.087716500230998
979897983.8339353682428.80850824522125.166064631764490.207802675970477
1080218017.0010631312932.97957272021573.998936868709070.0117008192781479
1178977894.94703924037-115.3827982959242.05296075962817-0.416191430591483
1277157711.18822954699-180.8165327264613.81177045300655-0.183557052607533
1375457590.56457624053-123.402987065112-45.56457624052750.164056757388243
1475347523.18575614312-72.612521344681310.81424385688350.142066566814563
1579057893.34857843495345.81637052863311.6514215650521.16628207591725
1684268419.50168791401515.6751133673056.498312085989520.476079098579963
1788638870.31056198127454.520937946221-7.31056198127309-0.171553420625237
1892979282.97018531582415.054837648914.0298146841775-0.110711636120129
1987068732.09459462227-495.579169854877-26.094594622272-2.55454301987727


Structural Time Series Model -- Extrapolation
tObservedLevelSeasonal
18546.449527562248455.4419701478791.0075574143692
28427.472573432318452.19237547098-24.7198020386621
38365.42343588748448.94278079408-83.5193449066845
48190.501145083398445.69318611719-255.192041033802
58000.697893625048442.44359144029-441.745697815253
67866.009653344028439.1939967634-573.184343419384
78070.731971571788435.94440208651-365.212430514724
88397.712124934948432.69480740961-34.9826824746707
98677.270779031438429.44521273272247.82556629871
108872.252470376078426.19561805582446.056852320244
119169.303954373558422.94602337893746.357930994623
128667.004863877278419.69642870204247.308435175234

\begin{tabular}{lllllllll}
\hline
Structural Time Series Model -- Extrapolation \tabularnewline
t & Observed & Level & Seasonal \tabularnewline
1 & 8546.44952756224 & 8455.44197014787 & 91.0075574143692 \tabularnewline
2 & 8427.47257343231 & 8452.19237547098 & -24.7198020386621 \tabularnewline
3 & 8365.4234358874 & 8448.94278079408 & -83.5193449066845 \tabularnewline
4 & 8190.50114508339 & 8445.69318611719 & -255.192041033802 \tabularnewline
5 & 8000.69789362504 & 8442.44359144029 & -441.745697815253 \tabularnewline
6 & 7866.00965334402 & 8439.1939967634 & -573.184343419384 \tabularnewline
7 & 8070.73197157178 & 8435.94440208651 & -365.212430514724 \tabularnewline
8 & 8397.71212493494 & 8432.69480740961 & -34.9826824746707 \tabularnewline
9 & 8677.27077903143 & 8429.44521273272 & 247.82556629871 \tabularnewline
10 & 8872.25247037607 & 8426.19561805582 & 446.056852320244 \tabularnewline
11 & 9169.30395437355 & 8422.94602337893 & 746.357930994623 \tabularnewline
12 & 8667.00486387727 & 8419.69642870204 & 247.308435175234 \tabularnewline
\hline
\end{tabular}
%Source: https://freestatistics.org/blog/index.php?pk=298146&T=2

[TABLE]
[ROW][C]Structural Time Series Model -- Extrapolation[/C][/ROW]
[ROW][C]t[/C][C]Observed[/C][C]Level[/C][C]Seasonal[/C][/ROW]
[ROW][C]1[/C][C]8546.44952756224[/C][C]8455.44197014787[/C][C]91.0075574143692[/C][/ROW]
[ROW][C]2[/C][C]8427.47257343231[/C][C]8452.19237547098[/C][C]-24.7198020386621[/C][/ROW]
[ROW][C]3[/C][C]8365.4234358874[/C][C]8448.94278079408[/C][C]-83.5193449066845[/C][/ROW]
[ROW][C]4[/C][C]8190.50114508339[/C][C]8445.69318611719[/C][C]-255.192041033802[/C][/ROW]
[ROW][C]5[/C][C]8000.69789362504[/C][C]8442.44359144029[/C][C]-441.745697815253[/C][/ROW]
[ROW][C]6[/C][C]7866.00965334402[/C][C]8439.1939967634[/C][C]-573.184343419384[/C][/ROW]
[ROW][C]7[/C][C]8070.73197157178[/C][C]8435.94440208651[/C][C]-365.212430514724[/C][/ROW]
[ROW][C]8[/C][C]8397.71212493494[/C][C]8432.69480740961[/C][C]-34.9826824746707[/C][/ROW]
[ROW][C]9[/C][C]8677.27077903143[/C][C]8429.44521273272[/C][C]247.82556629871[/C][/ROW]
[ROW][C]10[/C][C]8872.25247037607[/C][C]8426.19561805582[/C][C]446.056852320244[/C][/ROW]
[ROW][C]11[/C][C]9169.30395437355[/C][C]8422.94602337893[/C][C]746.357930994623[/C][/ROW]
[ROW][C]12[/C][C]8667.00486387727[/C][C]8419.69642870204[/C][C]247.308435175234[/C][/ROW]
[/TABLE]
Source: https://freestatistics.org/blog/index.php?pk=298146&T=2

Globally Unique Identifier (entire table): ba.freestatistics.org/blog/index.php?pk=298146&T=2

As an alternative you can also use a QR Code:  

The GUIDs for individual cells are displayed in the table below:

Structural Time Series Model -- Extrapolation
tObservedLevelSeasonal
18546.449527562248455.4419701478791.0075574143692
28427.472573432318452.19237547098-24.7198020386621
38365.42343588748448.94278079408-83.5193449066845
48190.501145083398445.69318611719-255.192041033802
58000.697893625048442.44359144029-441.745697815253
67866.009653344028439.1939967634-573.184343419384
78070.731971571788435.94440208651-365.212430514724
88397.712124934948432.69480740961-34.9826824746707
98677.270779031438429.44521273272247.82556629871
108872.252470376078426.19561805582446.056852320244
119169.303954373558422.94602337893746.357930994623
128667.004863877278419.69642870204247.308435175234


Parameters (Session):
par1 = 12 ; par2 = periodic ; par3 = 0 ; par5 = 1 ; par7 = 1 ; par8 = FALSE ;
Parameters (R input):
par1 = 12 ; par2 = 12 ; par3 = BFGS ;
R code (references can be found in the software module):
require('stsm')
require('stsm.class')
require('KFKSDS')
par1 <- as.numeric(par1)
par2 <- as.numeric(par2)
nx <- length(x)
x <- ts(x,frequency=par1)
m <- StructTS(x,type='BSM')
print(m$coef)
print(m$fitted)
print(m$resid)
mylevel <- as.numeric(m$fitted[,'level'])
myslope <- as.numeric(m$fitted[,'slope'])
myseas <- as.numeric(m$fitted[,'sea'])
myresid <- as.numeric(m$resid)
myfit <- mylevel+myseas
mm <- stsm.model(model = 'BSM', y = x, transPars = 'StructTS')
fit2 <- stsmFit(mm, stsm.method = 'maxlik.td.optim', method = par3, KF.args = list(P0cov = TRUE))
(fit2.comps <- tsSmooth(fit2, P0cov = FALSE)$states)
m2 <- set.pars(mm, pmax(fit2$par, .Machine$double.eps))
(ss <- char2numeric(m2))
(pred <- predict(ss, x, n.ahead = par2))
mylagmax <- nx/2
bitmap(file='test2.png')
op <- par(mfrow = c(2,2))
acf(as.numeric(x),lag.max = mylagmax,main='Observed')
acf(mylevel,na.action=na.pass,lag.max = mylagmax,main='Level')
acf(myseas,na.action=na.pass,lag.max = mylagmax,main='Seasonal')
acf(myresid,na.action=na.pass,lag.max = mylagmax,main='Standardized Residals')
par(op)
dev.off()
bitmap(file='test3.png')
op <- par(mfrow = c(2,2))
spectrum(as.numeric(x),main='Observed')
spectrum(mylevel,main='Level')
spectrum(myseas,main='Seasonal')
spectrum(myresid,main='Standardized Residals')
par(op)
dev.off()
bitmap(file='test4.png')
op <- par(mfrow = c(2,2))
cpgram(as.numeric(x),main='Observed')
cpgram(mylevel,main='Level')
cpgram(myseas,main='Seasonal')
cpgram(myresid,main='Standardized Residals')
par(op)
dev.off()
bitmap(file='test1.png')
plot(as.numeric(m$resid),main='Standardized Residuals',ylab='Residuals',xlab='time',type='b')
grid()
dev.off()
bitmap(file='test5.png')
op <- par(mfrow = c(2,2))
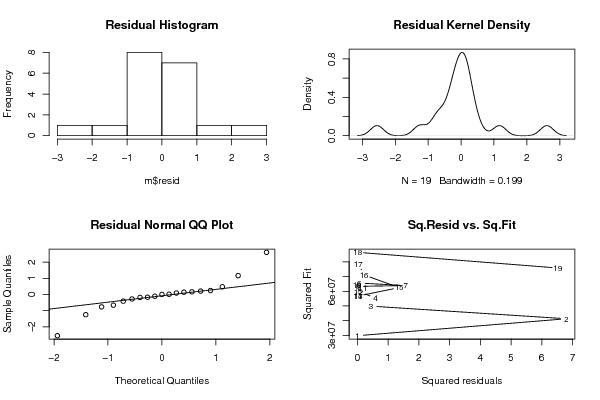
hist(m$resid,main='Residual Histogram')
plot(density(m$resid),main='Residual Kernel Density')
qqnorm(m$resid,main='Residual Normal QQ Plot')
qqline(m$resid)
plot(m$resid^2, myfit^2,main='Sq.Resid vs. Sq.Fit',xlab='Squared residuals',ylab='Squared Fit')
par(op)
dev.off()
bitmap(file='test6.png')
par(mfrow = c(3,1), mar = c(3,3,3,3))
plot(cbind(x, pred$pred), type = 'n', plot.type = 'single', ylab = '')
lines(x)
polygon(c(time(pred$pred), rev(time(pred$pred))), c(pred$pred + 2 * pred$se, rev(pred$pred)), col = 'gray85', border = NA)
polygon(c(time(pred$pred), rev(time(pred$pred))), c(pred$pred - 2 * pred$se, rev(pred$pred)), col = ' gray85', border = NA)
lines(pred$pred, col = 'blue', lwd = 1.5)
mtext(text = 'forecasts of the observed series', side = 3, adj = 0)
plot(cbind(x, pred$a[,1]), type = 'n', plot.type = 'single', ylab = '')
lines(x)
polygon(c(time(pred$a[,1]), rev(time(pred$a[,1]))), c(pred$a[,1] + 2 * sqrt(pred$P[,1]), rev(pred$a[,1])), col = 'gray85', border = NA)
polygon(c(time(pred$a[,1]), rev(time(pred$a[,1]))), c(pred$a[,1] - 2 * sqrt(pred$P[,1]), rev(pred$a[,1])), col = ' gray85', border = NA)
lines(pred$a[,1], col = 'blue', lwd = 1.5)
mtext(text = 'forecasts of the level component', side = 3, adj = 0)
plot(cbind(fit2.comps[,3], pred$a[,3]), type = 'n', plot.type = 'single', ylab = '')
lines(fit2.comps[,3])
polygon(c(time(pred$a[,3]), rev(time(pred$a[,3]))), c(pred$a[,3] + 2 * sqrt(pred$P[,3]), rev(pred$a[,3])), col = 'gray85', border = NA)
polygon(c(time(pred$a[,3]), rev(time(pred$a[,3]))), c(pred$a[,3] - 2 * sqrt(pred$P[,3]), rev(pred$a[,3])), col = ' gray85', border = NA)
lines(pred$a[,3], col = 'blue', lwd = 1.5)
mtext(text = 'forecasts of the seasonal component', side = 3, adj = 0)
dev.off()
load(file='createtable')
a<-table.start()
a<-table.row.start(a)
a<-table.element(a,'Structural Time Series Model -- Interpolation',6,TRUE)
a<-table.row.end(a)
a<-table.row.start(a)
a<-table.element(a,'t',header=TRUE)
a<-table.element(a,'Observed',header=TRUE)
a<-table.element(a,'Level',header=TRUE)
a<-table.element(a,'Slope',header=TRUE)
a<-table.element(a,'Seasonal',header=TRUE)
a<-table.element(a,'Stand. Residuals',header=TRUE)
a<-table.row.end(a)
for (i in 1:nx) {
a<-table.row.start(a)
a<-table.element(a,i,header=TRUE)
a<-table.element(a,x[i])
a<-table.element(a,mylevel[i])
a<-table.element(a,myslope[i])
a<-table.element(a,myseas[i])
a<-table.element(a,myresid[i])
a<-table.row.end(a)
}
a<-table.end(a)
table.save(a,file='mytable.tab')
a<-table.start()
a<-table.row.start(a)
a<-table.element(a,'Structural Time Series Model -- Extrapolation',4,TRUE)
a<-table.row.end(a)
a<-table.row.start(a)
a<-table.element(a,'t',header=TRUE)
a<-table.element(a,'Observed',header=TRUE)
a<-table.element(a,'Level',header=TRUE)
a<-table.element(a,'Seasonal',header=TRUE)
a<-table.row.end(a)
for (i in 1:par2) {
a<-table.row.start(a)
a<-table.element(a,i,header=TRUE)
a<-table.element(a,pred$pred[i])
a<-table.element(a,pred$a[i,1])
a<-table.element(a,pred$a[i,3])
a<-table.row.end(a)
}
a<-table.end(a)
table.save(a,file='mytable1.tab')