Free Statistics

of Irreproducible Research!

Author's title

Author*The author of this computation has been verified*
R Software Modulerwasp_decompose.wasp
Title produced by softwareClassical Decomposition
Date of computationWed, 07 Dec 2016 15:37:33 +0100
Cite this page as followsStatistical Computations at FreeStatistics.org, Office for Research Development and Education, URL https://freestatistics.org/blog/index.php?v=date/2016/Dec/07/t14811216250nlxq1umiefvt6z.htm/, Retrieved Tue, 07 May 2024 13:09:32 +0000
Statistical Computations at FreeStatistics.org, Office for Research Development and Education, URL https://freestatistics.org/blog/index.php?pk=298155, Retrieved Tue, 07 May 2024 13:09:32 +0000
QR Codes:

Original text written by user:
IsPrivate?No (this computation is public)
User-defined keywords
Estimated Impact49
Family? (F = Feedback message, R = changed R code, M = changed R Module, P = changed Parameters, D = changed Data)
-       [Classical Decomposition] [Classical Decompo...] [2016-12-07 14:37:33] [2322cf848a5cbdeb3105c2829b69db5d] [Current]
Feedback Forum

Post a new message
Dataseries X:
5692.4
5634.45
5555.38
5352.26
5233.07
4880.16
4861.88
4661.93
4330.68
3681.56
3540.08
3328.03
3254.92
3217.27
3301.29
4272.3
4424.8
4449.8
4678
4722.2
4708.9
4121.4
4230.6
4263
4241.9
4309.8
4457.9
4543.9
4937
4917.9
5041.1
5017.2
4833.9
4815.4
4785.9


Summary of computational transaction
Raw Input view raw input (R code)
Raw Outputview raw output of R engine
Computing time1 seconds
R ServerBig Analytics Cloud Computing Center

\begin{tabular}{lllllllll}
\hline
Summary of computational transaction \tabularnewline
Raw Input view raw input (R code)  \tabularnewline
Raw Outputview raw output of R engine  \tabularnewline
Computing time1 seconds \tabularnewline
R ServerBig Analytics Cloud Computing Center \tabularnewline
\hline
\end{tabular}
%Source: https://freestatistics.org/blog/index.php?pk=298155&T=0

[TABLE]
[ROW]
Summary of computational transaction[/C][/ROW] [ROW]Raw Input[/C] view raw input (R code) [/C][/ROW] [ROW]Raw Output[/C]view raw output of R engine [/C][/ROW] [ROW]Computing time[/C]1 seconds[/C][/ROW] [ROW]R Server[/C]Big Analytics Cloud Computing Center[/C][/ROW] [/TABLE] Source: https://freestatistics.org/blog/index.php?pk=298155&T=0

Globally Unique Identifier (entire table): ba.freestatistics.org/blog/index.php?pk=298155&T=0

As an alternative you can also use a QR Code:  

The GUIDs for individual cells are displayed in the table below:

Summary of computational transaction
Raw Input view raw input (R code)
Raw Outputview raw output of R engine
Computing time1 seconds
R ServerBig Analytics Cloud Computing Center


Classical Decomposition by Moving Averages
tObservationsFitTrendSeasonalRandom
15692.4NANA-421.743NA
25634.45NANA-417.753NA
35555.38NANA-319.578NA
45352.26NANA174.821NA
55233.07NANA398.045NA
64880.16NANA412.674NA
74861.885055.74627.76427.934-193.816
84661.934833.364425.48407.875-171.429
94330.684516.914230.85286.061-186.229
103681.563799.394091.93-292.544-117.825
113540.083727.584013.25-285.675-187.498
123328.033591.533961.64-370.118-263.495
133254.923514.313936.05-421.743-259.387
143217.273513.153930.9-417.753-295.876
153301.293629.593949.17-319.578-328.302
164272.34158.083983.26174.821114.223
174424.84428.44030.35398.045-3.59908
184449.84510.764098.08412.674-60.9574
1946784606.14178.16427.93471.9013
204722.24672.694264.81407.87549.5145
214708.94644.594358.52286.06164.3143
224121.44125.494418.03-292.544-4.0895
234230.64165.024450.69-285.67565.5832
2442634121.424491.54-370.118141.581
254241.94104.434526.17-421.743137.472
264309.84135.844553.59-417.753173.962
274457.94251.514571.09-319.578206.387
284543.94780.044605.22174.821-236.138
2949375055.324657.27398.045-118.316
304917.9NANA412.674NA
315041.1NANA427.934NA
325017.2NANA407.875NA
334833.9NANA286.061NA
344815.4NANA-292.544NA
354785.9NANA-285.675NA

\begin{tabular}{lllllllll}
\hline
Classical Decomposition by Moving Averages \tabularnewline
t & Observations & Fit & Trend & Seasonal & Random \tabularnewline
1 & 5692.4 & NA & NA & -421.743 & NA \tabularnewline
2 & 5634.45 & NA & NA & -417.753 & NA \tabularnewline
3 & 5555.38 & NA & NA & -319.578 & NA \tabularnewline
4 & 5352.26 & NA & NA & 174.821 & NA \tabularnewline
5 & 5233.07 & NA & NA & 398.045 & NA \tabularnewline
6 & 4880.16 & NA & NA & 412.674 & NA \tabularnewline
7 & 4861.88 & 5055.7 & 4627.76 & 427.934 & -193.816 \tabularnewline
8 & 4661.93 & 4833.36 & 4425.48 & 407.875 & -171.429 \tabularnewline
9 & 4330.68 & 4516.91 & 4230.85 & 286.061 & -186.229 \tabularnewline
10 & 3681.56 & 3799.39 & 4091.93 & -292.544 & -117.825 \tabularnewline
11 & 3540.08 & 3727.58 & 4013.25 & -285.675 & -187.498 \tabularnewline
12 & 3328.03 & 3591.53 & 3961.64 & -370.118 & -263.495 \tabularnewline
13 & 3254.92 & 3514.31 & 3936.05 & -421.743 & -259.387 \tabularnewline
14 & 3217.27 & 3513.15 & 3930.9 & -417.753 & -295.876 \tabularnewline
15 & 3301.29 & 3629.59 & 3949.17 & -319.578 & -328.302 \tabularnewline
16 & 4272.3 & 4158.08 & 3983.26 & 174.821 & 114.223 \tabularnewline
17 & 4424.8 & 4428.4 & 4030.35 & 398.045 & -3.59908 \tabularnewline
18 & 4449.8 & 4510.76 & 4098.08 & 412.674 & -60.9574 \tabularnewline
19 & 4678 & 4606.1 & 4178.16 & 427.934 & 71.9013 \tabularnewline
20 & 4722.2 & 4672.69 & 4264.81 & 407.875 & 49.5145 \tabularnewline
21 & 4708.9 & 4644.59 & 4358.52 & 286.061 & 64.3143 \tabularnewline
22 & 4121.4 & 4125.49 & 4418.03 & -292.544 & -4.0895 \tabularnewline
23 & 4230.6 & 4165.02 & 4450.69 & -285.675 & 65.5832 \tabularnewline
24 & 4263 & 4121.42 & 4491.54 & -370.118 & 141.581 \tabularnewline
25 & 4241.9 & 4104.43 & 4526.17 & -421.743 & 137.472 \tabularnewline
26 & 4309.8 & 4135.84 & 4553.59 & -417.753 & 173.962 \tabularnewline
27 & 4457.9 & 4251.51 & 4571.09 & -319.578 & 206.387 \tabularnewline
28 & 4543.9 & 4780.04 & 4605.22 & 174.821 & -236.138 \tabularnewline
29 & 4937 & 5055.32 & 4657.27 & 398.045 & -118.316 \tabularnewline
30 & 4917.9 & NA & NA & 412.674 & NA \tabularnewline
31 & 5041.1 & NA & NA & 427.934 & NA \tabularnewline
32 & 5017.2 & NA & NA & 407.875 & NA \tabularnewline
33 & 4833.9 & NA & NA & 286.061 & NA \tabularnewline
34 & 4815.4 & NA & NA & -292.544 & NA \tabularnewline
35 & 4785.9 & NA & NA & -285.675 & NA \tabularnewline
\hline
\end{tabular}
%Source: https://freestatistics.org/blog/index.php?pk=298155&T=1

[TABLE]
[ROW][C]Classical Decomposition by Moving Averages[/C][/ROW]
[ROW][C]t[/C][C]Observations[/C][C]Fit[/C][C]Trend[/C][C]Seasonal[/C][C]Random[/C][/ROW]
[ROW][C]1[/C][C]5692.4[/C][C]NA[/C][C]NA[/C][C]-421.743[/C][C]NA[/C][/ROW]
[ROW][C]2[/C][C]5634.45[/C][C]NA[/C][C]NA[/C][C]-417.753[/C][C]NA[/C][/ROW]
[ROW][C]3[/C][C]5555.38[/C][C]NA[/C][C]NA[/C][C]-319.578[/C][C]NA[/C][/ROW]
[ROW][C]4[/C][C]5352.26[/C][C]NA[/C][C]NA[/C][C]174.821[/C][C]NA[/C][/ROW]
[ROW][C]5[/C][C]5233.07[/C][C]NA[/C][C]NA[/C][C]398.045[/C][C]NA[/C][/ROW]
[ROW][C]6[/C][C]4880.16[/C][C]NA[/C][C]NA[/C][C]412.674[/C][C]NA[/C][/ROW]
[ROW][C]7[/C][C]4861.88[/C][C]5055.7[/C][C]4627.76[/C][C]427.934[/C][C]-193.816[/C][/ROW]
[ROW][C]8[/C][C]4661.93[/C][C]4833.36[/C][C]4425.48[/C][C]407.875[/C][C]-171.429[/C][/ROW]
[ROW][C]9[/C][C]4330.68[/C][C]4516.91[/C][C]4230.85[/C][C]286.061[/C][C]-186.229[/C][/ROW]
[ROW][C]10[/C][C]3681.56[/C][C]3799.39[/C][C]4091.93[/C][C]-292.544[/C][C]-117.825[/C][/ROW]
[ROW][C]11[/C][C]3540.08[/C][C]3727.58[/C][C]4013.25[/C][C]-285.675[/C][C]-187.498[/C][/ROW]
[ROW][C]12[/C][C]3328.03[/C][C]3591.53[/C][C]3961.64[/C][C]-370.118[/C][C]-263.495[/C][/ROW]
[ROW][C]13[/C][C]3254.92[/C][C]3514.31[/C][C]3936.05[/C][C]-421.743[/C][C]-259.387[/C][/ROW]
[ROW][C]14[/C][C]3217.27[/C][C]3513.15[/C][C]3930.9[/C][C]-417.753[/C][C]-295.876[/C][/ROW]
[ROW][C]15[/C][C]3301.29[/C][C]3629.59[/C][C]3949.17[/C][C]-319.578[/C][C]-328.302[/C][/ROW]
[ROW][C]16[/C][C]4272.3[/C][C]4158.08[/C][C]3983.26[/C][C]174.821[/C][C]114.223[/C][/ROW]
[ROW][C]17[/C][C]4424.8[/C][C]4428.4[/C][C]4030.35[/C][C]398.045[/C][C]-3.59908[/C][/ROW]
[ROW][C]18[/C][C]4449.8[/C][C]4510.76[/C][C]4098.08[/C][C]412.674[/C][C]-60.9574[/C][/ROW]
[ROW][C]19[/C][C]4678[/C][C]4606.1[/C][C]4178.16[/C][C]427.934[/C][C]71.9013[/C][/ROW]
[ROW][C]20[/C][C]4722.2[/C][C]4672.69[/C][C]4264.81[/C][C]407.875[/C][C]49.5145[/C][/ROW]
[ROW][C]21[/C][C]4708.9[/C][C]4644.59[/C][C]4358.52[/C][C]286.061[/C][C]64.3143[/C][/ROW]
[ROW][C]22[/C][C]4121.4[/C][C]4125.49[/C][C]4418.03[/C][C]-292.544[/C][C]-4.0895[/C][/ROW]
[ROW][C]23[/C][C]4230.6[/C][C]4165.02[/C][C]4450.69[/C][C]-285.675[/C][C]65.5832[/C][/ROW]
[ROW][C]24[/C][C]4263[/C][C]4121.42[/C][C]4491.54[/C][C]-370.118[/C][C]141.581[/C][/ROW]
[ROW][C]25[/C][C]4241.9[/C][C]4104.43[/C][C]4526.17[/C][C]-421.743[/C][C]137.472[/C][/ROW]
[ROW][C]26[/C][C]4309.8[/C][C]4135.84[/C][C]4553.59[/C][C]-417.753[/C][C]173.962[/C][/ROW]
[ROW][C]27[/C][C]4457.9[/C][C]4251.51[/C][C]4571.09[/C][C]-319.578[/C][C]206.387[/C][/ROW]
[ROW][C]28[/C][C]4543.9[/C][C]4780.04[/C][C]4605.22[/C][C]174.821[/C][C]-236.138[/C][/ROW]
[ROW][C]29[/C][C]4937[/C][C]5055.32[/C][C]4657.27[/C][C]398.045[/C][C]-118.316[/C][/ROW]
[ROW][C]30[/C][C]4917.9[/C][C]NA[/C][C]NA[/C][C]412.674[/C][C]NA[/C][/ROW]
[ROW][C]31[/C][C]5041.1[/C][C]NA[/C][C]NA[/C][C]427.934[/C][C]NA[/C][/ROW]
[ROW][C]32[/C][C]5017.2[/C][C]NA[/C][C]NA[/C][C]407.875[/C][C]NA[/C][/ROW]
[ROW][C]33[/C][C]4833.9[/C][C]NA[/C][C]NA[/C][C]286.061[/C][C]NA[/C][/ROW]
[ROW][C]34[/C][C]4815.4[/C][C]NA[/C][C]NA[/C][C]-292.544[/C][C]NA[/C][/ROW]
[ROW][C]35[/C][C]4785.9[/C][C]NA[/C][C]NA[/C][C]-285.675[/C][C]NA[/C][/ROW]
[/TABLE]
Source: https://freestatistics.org/blog/index.php?pk=298155&T=1

Globally Unique Identifier (entire table): ba.freestatistics.org/blog/index.php?pk=298155&T=1

As an alternative you can also use a QR Code:  

The GUIDs for individual cells are displayed in the table below:

Classical Decomposition by Moving Averages
tObservationsFitTrendSeasonalRandom
15692.4NANA-421.743NA
25634.45NANA-417.753NA
35555.38NANA-319.578NA
45352.26NANA174.821NA
55233.07NANA398.045NA
64880.16NANA412.674NA
74861.885055.74627.76427.934-193.816
84661.934833.364425.48407.875-171.429
94330.684516.914230.85286.061-186.229
103681.563799.394091.93-292.544-117.825
113540.083727.584013.25-285.675-187.498
123328.033591.533961.64-370.118-263.495
133254.923514.313936.05-421.743-259.387
143217.273513.153930.9-417.753-295.876
153301.293629.593949.17-319.578-328.302
164272.34158.083983.26174.821114.223
174424.84428.44030.35398.045-3.59908
184449.84510.764098.08412.674-60.9574
1946784606.14178.16427.93471.9013
204722.24672.694264.81407.87549.5145
214708.94644.594358.52286.06164.3143
224121.44125.494418.03-292.544-4.0895
234230.64165.024450.69-285.67565.5832
2442634121.424491.54-370.118141.581
254241.94104.434526.17-421.743137.472
264309.84135.844553.59-417.753173.962
274457.94251.514571.09-319.578206.387
284543.94780.044605.22174.821-236.138
2949375055.324657.27398.045-118.316
304917.9NANA412.674NA
315041.1NANA427.934NA
325017.2NANA407.875NA
334833.9NANA286.061NA
344815.4NANA-292.544NA
354785.9NANA-285.675NA


Parameters (Session):
par1 = additive ; par2 = 12 ;
Parameters (R input):
par1 = additive ; par2 = 12 ;
R code (references can be found in the software module):
par2 <- as.numeric(par2)
x <- ts(x,freq=par2)
m <- decompose(x,type=par1)
m$figure
bitmap(file='test1.png')
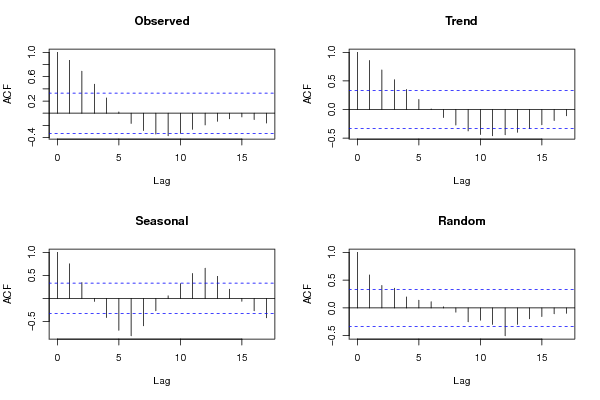
plot(m)
dev.off()
mylagmax <- length(x)/2
bitmap(file='test2.png')
op <- par(mfrow = c(2,2))
acf(as.numeric(x),lag.max = mylagmax,main='Observed')
acf(as.numeric(m$trend),na.action=na.pass,lag.max = mylagmax,main='Trend')
acf(as.numeric(m$seasonal),na.action=na.pass,lag.max = mylagmax,main='Seasonal')
acf(as.numeric(m$random),na.action=na.pass,lag.max = mylagmax,main='Random')
par(op)
dev.off()
bitmap(file='test3.png')
op <- par(mfrow = c(2,2))
spectrum(as.numeric(x),main='Observed')
spectrum(as.numeric(m$trend[!is.na(m$trend)]),main='Trend')
spectrum(as.numeric(m$seasonal[!is.na(m$seasonal)]),main='Seasonal')
spectrum(as.numeric(m$random[!is.na(m$random)]),main='Random')
par(op)
dev.off()
bitmap(file='test4.png')
op <- par(mfrow = c(2,2))
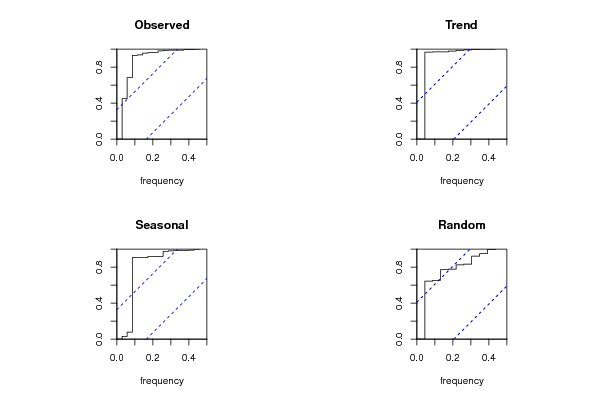
cpgram(as.numeric(x),main='Observed')
cpgram(as.numeric(m$trend[!is.na(m$trend)]),main='Trend')
cpgram(as.numeric(m$seasonal[!is.na(m$seasonal)]),main='Seasonal')
cpgram(as.numeric(m$random[!is.na(m$random)]),main='Random')
par(op)
dev.off()
load(file='createtable')
a<-table.start()
a<-table.row.start(a)
a<-table.element(a,'Classical Decomposition by Moving Averages',6,TRUE)
a<-table.row.end(a)
a<-table.row.start(a)
a<-table.element(a,'t',header=TRUE)
a<-table.element(a,'Observations',header=TRUE)
a<-table.element(a,'Fit',header=TRUE)
a<-table.element(a,'Trend',header=TRUE)
a<-table.element(a,'Seasonal',header=TRUE)
a<-table.element(a,'Random',header=TRUE)
a<-table.row.end(a)
for (i in 1:length(m$trend)) {
a<-table.row.start(a)
a<-table.element(a,i,header=TRUE)
a<-table.element(a,x[i])
if (par1 == 'additive') a<-table.element(a,signif(m$trend[i]+m$seasonal[i],6)) else a<-table.element(a,signif(m$trend[i]*m$seasonal[i],6))
a<-table.element(a,signif(m$trend[i],6))
a<-table.element(a,signif(m$seasonal[i],6))
a<-table.element(a,signif(m$random[i],6))
a<-table.row.end(a)
}
a<-table.end(a)
table.save(a,file='mytable.tab')