Free Statistics

of Irreproducible Research!

Author's title

Author*Unverified author*
R Software Modulerwasp_multipleregression.wasp
Title produced by softwareMultiple Regression
Date of computationWed, 07 Dec 2016 15:07:10 +0100
Cite this page as followsStatistical Computations at FreeStatistics.org, Office for Research Development and Education, URL https://freestatistics.org/blog/index.php?v=date/2016/Dec/07/t1481122336yvf2qbx0vwzryrm.htm/, Retrieved Tue, 07 May 2024 20:35:28 +0200
Statistical Computations at FreeStatistics.org, Office for Research Development and Education, URL https://freestatistics.org/blog/index.php?pk=, Retrieved Tue, 07 May 2024 20:35:28 +0200
QR Codes:

Original text written by user:
IsPrivate?This computation is private
User-defined keywords
Estimated Impact0
Dataseries X:
4	2	4	3	5	4	13
5	3	3	4	5	4	16
4	4	5	4	5	4	17
3	4	3	3	4	4	15
4	4	5	4	5	4	16
3	4	4	4	5	5	16
3	4	4	3	3	4	18
3	4	5	4	4	4	16
4	5	4	4	5	5	17
4	5	5	4	5	5	17
4	4	2	4	5	4	17
4	4	5	3	5	4	15
4	4	4	3	4	5	16
3	3	5	4	4	5	14
4	4	5	4	2	5	16
3	4	5	4	4	5	17
3	4	5	4	4	5	16
5	5	4	3	4	4	15
4	4	4	4	5	4	17
3	4	5	3	4	5	16
4	4	4	4	5	5	15
4	4	5	4	4	5	16
4	4	5	4	4	4	15
4	4	5	4	4	5	17
3	4	4	4	4	4	14
3	4	4	3	5	5	16
4	4	4	4	4	4	15
2	4	5	4	5	5	16
5	4	4	4	4	4	16
4	3	5	4	4	4	13
4	5	5	4	5	5	15
5	4	5	4	4	5	17
4	3	5	4	5	5	15
2	3	5	4	5	4	13
4	5	2	4	4	4	17
3	4	5	4	4	4	15
4	3	5	3	4	5	14
4	3	3	4	4	4	14
4	4	5	4	4	4	18
5	4	4	4	4	4	15
4	5	5	4	5	5	17
3	3	4	4	4	4	13
5	5	5	3	5	5	16
5	4	5	3	4	4	15
4	4	4	3	4	5	15
4	4	4	4	4	4	16
3	5	5	3	3	4	15
4	4	4	4	5	4	13
4	5	5	4	4	4	17
5	5	2	4	5	4	18
5	5	5	4	4	4	18
4	3	5	4	5	5	11
4	3	4	3	4	5	14
4	4	5	4	4	4	13
3	4	4	3	3	4	15
3	4	4	4	4	3	17
4	4	4	3	5	4	16
4	4	4	4	5	4	15
5	5	3	4	5	5	17
2	4	4	4	5	5	16
4	4	4	4	5	5	16
3	4	4	4	2	4	16
4	4	5	4	5	5	15
4	2	4	4	4	4	12
4	4	4	3	5	3	17
4	4	4	3	5	4	14
5	4	5	3	3	5	14
3	4	4	3	5	5	16
3	4	4	3	4	5	15
4	5	5	5	5	4	15
4	4	3	4	4	4	14
4	4	4	4	4	4	13
4	4	4	5	5	4	18
3	4	3	4	4	4	15
4	4	4	4	5	4	16
3	4	5	3	5	5	14
3	3	5	4	4	5	15
4	3	5	4	4	4	17
4	4	5	4	4	5	16
3	3	3	4	4	4	10
4	4	4	4	5	4	16
4	4	3	4	5	5	17
4	4	4	4	5	5	17
5	4	4	4	4	4	20
5	4	3	5	4	5	17
4	4	5	4	5	5	18
3	4	5	4	4	5	15
3	3	4	4	4	4	17
4	2	3	3	4	4	14
4	4	5	4	4	3	15
4	4	5	4	4	5	17
4	4	4	4	5	4	16
4	5	4	4	5	3	17
3	4	4	3	5	5	15
4	4	5	4	4	5	16
5	4	3	4	4	5	18
5	4	5	5	4	5	18
4	5	4	4	5	5	16
5	3	4	4	5	5	17
4	4	5	4	4	5	15
5	4	4	4	4	5	13
3	4	4	3	4	4	15
5	4	4	5	5	5	17
4	4	5	3	5	5	16
4	4	3	3	4	3	16
4	4	5	4	4	4	15
4	4	5	4	4	4	16
3	4	5	4	5	3	16
4	4	4	4	4	4	14
4	4	4	3	4	5	15
3	3	4	3	5	5	12
4	4	4	3	4	4	19
3	4	5	4	4	4	16
4	4	5	4	3	4	16
5	4	5	1	5	5	17
5	4	5	4	5	5	16
4	4	4	4	4	3	14
4	4	5	3	4	4	15
3	4	4	3	4	5	14
4	4	4	4	4	4	16
4	4	4	4	5	4	15
4	5	3	4	4	4	17
3	4	4	4	4	4	15
4	4	4	3	4	4	16
4	4	4	4	4	5	16
3	4	3	3	4	4	15
4	4	4	3	4	3	15
3	2	4	2	4	4	11
4	4	4	3	5	4	16
5	4	4	3	5	4	18
2	4	4	3	3	5	13
3	3	4	4	4	4	11
4	4	4	3	4	4	16
5	5	4	4	5	4	18
4	5	5	4	4	4	15
5	5	5	5	5	4	19
4	5	5	4	5	5	17
4	4	4	3	4	5	13
3	4	5	4	5	4	14
4	4	5	4	4	4	16
4	4	2	4	4	4	13
4	4	3	4	5	5	17
4	4	4	4	5	5	14
5	4	5	3	5	4	19
4	3	5	4	4	4	14
4	4	5	4	4	4	16
3	3	2	3	4	4	12
4	5	5	4	4	3	16
4	4	4	3	4	4	16
4	4	4	4	4	5	15
3	4	5	3	5	5	12
4	4	5	4	4	5	15
5	4	5	4	5	4	17
4	4	5	4	3	4	14
2	3	5	4	4	4	15
4	4	4	4	4	5	18
4	3	4	3	5	5	15
4	4	4	4	4	3	18
4	5	5	5	4	4	15
5	4	3	4	4	4	15
5	4	4	3	4	4	16
3	3	1	4	5	5	13
4	4	4	4	4	5	16
4	4	4	4	5	4	14
2	3	4	5	5	4	16


Summary of computational transaction
Raw Input view raw input (R code)
Raw Outputview raw output of R engine
Computing time8 seconds
R ServerBig Analytics Cloud Computing Center

\begin{tabular}{lllllllll}
\hline
Summary of computational transaction \tabularnewline
Raw Input view raw input (R code)  \tabularnewline
Raw Outputview raw output of R engine  \tabularnewline
Computing time8 seconds \tabularnewline
R ServerBig Analytics Cloud Computing Center \tabularnewline
\hline
\end{tabular}
%Source: https://freestatistics.org/blog/index.php?pk=&T=0

[TABLE]
[ROW]
Summary of computational transaction[/C][/ROW] [ROW]Raw Input[/C] view raw input (R code) [/C][/ROW] [ROW]Raw Output[/C]view raw output of R engine [/C][/ROW] [ROW]Computing time[/C]8 seconds[/C][/ROW] [ROW]R Server[/C]Big Analytics Cloud Computing Center[/C][/ROW] [/TABLE] Source: https://freestatistics.org/blog/index.php?pk=&T=0

Globally Unique Identifier (entire table): ba.freestatistics.org/blog/index.php?pk=&T=0

As an alternative you can also use a QR Code:  

The GUIDs for individual cells are displayed in the table below:

Summary of computational transaction
Raw Input view raw input (R code)
Raw Outputview raw output of R engine
Computing time8 seconds
R ServerBig Analytics Cloud Computing Center


Multiple Linear Regression - Estimated Regression Equation
TVDC[t] = + 6.79398 + 0.562836SK1[t] + 1.10586SK2[t] + 0.0919962SK3[t] + 0.287161SK4[t] + 0.202138SK5[t] -0.039412SK6[t] + e[t]

\begin{tabular}{lllllllll}
\hline
Multiple Linear Regression - Estimated Regression Equation \tabularnewline
TVDC[t] =  +  6.79398 +  0.562836SK1[t] +  1.10586SK2[t] +  0.0919962SK3[t] +  0.287161SK4[t] +  0.202138SK5[t] -0.039412SK6[t]  + e[t] \tabularnewline
 \tabularnewline
\hline
\end{tabular}
%Source: https://freestatistics.org/blog/index.php?pk=&T=1

[TABLE]
[ROW][C]Multiple Linear Regression - Estimated Regression Equation[/C][/ROW]
[ROW][C]TVDC[t] =  +  6.79398 +  0.562836SK1[t] +  1.10586SK2[t] +  0.0919962SK3[t] +  0.287161SK4[t] +  0.202138SK5[t] -0.039412SK6[t]  + e[t][/C][/ROW]
[ROW][C][/C][/ROW]
[/TABLE]
Source: https://freestatistics.org/blog/index.php?pk=&T=1

Globally Unique Identifier (entire table): ba.freestatistics.org/blog/index.php?pk=&T=1

As an alternative you can also use a QR Code:  

The GUIDs for individual cells are displayed in the table below:

Multiple Linear Regression - Estimated Regression Equation
TVDC[t] = + 6.79398 + 0.562836SK1[t] + 1.10586SK2[t] + 0.0919962SK3[t] + 0.287161SK4[t] + 0.202138SK5[t] -0.039412SK6[t] + e[t]


Multiple Linear Regression - Ordinary Least Squares
VariableParameterS.D.T-STATH0: parameter = 02-tail p-value1-tail p-value
(Intercept)+6.794 1.515+4.4850e+00 1.395e-05 6.976e-06
SK1+0.5628 0.1618+3.4790e+00 0.0006498 0.0003249
SK2+1.106 0.195+5.6720e+00 6.546e-08 3.273e-08
SK3+0.092 0.1434+6.4170e-01 0.522 0.261
SK4+0.2872 0.1952+1.4710e+00 0.1432 0.07158
SK5+0.2021 0.1855+1.0900e+00 0.2774 0.1387
SK6-0.03941 0.193-2.0420e-01 0.8385 0.4192

\begin{tabular}{lllllllll}
\hline
Multiple Linear Regression - Ordinary Least Squares \tabularnewline
Variable & Parameter & S.D. & T-STATH0: parameter = 0 & 2-tail p-value & 1-tail p-value \tabularnewline
(Intercept) & +6.794 &  1.515 & +4.4850e+00 &  1.395e-05 &  6.976e-06 \tabularnewline
SK1 & +0.5628 &  0.1618 & +3.4790e+00 &  0.0006498 &  0.0003249 \tabularnewline
SK2 & +1.106 &  0.195 & +5.6720e+00 &  6.546e-08 &  3.273e-08 \tabularnewline
SK3 & +0.092 &  0.1434 & +6.4170e-01 &  0.522 &  0.261 \tabularnewline
SK4 & +0.2872 &  0.1952 & +1.4710e+00 &  0.1432 &  0.07158 \tabularnewline
SK5 & +0.2021 &  0.1855 & +1.0900e+00 &  0.2774 &  0.1387 \tabularnewline
SK6 & -0.03941 &  0.193 & -2.0420e-01 &  0.8385 &  0.4192 \tabularnewline
\hline
\end{tabular}
%Source: https://freestatistics.org/blog/index.php?pk=&T=2

[TABLE]
[ROW][C]Multiple Linear Regression - Ordinary Least Squares[/C][/ROW]
[ROW][C]Variable[/C][C]Parameter[/C][C]S.D.[/C][C]T-STATH0: parameter = 0[/C][C]2-tail p-value[/C][C]1-tail p-value[/C][/ROW]
[ROW][C](Intercept)[/C][C]+6.794[/C][C] 1.515[/C][C]+4.4850e+00[/C][C] 1.395e-05[/C][C] 6.976e-06[/C][/ROW]
[ROW][C]SK1[/C][C]+0.5628[/C][C] 0.1618[/C][C]+3.4790e+00[/C][C] 0.0006498[/C][C] 0.0003249[/C][/ROW]
[ROW][C]SK2[/C][C]+1.106[/C][C] 0.195[/C][C]+5.6720e+00[/C][C] 6.546e-08[/C][C] 3.273e-08[/C][/ROW]
[ROW][C]SK3[/C][C]+0.092[/C][C] 0.1434[/C][C]+6.4170e-01[/C][C] 0.522[/C][C] 0.261[/C][/ROW]
[ROW][C]SK4[/C][C]+0.2872[/C][C] 0.1952[/C][C]+1.4710e+00[/C][C] 0.1432[/C][C] 0.07158[/C][/ROW]
[ROW][C]SK5[/C][C]+0.2021[/C][C] 0.1855[/C][C]+1.0900e+00[/C][C] 0.2774[/C][C] 0.1387[/C][/ROW]
[ROW][C]SK6[/C][C]-0.03941[/C][C] 0.193[/C][C]-2.0420e-01[/C][C] 0.8385[/C][C] 0.4192[/C][/ROW]
[/TABLE]
Source: https://freestatistics.org/blog/index.php?pk=&T=2

Globally Unique Identifier (entire table): ba.freestatistics.org/blog/index.php?pk=&T=2

As an alternative you can also use a QR Code:  

The GUIDs for individual cells are displayed in the table below:

Multiple Linear Regression - Ordinary Least Squares
VariableParameterS.D.T-STATH0: parameter = 02-tail p-value1-tail p-value
(Intercept)+6.794 1.515+4.4850e+00 1.395e-05 6.976e-06
SK1+0.5628 0.1618+3.4790e+00 0.0006498 0.0003249
SK2+1.106 0.195+5.6720e+00 6.546e-08 3.273e-08
SK3+0.092 0.1434+6.4170e-01 0.522 0.261
SK4+0.2872 0.1952+1.4710e+00 0.1432 0.07158
SK5+0.2021 0.1855+1.0900e+00 0.2774 0.1387
SK6-0.03941 0.193-2.0420e-01 0.8385 0.4192


Multiple Linear Regression - Regression Statistics
Multiple R 0.56
R-squared 0.3136
Adjusted R-squared 0.2875
F-TEST (value) 12.03
F-TEST (DF numerator)6
F-TEST (DF denominator)158
p-value 4.134e-11
Multiple Linear Regression - Residual Statistics
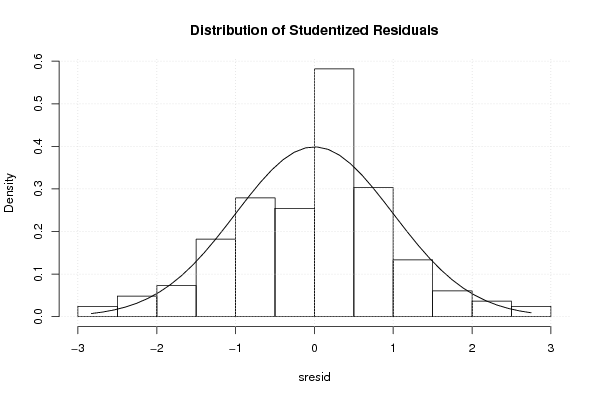
Residual Standard Deviation 1.431
Sum Squared Residuals 323.5

\begin{tabular}{lllllllll}
\hline
Multiple Linear Regression - Regression Statistics \tabularnewline
Multiple R &  0.56 \tabularnewline
R-squared &  0.3136 \tabularnewline
Adjusted R-squared &  0.2875 \tabularnewline
F-TEST (value) &  12.03 \tabularnewline
F-TEST (DF numerator) & 6 \tabularnewline
F-TEST (DF denominator) & 158 \tabularnewline
p-value &  4.134e-11 \tabularnewline
Multiple Linear Regression - Residual Statistics \tabularnewline
Residual Standard Deviation &  1.431 \tabularnewline
Sum Squared Residuals &  323.5 \tabularnewline
\hline
\end{tabular}
%Source: https://freestatistics.org/blog/index.php?pk=&T=3

[TABLE]
[ROW][C]Multiple Linear Regression - Regression Statistics[/C][/ROW]
[ROW][C]Multiple R[/C][C] 0.56[/C][/ROW]
[ROW][C]R-squared[/C][C] 0.3136[/C][/ROW]
[ROW][C]Adjusted R-squared[/C][C] 0.2875[/C][/ROW]
[ROW][C]F-TEST (value)[/C][C] 12.03[/C][/ROW]
[ROW][C]F-TEST (DF numerator)[/C][C]6[/C][/ROW]
[ROW][C]F-TEST (DF denominator)[/C][C]158[/C][/ROW]
[ROW][C]p-value[/C][C] 4.134e-11[/C][/ROW]
[ROW][C]Multiple Linear Regression - Residual Statistics[/C][/ROW]
[ROW][C]Residual Standard Deviation[/C][C] 1.431[/C][/ROW]
[ROW][C]Sum Squared Residuals[/C][C] 323.5[/C][/ROW]
[/TABLE]
Source: https://freestatistics.org/blog/index.php?pk=&T=3

Globally Unique Identifier (entire table): ba.freestatistics.org/blog/index.php?pk=&T=3

As an alternative you can also use a QR Code:  

The GUIDs for individual cells are displayed in the table below:

Multiple Linear Regression - Regression Statistics
Multiple R 0.56
R-squared 0.3136
Adjusted R-squared 0.2875
F-TEST (value) 12.03
F-TEST (DF numerator)6
F-TEST (DF denominator)158
p-value 4.134e-11
Multiple Linear Regression - Residual Statistics
Residual Standard Deviation 1.431
Sum Squared Residuals 323.5


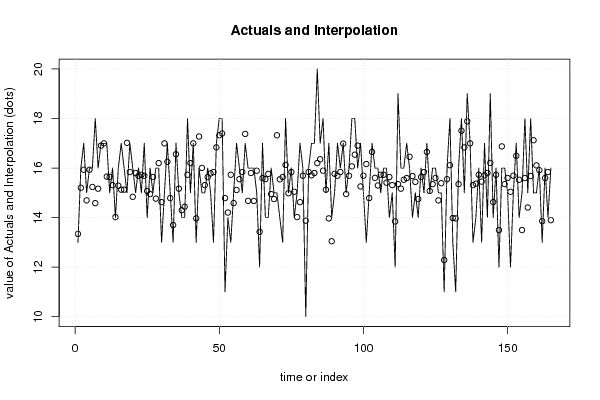
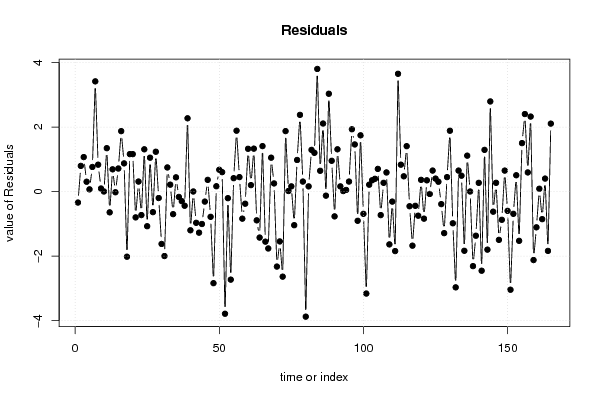
Multiple Linear Regression - Actuals, Interpolation, and Residuals
Time or IndexActualsInterpolationForecastResidualsPrediction Error
1 13 13.34-0.3396
2 16 15.2 0.7966
3 17 15.93 1.07
4 15 14.69 0.3057
5 16 15.93 0.06957
6 16 15.24 0.7638
7 18 14.58 3.416
8 16 15.17 0.8345
9 17 16.9 0.09512
10 17 17 0.003121
11 17 15.65 1.346
12 15 15.64-0.6433
13 16 15.31 0.6903
14 14 14.02-0.02019
15 16 15.28 0.7154
16 17 15.13 1.874
17 16 15.13 0.874
18 15 17.02-2.018
19 17 15.84 1.162
20 16 14.84 1.161
21 15 15.8-0.799
22 16 15.69 0.3111
23 15 15.73-0.7283
24 17 15.69 1.311
25 14 15.07-1.073
26 16 14.95 1.051
27 15 15.64-0.6363
28 16 14.77 1.235
29 16 16.2-0.1991
30 13 14.62-1.622
31 15 17-1.997
32 17 16.25 0.7483
33 15 14.79 0.2148
34 13 13.7-0.6989
35 17 16.56 0.4418
36 15 15.17-0.1655
37 14 14.3-0.2959
38 14 14.44-0.4384
39 18 15.73 2.272
40 15 16.2-1.199
41 17 17 0.003121
42 13 13.97-0.9676
43 16 17.27-1.273
44 15 16-1.004
45 15 15.31-0.3097
46 16 15.64 0.3637
47 15 15.78-0.782
48 13 15.84-2.838
49 17 16.83 0.1658
50 18 17.32 0.6769
51 18 17.4 0.603
52 11 14.79-3.785
53 14 14.2-0.2039
54 13 15.73-2.728
55 15 14.58 0.4158
56 17 15.11 1.887
57 16 15.55 0.4487
58 15 15.84-0.8384
59 17 17.38-0.3757
60 16 14.67 1.327
61 16 15.8 0.201
62 16 14.67 1.331
63 15 15.89-0.891
64 12 13.42-1.425
65 17 15.59 1.409
66 14 15.55-1.551
67 14 15.76-1.762
68 16 14.95 1.051
69 15 14.75 0.2531
70 15 17.32-2.323
71 14 15.54-1.544
72 13 15.64-2.636
73 18 16.13 1.874
74 15 14.98 0.01853
75 16 15.84 0.1616
76 14 15.04-1.041
77 15 14.02 0.9798
78 17 14.62 2.378
79 16 15.69 0.3111
80 10 13.88-3.876
81 16 15.84 0.1616
82 17 15.71 1.293
83 17 15.8 1.201
84 20 16.2 3.801
85 17 16.35 0.6451
86 18 15.89 2.109
87 15 15.13-0.126
88 17 13.97 3.032
89 14 13.05 0.9546
90 15 15.77-0.7677
91 17 15.69 1.311
92 16 15.84 0.1616
93 17 16.98 0.01629
94 15 14.95 0.05097
95 16 15.69 0.3111
96 18 16.07 1.932
97 18 16.54 1.461
98 16 16.9-0.9049
99 17 15.26 1.744
100 15 15.69-0.6889
101 13 16.16-3.16
102 15 14.79 0.2137
103 17 16.65 0.351
104 16 15.6 0.3961
105 16 15.3 0.7034
106 15 15.73-0.7283
107 16 15.73 0.2717
108 16 15.41 0.593
109 14 15.64-1.636
110 15 15.31-0.3097
111 12 13.84-1.843
112 19 15.35 3.651
113 16 15.17 0.8345
114 16 15.53 0.4738
115 17 15.59 1.408
116 16 16.45-0.4539
117 14 15.68-1.676
118 15 15.44-0.4411
119 14 14.75-0.7469
120 16 15.64 0.3637
121 15 15.84-0.8384
122 17 16.65 0.3498
123 15 15.07-0.07346
124 16 15.35 0.6509
125 16 15.6 0.4031
126 15 14.69 0.3057
127 15 15.39-0.3885
128 11 12.29-1.287
129 16 15.55 0.4487
130 18 16.11 1.886
131 13 13.98-0.9819
132 11 13.97-2.968
133 16 15.35 0.6509
134 18 17.51 0.4929
135 15 16.83-1.834
136 19 17.89 1.114
137 17 17 0.003121
138 13 15.31-2.31
139 14 15.37-1.368
140 16 15.73 0.2717
141 13 15.45-2.452
142 17 15.71 1.293
143 14 15.8-1.799
144 19 16.21 2.794
145 14 14.62-0.6224
146 16 15.73 0.2717
147 12 13.5-1.496
148 16 16.87-0.8736
149 16 15.35 0.6509
150 15 15.6-0.5969
151 12 15.04-3.041
152 15 15.69-0.6889
153 17 16.49 0.5067
154 14 15.53-1.526
155 15 13.5 1.503
156 18 15.6 2.403
157 15 14.41 0.594
158 18 15.68 2.324
159 15 17.12-2.121
160 15 16.11-1.107
161 16 15.91 0.08803
162 13 13.85-0.8543
163 16 15.6 0.4031
164 14 15.84-1.838
165 16 13.89 2.106

\begin{tabular}{lllllllll}
\hline
Multiple Linear Regression - Actuals, Interpolation, and Residuals \tabularnewline
Time or Index & Actuals & InterpolationForecast & ResidualsPrediction Error \tabularnewline
1 &  13 &  13.34 & -0.3396 \tabularnewline
2 &  16 &  15.2 &  0.7966 \tabularnewline
3 &  17 &  15.93 &  1.07 \tabularnewline
4 &  15 &  14.69 &  0.3057 \tabularnewline
5 &  16 &  15.93 &  0.06957 \tabularnewline
6 &  16 &  15.24 &  0.7638 \tabularnewline
7 &  18 &  14.58 &  3.416 \tabularnewline
8 &  16 &  15.17 &  0.8345 \tabularnewline
9 &  17 &  16.9 &  0.09512 \tabularnewline
10 &  17 &  17 &  0.003121 \tabularnewline
11 &  17 &  15.65 &  1.346 \tabularnewline
12 &  15 &  15.64 & -0.6433 \tabularnewline
13 &  16 &  15.31 &  0.6903 \tabularnewline
14 &  14 &  14.02 & -0.02019 \tabularnewline
15 &  16 &  15.28 &  0.7154 \tabularnewline
16 &  17 &  15.13 &  1.874 \tabularnewline
17 &  16 &  15.13 &  0.874 \tabularnewline
18 &  15 &  17.02 & -2.018 \tabularnewline
19 &  17 &  15.84 &  1.162 \tabularnewline
20 &  16 &  14.84 &  1.161 \tabularnewline
21 &  15 &  15.8 & -0.799 \tabularnewline
22 &  16 &  15.69 &  0.3111 \tabularnewline
23 &  15 &  15.73 & -0.7283 \tabularnewline
24 &  17 &  15.69 &  1.311 \tabularnewline
25 &  14 &  15.07 & -1.073 \tabularnewline
26 &  16 &  14.95 &  1.051 \tabularnewline
27 &  15 &  15.64 & -0.6363 \tabularnewline
28 &  16 &  14.77 &  1.235 \tabularnewline
29 &  16 &  16.2 & -0.1991 \tabularnewline
30 &  13 &  14.62 & -1.622 \tabularnewline
31 &  15 &  17 & -1.997 \tabularnewline
32 &  17 &  16.25 &  0.7483 \tabularnewline
33 &  15 &  14.79 &  0.2148 \tabularnewline
34 &  13 &  13.7 & -0.6989 \tabularnewline
35 &  17 &  16.56 &  0.4418 \tabularnewline
36 &  15 &  15.17 & -0.1655 \tabularnewline
37 &  14 &  14.3 & -0.2959 \tabularnewline
38 &  14 &  14.44 & -0.4384 \tabularnewline
39 &  18 &  15.73 &  2.272 \tabularnewline
40 &  15 &  16.2 & -1.199 \tabularnewline
41 &  17 &  17 &  0.003121 \tabularnewline
42 &  13 &  13.97 & -0.9676 \tabularnewline
43 &  16 &  17.27 & -1.273 \tabularnewline
44 &  15 &  16 & -1.004 \tabularnewline
45 &  15 &  15.31 & -0.3097 \tabularnewline
46 &  16 &  15.64 &  0.3637 \tabularnewline
47 &  15 &  15.78 & -0.782 \tabularnewline
48 &  13 &  15.84 & -2.838 \tabularnewline
49 &  17 &  16.83 &  0.1658 \tabularnewline
50 &  18 &  17.32 &  0.6769 \tabularnewline
51 &  18 &  17.4 &  0.603 \tabularnewline
52 &  11 &  14.79 & -3.785 \tabularnewline
53 &  14 &  14.2 & -0.2039 \tabularnewline
54 &  13 &  15.73 & -2.728 \tabularnewline
55 &  15 &  14.58 &  0.4158 \tabularnewline
56 &  17 &  15.11 &  1.887 \tabularnewline
57 &  16 &  15.55 &  0.4487 \tabularnewline
58 &  15 &  15.84 & -0.8384 \tabularnewline
59 &  17 &  17.38 & -0.3757 \tabularnewline
60 &  16 &  14.67 &  1.327 \tabularnewline
61 &  16 &  15.8 &  0.201 \tabularnewline
62 &  16 &  14.67 &  1.331 \tabularnewline
63 &  15 &  15.89 & -0.891 \tabularnewline
64 &  12 &  13.42 & -1.425 \tabularnewline
65 &  17 &  15.59 &  1.409 \tabularnewline
66 &  14 &  15.55 & -1.551 \tabularnewline
67 &  14 &  15.76 & -1.762 \tabularnewline
68 &  16 &  14.95 &  1.051 \tabularnewline
69 &  15 &  14.75 &  0.2531 \tabularnewline
70 &  15 &  17.32 & -2.323 \tabularnewline
71 &  14 &  15.54 & -1.544 \tabularnewline
72 &  13 &  15.64 & -2.636 \tabularnewline
73 &  18 &  16.13 &  1.874 \tabularnewline
74 &  15 &  14.98 &  0.01853 \tabularnewline
75 &  16 &  15.84 &  0.1616 \tabularnewline
76 &  14 &  15.04 & -1.041 \tabularnewline
77 &  15 &  14.02 &  0.9798 \tabularnewline
78 &  17 &  14.62 &  2.378 \tabularnewline
79 &  16 &  15.69 &  0.3111 \tabularnewline
80 &  10 &  13.88 & -3.876 \tabularnewline
81 &  16 &  15.84 &  0.1616 \tabularnewline
82 &  17 &  15.71 &  1.293 \tabularnewline
83 &  17 &  15.8 &  1.201 \tabularnewline
84 &  20 &  16.2 &  3.801 \tabularnewline
85 &  17 &  16.35 &  0.6451 \tabularnewline
86 &  18 &  15.89 &  2.109 \tabularnewline
87 &  15 &  15.13 & -0.126 \tabularnewline
88 &  17 &  13.97 &  3.032 \tabularnewline
89 &  14 &  13.05 &  0.9546 \tabularnewline
90 &  15 &  15.77 & -0.7677 \tabularnewline
91 &  17 &  15.69 &  1.311 \tabularnewline
92 &  16 &  15.84 &  0.1616 \tabularnewline
93 &  17 &  16.98 &  0.01629 \tabularnewline
94 &  15 &  14.95 &  0.05097 \tabularnewline
95 &  16 &  15.69 &  0.3111 \tabularnewline
96 &  18 &  16.07 &  1.932 \tabularnewline
97 &  18 &  16.54 &  1.461 \tabularnewline
98 &  16 &  16.9 & -0.9049 \tabularnewline
99 &  17 &  15.26 &  1.744 \tabularnewline
100 &  15 &  15.69 & -0.6889 \tabularnewline
101 &  13 &  16.16 & -3.16 \tabularnewline
102 &  15 &  14.79 &  0.2137 \tabularnewline
103 &  17 &  16.65 &  0.351 \tabularnewline
104 &  16 &  15.6 &  0.3961 \tabularnewline
105 &  16 &  15.3 &  0.7034 \tabularnewline
106 &  15 &  15.73 & -0.7283 \tabularnewline
107 &  16 &  15.73 &  0.2717 \tabularnewline
108 &  16 &  15.41 &  0.593 \tabularnewline
109 &  14 &  15.64 & -1.636 \tabularnewline
110 &  15 &  15.31 & -0.3097 \tabularnewline
111 &  12 &  13.84 & -1.843 \tabularnewline
112 &  19 &  15.35 &  3.651 \tabularnewline
113 &  16 &  15.17 &  0.8345 \tabularnewline
114 &  16 &  15.53 &  0.4738 \tabularnewline
115 &  17 &  15.59 &  1.408 \tabularnewline
116 &  16 &  16.45 & -0.4539 \tabularnewline
117 &  14 &  15.68 & -1.676 \tabularnewline
118 &  15 &  15.44 & -0.4411 \tabularnewline
119 &  14 &  14.75 & -0.7469 \tabularnewline
120 &  16 &  15.64 &  0.3637 \tabularnewline
121 &  15 &  15.84 & -0.8384 \tabularnewline
122 &  17 &  16.65 &  0.3498 \tabularnewline
123 &  15 &  15.07 & -0.07346 \tabularnewline
124 &  16 &  15.35 &  0.6509 \tabularnewline
125 &  16 &  15.6 &  0.4031 \tabularnewline
126 &  15 &  14.69 &  0.3057 \tabularnewline
127 &  15 &  15.39 & -0.3885 \tabularnewline
128 &  11 &  12.29 & -1.287 \tabularnewline
129 &  16 &  15.55 &  0.4487 \tabularnewline
130 &  18 &  16.11 &  1.886 \tabularnewline
131 &  13 &  13.98 & -0.9819 \tabularnewline
132 &  11 &  13.97 & -2.968 \tabularnewline
133 &  16 &  15.35 &  0.6509 \tabularnewline
134 &  18 &  17.51 &  0.4929 \tabularnewline
135 &  15 &  16.83 & -1.834 \tabularnewline
136 &  19 &  17.89 &  1.114 \tabularnewline
137 &  17 &  17 &  0.003121 \tabularnewline
138 &  13 &  15.31 & -2.31 \tabularnewline
139 &  14 &  15.37 & -1.368 \tabularnewline
140 &  16 &  15.73 &  0.2717 \tabularnewline
141 &  13 &  15.45 & -2.452 \tabularnewline
142 &  17 &  15.71 &  1.293 \tabularnewline
143 &  14 &  15.8 & -1.799 \tabularnewline
144 &  19 &  16.21 &  2.794 \tabularnewline
145 &  14 &  14.62 & -0.6224 \tabularnewline
146 &  16 &  15.73 &  0.2717 \tabularnewline
147 &  12 &  13.5 & -1.496 \tabularnewline
148 &  16 &  16.87 & -0.8736 \tabularnewline
149 &  16 &  15.35 &  0.6509 \tabularnewline
150 &  15 &  15.6 & -0.5969 \tabularnewline
151 &  12 &  15.04 & -3.041 \tabularnewline
152 &  15 &  15.69 & -0.6889 \tabularnewline
153 &  17 &  16.49 &  0.5067 \tabularnewline
154 &  14 &  15.53 & -1.526 \tabularnewline
155 &  15 &  13.5 &  1.503 \tabularnewline
156 &  18 &  15.6 &  2.403 \tabularnewline
157 &  15 &  14.41 &  0.594 \tabularnewline
158 &  18 &  15.68 &  2.324 \tabularnewline
159 &  15 &  17.12 & -2.121 \tabularnewline
160 &  15 &  16.11 & -1.107 \tabularnewline
161 &  16 &  15.91 &  0.08803 \tabularnewline
162 &  13 &  13.85 & -0.8543 \tabularnewline
163 &  16 &  15.6 &  0.4031 \tabularnewline
164 &  14 &  15.84 & -1.838 \tabularnewline
165 &  16 &  13.89 &  2.106 \tabularnewline
\hline
\end{tabular}
%Source: https://freestatistics.org/blog/index.php?pk=&T=4

[TABLE]
[ROW][C]Multiple Linear Regression - Actuals, Interpolation, and Residuals[/C][/ROW]
[ROW][C]Time or Index[/C][C]Actuals[/C][C]InterpolationForecast[/C][C]ResidualsPrediction Error[/C][/ROW]
[ROW][C]1[/C][C] 13[/C][C] 13.34[/C][C]-0.3396[/C][/ROW]
[ROW][C]2[/C][C] 16[/C][C] 15.2[/C][C] 0.7966[/C][/ROW]
[ROW][C]3[/C][C] 17[/C][C] 15.93[/C][C] 1.07[/C][/ROW]
[ROW][C]4[/C][C] 15[/C][C] 14.69[/C][C] 0.3057[/C][/ROW]
[ROW][C]5[/C][C] 16[/C][C] 15.93[/C][C] 0.06957[/C][/ROW]
[ROW][C]6[/C][C] 16[/C][C] 15.24[/C][C] 0.7638[/C][/ROW]
[ROW][C]7[/C][C] 18[/C][C] 14.58[/C][C] 3.416[/C][/ROW]
[ROW][C]8[/C][C] 16[/C][C] 15.17[/C][C] 0.8345[/C][/ROW]
[ROW][C]9[/C][C] 17[/C][C] 16.9[/C][C] 0.09512[/C][/ROW]
[ROW][C]10[/C][C] 17[/C][C] 17[/C][C] 0.003121[/C][/ROW]
[ROW][C]11[/C][C] 17[/C][C] 15.65[/C][C] 1.346[/C][/ROW]
[ROW][C]12[/C][C] 15[/C][C] 15.64[/C][C]-0.6433[/C][/ROW]
[ROW][C]13[/C][C] 16[/C][C] 15.31[/C][C] 0.6903[/C][/ROW]
[ROW][C]14[/C][C] 14[/C][C] 14.02[/C][C]-0.02019[/C][/ROW]
[ROW][C]15[/C][C] 16[/C][C] 15.28[/C][C] 0.7154[/C][/ROW]
[ROW][C]16[/C][C] 17[/C][C] 15.13[/C][C] 1.874[/C][/ROW]
[ROW][C]17[/C][C] 16[/C][C] 15.13[/C][C] 0.874[/C][/ROW]
[ROW][C]18[/C][C] 15[/C][C] 17.02[/C][C]-2.018[/C][/ROW]
[ROW][C]19[/C][C] 17[/C][C] 15.84[/C][C] 1.162[/C][/ROW]
[ROW][C]20[/C][C] 16[/C][C] 14.84[/C][C] 1.161[/C][/ROW]
[ROW][C]21[/C][C] 15[/C][C] 15.8[/C][C]-0.799[/C][/ROW]
[ROW][C]22[/C][C] 16[/C][C] 15.69[/C][C] 0.3111[/C][/ROW]
[ROW][C]23[/C][C] 15[/C][C] 15.73[/C][C]-0.7283[/C][/ROW]
[ROW][C]24[/C][C] 17[/C][C] 15.69[/C][C] 1.311[/C][/ROW]
[ROW][C]25[/C][C] 14[/C][C] 15.07[/C][C]-1.073[/C][/ROW]
[ROW][C]26[/C][C] 16[/C][C] 14.95[/C][C] 1.051[/C][/ROW]
[ROW][C]27[/C][C] 15[/C][C] 15.64[/C][C]-0.6363[/C][/ROW]
[ROW][C]28[/C][C] 16[/C][C] 14.77[/C][C] 1.235[/C][/ROW]
[ROW][C]29[/C][C] 16[/C][C] 16.2[/C][C]-0.1991[/C][/ROW]
[ROW][C]30[/C][C] 13[/C][C] 14.62[/C][C]-1.622[/C][/ROW]
[ROW][C]31[/C][C] 15[/C][C] 17[/C][C]-1.997[/C][/ROW]
[ROW][C]32[/C][C] 17[/C][C] 16.25[/C][C] 0.7483[/C][/ROW]
[ROW][C]33[/C][C] 15[/C][C] 14.79[/C][C] 0.2148[/C][/ROW]
[ROW][C]34[/C][C] 13[/C][C] 13.7[/C][C]-0.6989[/C][/ROW]
[ROW][C]35[/C][C] 17[/C][C] 16.56[/C][C] 0.4418[/C][/ROW]
[ROW][C]36[/C][C] 15[/C][C] 15.17[/C][C]-0.1655[/C][/ROW]
[ROW][C]37[/C][C] 14[/C][C] 14.3[/C][C]-0.2959[/C][/ROW]
[ROW][C]38[/C][C] 14[/C][C] 14.44[/C][C]-0.4384[/C][/ROW]
[ROW][C]39[/C][C] 18[/C][C] 15.73[/C][C] 2.272[/C][/ROW]
[ROW][C]40[/C][C] 15[/C][C] 16.2[/C][C]-1.199[/C][/ROW]
[ROW][C]41[/C][C] 17[/C][C] 17[/C][C] 0.003121[/C][/ROW]
[ROW][C]42[/C][C] 13[/C][C] 13.97[/C][C]-0.9676[/C][/ROW]
[ROW][C]43[/C][C] 16[/C][C] 17.27[/C][C]-1.273[/C][/ROW]
[ROW][C]44[/C][C] 15[/C][C] 16[/C][C]-1.004[/C][/ROW]
[ROW][C]45[/C][C] 15[/C][C] 15.31[/C][C]-0.3097[/C][/ROW]
[ROW][C]46[/C][C] 16[/C][C] 15.64[/C][C] 0.3637[/C][/ROW]
[ROW][C]47[/C][C] 15[/C][C] 15.78[/C][C]-0.782[/C][/ROW]
[ROW][C]48[/C][C] 13[/C][C] 15.84[/C][C]-2.838[/C][/ROW]
[ROW][C]49[/C][C] 17[/C][C] 16.83[/C][C] 0.1658[/C][/ROW]
[ROW][C]50[/C][C] 18[/C][C] 17.32[/C][C] 0.6769[/C][/ROW]
[ROW][C]51[/C][C] 18[/C][C] 17.4[/C][C] 0.603[/C][/ROW]
[ROW][C]52[/C][C] 11[/C][C] 14.79[/C][C]-3.785[/C][/ROW]
[ROW][C]53[/C][C] 14[/C][C] 14.2[/C][C]-0.2039[/C][/ROW]
[ROW][C]54[/C][C] 13[/C][C] 15.73[/C][C]-2.728[/C][/ROW]
[ROW][C]55[/C][C] 15[/C][C] 14.58[/C][C] 0.4158[/C][/ROW]
[ROW][C]56[/C][C] 17[/C][C] 15.11[/C][C] 1.887[/C][/ROW]
[ROW][C]57[/C][C] 16[/C][C] 15.55[/C][C] 0.4487[/C][/ROW]
[ROW][C]58[/C][C] 15[/C][C] 15.84[/C][C]-0.8384[/C][/ROW]
[ROW][C]59[/C][C] 17[/C][C] 17.38[/C][C]-0.3757[/C][/ROW]
[ROW][C]60[/C][C] 16[/C][C] 14.67[/C][C] 1.327[/C][/ROW]
[ROW][C]61[/C][C] 16[/C][C] 15.8[/C][C] 0.201[/C][/ROW]
[ROW][C]62[/C][C] 16[/C][C] 14.67[/C][C] 1.331[/C][/ROW]
[ROW][C]63[/C][C] 15[/C][C] 15.89[/C][C]-0.891[/C][/ROW]
[ROW][C]64[/C][C] 12[/C][C] 13.42[/C][C]-1.425[/C][/ROW]
[ROW][C]65[/C][C] 17[/C][C] 15.59[/C][C] 1.409[/C][/ROW]
[ROW][C]66[/C][C] 14[/C][C] 15.55[/C][C]-1.551[/C][/ROW]
[ROW][C]67[/C][C] 14[/C][C] 15.76[/C][C]-1.762[/C][/ROW]
[ROW][C]68[/C][C] 16[/C][C] 14.95[/C][C] 1.051[/C][/ROW]
[ROW][C]69[/C][C] 15[/C][C] 14.75[/C][C] 0.2531[/C][/ROW]
[ROW][C]70[/C][C] 15[/C][C] 17.32[/C][C]-2.323[/C][/ROW]
[ROW][C]71[/C][C] 14[/C][C] 15.54[/C][C]-1.544[/C][/ROW]
[ROW][C]72[/C][C] 13[/C][C] 15.64[/C][C]-2.636[/C][/ROW]
[ROW][C]73[/C][C] 18[/C][C] 16.13[/C][C] 1.874[/C][/ROW]
[ROW][C]74[/C][C] 15[/C][C] 14.98[/C][C] 0.01853[/C][/ROW]
[ROW][C]75[/C][C] 16[/C][C] 15.84[/C][C] 0.1616[/C][/ROW]
[ROW][C]76[/C][C] 14[/C][C] 15.04[/C][C]-1.041[/C][/ROW]
[ROW][C]77[/C][C] 15[/C][C] 14.02[/C][C] 0.9798[/C][/ROW]
[ROW][C]78[/C][C] 17[/C][C] 14.62[/C][C] 2.378[/C][/ROW]
[ROW][C]79[/C][C] 16[/C][C] 15.69[/C][C] 0.3111[/C][/ROW]
[ROW][C]80[/C][C] 10[/C][C] 13.88[/C][C]-3.876[/C][/ROW]
[ROW][C]81[/C][C] 16[/C][C] 15.84[/C][C] 0.1616[/C][/ROW]
[ROW][C]82[/C][C] 17[/C][C] 15.71[/C][C] 1.293[/C][/ROW]
[ROW][C]83[/C][C] 17[/C][C] 15.8[/C][C] 1.201[/C][/ROW]
[ROW][C]84[/C][C] 20[/C][C] 16.2[/C][C] 3.801[/C][/ROW]
[ROW][C]85[/C][C] 17[/C][C] 16.35[/C][C] 0.6451[/C][/ROW]
[ROW][C]86[/C][C] 18[/C][C] 15.89[/C][C] 2.109[/C][/ROW]
[ROW][C]87[/C][C] 15[/C][C] 15.13[/C][C]-0.126[/C][/ROW]
[ROW][C]88[/C][C] 17[/C][C] 13.97[/C][C] 3.032[/C][/ROW]
[ROW][C]89[/C][C] 14[/C][C] 13.05[/C][C] 0.9546[/C][/ROW]
[ROW][C]90[/C][C] 15[/C][C] 15.77[/C][C]-0.7677[/C][/ROW]
[ROW][C]91[/C][C] 17[/C][C] 15.69[/C][C] 1.311[/C][/ROW]
[ROW][C]92[/C][C] 16[/C][C] 15.84[/C][C] 0.1616[/C][/ROW]
[ROW][C]93[/C][C] 17[/C][C] 16.98[/C][C] 0.01629[/C][/ROW]
[ROW][C]94[/C][C] 15[/C][C] 14.95[/C][C] 0.05097[/C][/ROW]
[ROW][C]95[/C][C] 16[/C][C] 15.69[/C][C] 0.3111[/C][/ROW]
[ROW][C]96[/C][C] 18[/C][C] 16.07[/C][C] 1.932[/C][/ROW]
[ROW][C]97[/C][C] 18[/C][C] 16.54[/C][C] 1.461[/C][/ROW]
[ROW][C]98[/C][C] 16[/C][C] 16.9[/C][C]-0.9049[/C][/ROW]
[ROW][C]99[/C][C] 17[/C][C] 15.26[/C][C] 1.744[/C][/ROW]
[ROW][C]100[/C][C] 15[/C][C] 15.69[/C][C]-0.6889[/C][/ROW]
[ROW][C]101[/C][C] 13[/C][C] 16.16[/C][C]-3.16[/C][/ROW]
[ROW][C]102[/C][C] 15[/C][C] 14.79[/C][C] 0.2137[/C][/ROW]
[ROW][C]103[/C][C] 17[/C][C] 16.65[/C][C] 0.351[/C][/ROW]
[ROW][C]104[/C][C] 16[/C][C] 15.6[/C][C] 0.3961[/C][/ROW]
[ROW][C]105[/C][C] 16[/C][C] 15.3[/C][C] 0.7034[/C][/ROW]
[ROW][C]106[/C][C] 15[/C][C] 15.73[/C][C]-0.7283[/C][/ROW]
[ROW][C]107[/C][C] 16[/C][C] 15.73[/C][C] 0.2717[/C][/ROW]
[ROW][C]108[/C][C] 16[/C][C] 15.41[/C][C] 0.593[/C][/ROW]
[ROW][C]109[/C][C] 14[/C][C] 15.64[/C][C]-1.636[/C][/ROW]
[ROW][C]110[/C][C] 15[/C][C] 15.31[/C][C]-0.3097[/C][/ROW]
[ROW][C]111[/C][C] 12[/C][C] 13.84[/C][C]-1.843[/C][/ROW]
[ROW][C]112[/C][C] 19[/C][C] 15.35[/C][C] 3.651[/C][/ROW]
[ROW][C]113[/C][C] 16[/C][C] 15.17[/C][C] 0.8345[/C][/ROW]
[ROW][C]114[/C][C] 16[/C][C] 15.53[/C][C] 0.4738[/C][/ROW]
[ROW][C]115[/C][C] 17[/C][C] 15.59[/C][C] 1.408[/C][/ROW]
[ROW][C]116[/C][C] 16[/C][C] 16.45[/C][C]-0.4539[/C][/ROW]
[ROW][C]117[/C][C] 14[/C][C] 15.68[/C][C]-1.676[/C][/ROW]
[ROW][C]118[/C][C] 15[/C][C] 15.44[/C][C]-0.4411[/C][/ROW]
[ROW][C]119[/C][C] 14[/C][C] 14.75[/C][C]-0.7469[/C][/ROW]
[ROW][C]120[/C][C] 16[/C][C] 15.64[/C][C] 0.3637[/C][/ROW]
[ROW][C]121[/C][C] 15[/C][C] 15.84[/C][C]-0.8384[/C][/ROW]
[ROW][C]122[/C][C] 17[/C][C] 16.65[/C][C] 0.3498[/C][/ROW]
[ROW][C]123[/C][C] 15[/C][C] 15.07[/C][C]-0.07346[/C][/ROW]
[ROW][C]124[/C][C] 16[/C][C] 15.35[/C][C] 0.6509[/C][/ROW]
[ROW][C]125[/C][C] 16[/C][C] 15.6[/C][C] 0.4031[/C][/ROW]
[ROW][C]126[/C][C] 15[/C][C] 14.69[/C][C] 0.3057[/C][/ROW]
[ROW][C]127[/C][C] 15[/C][C] 15.39[/C][C]-0.3885[/C][/ROW]
[ROW][C]128[/C][C] 11[/C][C] 12.29[/C][C]-1.287[/C][/ROW]
[ROW][C]129[/C][C] 16[/C][C] 15.55[/C][C] 0.4487[/C][/ROW]
[ROW][C]130[/C][C] 18[/C][C] 16.11[/C][C] 1.886[/C][/ROW]
[ROW][C]131[/C][C] 13[/C][C] 13.98[/C][C]-0.9819[/C][/ROW]
[ROW][C]132[/C][C] 11[/C][C] 13.97[/C][C]-2.968[/C][/ROW]
[ROW][C]133[/C][C] 16[/C][C] 15.35[/C][C] 0.6509[/C][/ROW]
[ROW][C]134[/C][C] 18[/C][C] 17.51[/C][C] 0.4929[/C][/ROW]
[ROW][C]135[/C][C] 15[/C][C] 16.83[/C][C]-1.834[/C][/ROW]
[ROW][C]136[/C][C] 19[/C][C] 17.89[/C][C] 1.114[/C][/ROW]
[ROW][C]137[/C][C] 17[/C][C] 17[/C][C] 0.003121[/C][/ROW]
[ROW][C]138[/C][C] 13[/C][C] 15.31[/C][C]-2.31[/C][/ROW]
[ROW][C]139[/C][C] 14[/C][C] 15.37[/C][C]-1.368[/C][/ROW]
[ROW][C]140[/C][C] 16[/C][C] 15.73[/C][C] 0.2717[/C][/ROW]
[ROW][C]141[/C][C] 13[/C][C] 15.45[/C][C]-2.452[/C][/ROW]
[ROW][C]142[/C][C] 17[/C][C] 15.71[/C][C] 1.293[/C][/ROW]
[ROW][C]143[/C][C] 14[/C][C] 15.8[/C][C]-1.799[/C][/ROW]
[ROW][C]144[/C][C] 19[/C][C] 16.21[/C][C] 2.794[/C][/ROW]
[ROW][C]145[/C][C] 14[/C][C] 14.62[/C][C]-0.6224[/C][/ROW]
[ROW][C]146[/C][C] 16[/C][C] 15.73[/C][C] 0.2717[/C][/ROW]
[ROW][C]147[/C][C] 12[/C][C] 13.5[/C][C]-1.496[/C][/ROW]
[ROW][C]148[/C][C] 16[/C][C] 16.87[/C][C]-0.8736[/C][/ROW]
[ROW][C]149[/C][C] 16[/C][C] 15.35[/C][C] 0.6509[/C][/ROW]
[ROW][C]150[/C][C] 15[/C][C] 15.6[/C][C]-0.5969[/C][/ROW]
[ROW][C]151[/C][C] 12[/C][C] 15.04[/C][C]-3.041[/C][/ROW]
[ROW][C]152[/C][C] 15[/C][C] 15.69[/C][C]-0.6889[/C][/ROW]
[ROW][C]153[/C][C] 17[/C][C] 16.49[/C][C] 0.5067[/C][/ROW]
[ROW][C]154[/C][C] 14[/C][C] 15.53[/C][C]-1.526[/C][/ROW]
[ROW][C]155[/C][C] 15[/C][C] 13.5[/C][C] 1.503[/C][/ROW]
[ROW][C]156[/C][C] 18[/C][C] 15.6[/C][C] 2.403[/C][/ROW]
[ROW][C]157[/C][C] 15[/C][C] 14.41[/C][C] 0.594[/C][/ROW]
[ROW][C]158[/C][C] 18[/C][C] 15.68[/C][C] 2.324[/C][/ROW]
[ROW][C]159[/C][C] 15[/C][C] 17.12[/C][C]-2.121[/C][/ROW]
[ROW][C]160[/C][C] 15[/C][C] 16.11[/C][C]-1.107[/C][/ROW]
[ROW][C]161[/C][C] 16[/C][C] 15.91[/C][C] 0.08803[/C][/ROW]
[ROW][C]162[/C][C] 13[/C][C] 13.85[/C][C]-0.8543[/C][/ROW]
[ROW][C]163[/C][C] 16[/C][C] 15.6[/C][C] 0.4031[/C][/ROW]
[ROW][C]164[/C][C] 14[/C][C] 15.84[/C][C]-1.838[/C][/ROW]
[ROW][C]165[/C][C] 16[/C][C] 13.89[/C][C] 2.106[/C][/ROW]
[/TABLE]
Source: https://freestatistics.org/blog/index.php?pk=&T=4

Globally Unique Identifier (entire table): ba.freestatistics.org/blog/index.php?pk=&T=4

As an alternative you can also use a QR Code:  

The GUIDs for individual cells are displayed in the table below:

Multiple Linear Regression - Actuals, Interpolation, and Residuals
Time or IndexActualsInterpolationForecastResidualsPrediction Error
1 13 13.34-0.3396
2 16 15.2 0.7966
3 17 15.93 1.07
4 15 14.69 0.3057
5 16 15.93 0.06957
6 16 15.24 0.7638
7 18 14.58 3.416
8 16 15.17 0.8345
9 17 16.9 0.09512
10 17 17 0.003121
11 17 15.65 1.346
12 15 15.64-0.6433
13 16 15.31 0.6903
14 14 14.02-0.02019
15 16 15.28 0.7154
16 17 15.13 1.874
17 16 15.13 0.874
18 15 17.02-2.018
19 17 15.84 1.162
20 16 14.84 1.161
21 15 15.8-0.799
22 16 15.69 0.3111
23 15 15.73-0.7283
24 17 15.69 1.311
25 14 15.07-1.073
26 16 14.95 1.051
27 15 15.64-0.6363
28 16 14.77 1.235
29 16 16.2-0.1991
30 13 14.62-1.622
31 15 17-1.997
32 17 16.25 0.7483
33 15 14.79 0.2148
34 13 13.7-0.6989
35 17 16.56 0.4418
36 15 15.17-0.1655
37 14 14.3-0.2959
38 14 14.44-0.4384
39 18 15.73 2.272
40 15 16.2-1.199
41 17 17 0.003121
42 13 13.97-0.9676
43 16 17.27-1.273
44 15 16-1.004
45 15 15.31-0.3097
46 16 15.64 0.3637
47 15 15.78-0.782
48 13 15.84-2.838
49 17 16.83 0.1658
50 18 17.32 0.6769
51 18 17.4 0.603
52 11 14.79-3.785
53 14 14.2-0.2039
54 13 15.73-2.728
55 15 14.58 0.4158
56 17 15.11 1.887
57 16 15.55 0.4487
58 15 15.84-0.8384
59 17 17.38-0.3757
60 16 14.67 1.327
61 16 15.8 0.201
62 16 14.67 1.331
63 15 15.89-0.891
64 12 13.42-1.425
65 17 15.59 1.409
66 14 15.55-1.551
67 14 15.76-1.762
68 16 14.95 1.051
69 15 14.75 0.2531
70 15 17.32-2.323
71 14 15.54-1.544
72 13 15.64-2.636
73 18 16.13 1.874
74 15 14.98 0.01853
75 16 15.84 0.1616
76 14 15.04-1.041
77 15 14.02 0.9798
78 17 14.62 2.378
79 16 15.69 0.3111
80 10 13.88-3.876
81 16 15.84 0.1616
82 17 15.71 1.293
83 17 15.8 1.201
84 20 16.2 3.801
85 17 16.35 0.6451
86 18 15.89 2.109
87 15 15.13-0.126
88 17 13.97 3.032
89 14 13.05 0.9546
90 15 15.77-0.7677
91 17 15.69 1.311
92 16 15.84 0.1616
93 17 16.98 0.01629
94 15 14.95 0.05097
95 16 15.69 0.3111
96 18 16.07 1.932
97 18 16.54 1.461
98 16 16.9-0.9049
99 17 15.26 1.744
100 15 15.69-0.6889
101 13 16.16-3.16
102 15 14.79 0.2137
103 17 16.65 0.351
104 16 15.6 0.3961
105 16 15.3 0.7034
106 15 15.73-0.7283
107 16 15.73 0.2717
108 16 15.41 0.593
109 14 15.64-1.636
110 15 15.31-0.3097
111 12 13.84-1.843
112 19 15.35 3.651
113 16 15.17 0.8345
114 16 15.53 0.4738
115 17 15.59 1.408
116 16 16.45-0.4539
117 14 15.68-1.676
118 15 15.44-0.4411
119 14 14.75-0.7469
120 16 15.64 0.3637
121 15 15.84-0.8384
122 17 16.65 0.3498
123 15 15.07-0.07346
124 16 15.35 0.6509
125 16 15.6 0.4031
126 15 14.69 0.3057
127 15 15.39-0.3885
128 11 12.29-1.287
129 16 15.55 0.4487
130 18 16.11 1.886
131 13 13.98-0.9819
132 11 13.97-2.968
133 16 15.35 0.6509
134 18 17.51 0.4929
135 15 16.83-1.834
136 19 17.89 1.114
137 17 17 0.003121
138 13 15.31-2.31
139 14 15.37-1.368
140 16 15.73 0.2717
141 13 15.45-2.452
142 17 15.71 1.293
143 14 15.8-1.799
144 19 16.21 2.794
145 14 14.62-0.6224
146 16 15.73 0.2717
147 12 13.5-1.496
148 16 16.87-0.8736
149 16 15.35 0.6509
150 15 15.6-0.5969
151 12 15.04-3.041
152 15 15.69-0.6889
153 17 16.49 0.5067
154 14 15.53-1.526
155 15 13.5 1.503
156 18 15.6 2.403
157 15 14.41 0.594
158 18 15.68 2.324
159 15 17.12-2.121
160 15 16.11-1.107
161 16 15.91 0.08803
162 13 13.85-0.8543
163 16 15.6 0.4031
164 14 15.84-1.838
165 16 13.89 2.106


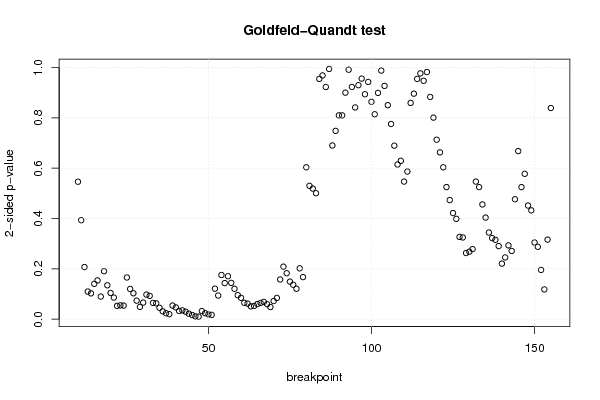
Goldfeld-Quandt test for Heteroskedasticity
p-valuesAlternative Hypothesis
breakpoint indexgreater2-sidedless
10 0.2732 0.5463 0.7268
11 0.1967 0.3934 0.8033
12 0.1037 0.2073 0.8963
13 0.05505 0.1101 0.9449
14 0.05148 0.103 0.9485
15 0.07033 0.1407 0.9297
16 0.07718 0.1544 0.9228
17 0.04505 0.09009 0.955
18 0.09545 0.1909 0.9045
19 0.06746 0.1349 0.9325
20 0.0522 0.1044 0.9478
21 0.04314 0.08627 0.9569
22 0.02661 0.05322 0.9734
23 0.02765 0.05531 0.9723
24 0.02704 0.05407 0.973
25 0.08292 0.1658 0.9171
26 0.06013 0.1203 0.9399
27 0.05158 0.1032 0.9484
28 0.03686 0.07373 0.9631
29 0.02457 0.04914 0.9754
30 0.03317 0.06634 0.9668
31 0.04886 0.09771 0.9511
32 0.04645 0.09291 0.9535
33 0.03251 0.06502 0.9675
34 0.03171 0.06341 0.9683
35 0.02278 0.04556 0.9772
36 0.01574 0.03148 0.9843
37 0.01202 0.02403 0.988
38 0.01012 0.02025 0.9899
39 0.02718 0.05437 0.9728
40 0.02354 0.04708 0.9765
41 0.01644 0.03288 0.9836
42 0.01769 0.03537 0.9823
43 0.01494 0.02988 0.9851
44 0.01104 0.02208 0.989
45 0.00842 0.01684 0.9916
46 0.005789 0.01158 0.9942
47 0.005148 0.0103 0.9949
48 0.01621 0.03243 0.9838
49 0.012 0.02401 0.988
50 0.009623 0.01925 0.9904
51 0.008735 0.01747 0.9913
52 0.06073 0.1215 0.9393
53 0.04713 0.09426 0.9529
54 0.08786 0.1757 0.9121
55 0.0718 0.1436 0.9282
56 0.08544 0.1709 0.9146
57 0.07222 0.1444 0.9278
58 0.06045 0.1209 0.9395
59 0.0478 0.09559 0.9522
60 0.04248 0.08495 0.9575
61 0.03265 0.0653 0.9674
62 0.0311 0.0622 0.9689
63 0.02562 0.05124 0.9744
64 0.02633 0.05267 0.9737
65 0.03012 0.06024 0.9699
66 0.03244 0.06488 0.9676
67 0.03437 0.06873 0.9656
68 0.02987 0.05974 0.9701
69 0.02424 0.04849 0.9758
70 0.03614 0.07229 0.9639
71 0.04234 0.08469 0.9577
72 0.07898 0.158 0.921
73 0.1045 0.2089 0.8955
74 0.09141 0.1828 0.9086
75 0.0747 0.1494 0.9253
76 0.06854 0.1371 0.9315
77 0.06056 0.1211 0.9394
78 0.1012 0.2024 0.8988
79 0.08373 0.1675 0.9163
80 0.3019 0.6037 0.6981
81 0.2651 0.5301 0.7349
82 0.2596 0.5192 0.7404
83 0.2503 0.5007 0.7497
84 0.5226 0.9549 0.4774
85 0.4843 0.9686 0.5157
86 0.5387 0.9226 0.4613
87 0.4972 0.9944 0.5028
88 0.6548 0.6904 0.3452
89 0.6258 0.7485 0.3742
90 0.595 0.8101 0.405
91 0.595 0.8101 0.405
92 0.5499 0.9001 0.4501
93 0.5043 0.9913 0.4957
94 0.4614 0.9229 0.5386
95 0.4207 0.8414 0.5793
96 0.4649 0.9299 0.5351
97 0.478 0.956 0.522
98 0.4469 0.8939 0.5531
99 0.4714 0.9427 0.5286
100 0.4319 0.8639 0.5681
101 0.5928 0.8144 0.4072
102 0.5504 0.8992 0.4496
103 0.506 0.9879 0.494
104 0.4635 0.9269 0.5365
105 0.4252 0.8504 0.5748
106 0.3879 0.7757 0.6121
107 0.3448 0.6896 0.6552
108 0.3074 0.6149 0.6926
109 0.3147 0.6294 0.6853
110 0.2735 0.5469 0.7265
111 0.2934 0.5868 0.7066
112 0.5703 0.8593 0.4297
113 0.5519 0.8962 0.4481
114 0.5226 0.9549 0.4774
115 0.5116 0.9768 0.4884
116 0.4736 0.9473 0.5264
117 0.491 0.982 0.509
118 0.4415 0.8831 0.5585
119 0.4005 0.8009 0.5995
120 0.3566 0.7132 0.6434
121 0.3315 0.6629 0.6685
122 0.3019 0.6037 0.6981
123 0.2625 0.525 0.7375
124 0.2367 0.4734 0.7633
125 0.211 0.4219 0.789
126 0.1995 0.3989 0.8005
127 0.1635 0.3271 0.8365
128 0.1624 0.3248 0.8376
129 0.1315 0.2631 0.8685
130 0.1341 0.2683 0.8659
131 0.1393 0.2786 0.8607
132 0.2735 0.547 0.7265
133 0.2625 0.525 0.7375
134 0.228 0.4561 0.772
135 0.2019 0.4038 0.7981
136 0.1723 0.3445 0.8277
137 0.1613 0.3225 0.8387
138 0.1578 0.3156 0.8422
139 0.1453 0.2907 0.8547
140 0.1105 0.221 0.8895
141 0.1228 0.2456 0.8772
142 0.1468 0.2935 0.8532
143 0.1356 0.2713 0.8644
144 0.2384 0.4767 0.7616
145 0.334 0.6681 0.666
146 0.2624 0.5248 0.7376
147 0.2889 0.5778 0.7111
148 0.2259 0.4517 0.7741
149 0.2163 0.4326 0.7837
150 0.1525 0.3049 0.8475
151 0.1439 0.2878 0.8561
152 0.09794 0.1959 0.9021
153 0.05921 0.1184 0.9408
154 0.1581 0.3163 0.8419
155 0.5804 0.8391 0.4196

\begin{tabular}{lllllllll}
\hline
Goldfeld-Quandt test for Heteroskedasticity \tabularnewline
p-values & Alternative Hypothesis \tabularnewline
breakpoint index & greater & 2-sided & less \tabularnewline
10 &  0.2732 &  0.5463 &  0.7268 \tabularnewline
11 &  0.1967 &  0.3934 &  0.8033 \tabularnewline
12 &  0.1037 &  0.2073 &  0.8963 \tabularnewline
13 &  0.05505 &  0.1101 &  0.9449 \tabularnewline
14 &  0.05148 &  0.103 &  0.9485 \tabularnewline
15 &  0.07033 &  0.1407 &  0.9297 \tabularnewline
16 &  0.07718 &  0.1544 &  0.9228 \tabularnewline
17 &  0.04505 &  0.09009 &  0.955 \tabularnewline
18 &  0.09545 &  0.1909 &  0.9045 \tabularnewline
19 &  0.06746 &  0.1349 &  0.9325 \tabularnewline
20 &  0.0522 &  0.1044 &  0.9478 \tabularnewline
21 &  0.04314 &  0.08627 &  0.9569 \tabularnewline
22 &  0.02661 &  0.05322 &  0.9734 \tabularnewline
23 &  0.02765 &  0.05531 &  0.9723 \tabularnewline
24 &  0.02704 &  0.05407 &  0.973 \tabularnewline
25 &  0.08292 &  0.1658 &  0.9171 \tabularnewline
26 &  0.06013 &  0.1203 &  0.9399 \tabularnewline
27 &  0.05158 &  0.1032 &  0.9484 \tabularnewline
28 &  0.03686 &  0.07373 &  0.9631 \tabularnewline
29 &  0.02457 &  0.04914 &  0.9754 \tabularnewline
30 &  0.03317 &  0.06634 &  0.9668 \tabularnewline
31 &  0.04886 &  0.09771 &  0.9511 \tabularnewline
32 &  0.04645 &  0.09291 &  0.9535 \tabularnewline
33 &  0.03251 &  0.06502 &  0.9675 \tabularnewline
34 &  0.03171 &  0.06341 &  0.9683 \tabularnewline
35 &  0.02278 &  0.04556 &  0.9772 \tabularnewline
36 &  0.01574 &  0.03148 &  0.9843 \tabularnewline
37 &  0.01202 &  0.02403 &  0.988 \tabularnewline
38 &  0.01012 &  0.02025 &  0.9899 \tabularnewline
39 &  0.02718 &  0.05437 &  0.9728 \tabularnewline
40 &  0.02354 &  0.04708 &  0.9765 \tabularnewline
41 &  0.01644 &  0.03288 &  0.9836 \tabularnewline
42 &  0.01769 &  0.03537 &  0.9823 \tabularnewline
43 &  0.01494 &  0.02988 &  0.9851 \tabularnewline
44 &  0.01104 &  0.02208 &  0.989 \tabularnewline
45 &  0.00842 &  0.01684 &  0.9916 \tabularnewline
46 &  0.005789 &  0.01158 &  0.9942 \tabularnewline
47 &  0.005148 &  0.0103 &  0.9949 \tabularnewline
48 &  0.01621 &  0.03243 &  0.9838 \tabularnewline
49 &  0.012 &  0.02401 &  0.988 \tabularnewline
50 &  0.009623 &  0.01925 &  0.9904 \tabularnewline
51 &  0.008735 &  0.01747 &  0.9913 \tabularnewline
52 &  0.06073 &  0.1215 &  0.9393 \tabularnewline
53 &  0.04713 &  0.09426 &  0.9529 \tabularnewline
54 &  0.08786 &  0.1757 &  0.9121 \tabularnewline
55 &  0.0718 &  0.1436 &  0.9282 \tabularnewline
56 &  0.08544 &  0.1709 &  0.9146 \tabularnewline
57 &  0.07222 &  0.1444 &  0.9278 \tabularnewline
58 &  0.06045 &  0.1209 &  0.9395 \tabularnewline
59 &  0.0478 &  0.09559 &  0.9522 \tabularnewline
60 &  0.04248 &  0.08495 &  0.9575 \tabularnewline
61 &  0.03265 &  0.0653 &  0.9674 \tabularnewline
62 &  0.0311 &  0.0622 &  0.9689 \tabularnewline
63 &  0.02562 &  0.05124 &  0.9744 \tabularnewline
64 &  0.02633 &  0.05267 &  0.9737 \tabularnewline
65 &  0.03012 &  0.06024 &  0.9699 \tabularnewline
66 &  0.03244 &  0.06488 &  0.9676 \tabularnewline
67 &  0.03437 &  0.06873 &  0.9656 \tabularnewline
68 &  0.02987 &  0.05974 &  0.9701 \tabularnewline
69 &  0.02424 &  0.04849 &  0.9758 \tabularnewline
70 &  0.03614 &  0.07229 &  0.9639 \tabularnewline
71 &  0.04234 &  0.08469 &  0.9577 \tabularnewline
72 &  0.07898 &  0.158 &  0.921 \tabularnewline
73 &  0.1045 &  0.2089 &  0.8955 \tabularnewline
74 &  0.09141 &  0.1828 &  0.9086 \tabularnewline
75 &  0.0747 &  0.1494 &  0.9253 \tabularnewline
76 &  0.06854 &  0.1371 &  0.9315 \tabularnewline
77 &  0.06056 &  0.1211 &  0.9394 \tabularnewline
78 &  0.1012 &  0.2024 &  0.8988 \tabularnewline
79 &  0.08373 &  0.1675 &  0.9163 \tabularnewline
80 &  0.3019 &  0.6037 &  0.6981 \tabularnewline
81 &  0.2651 &  0.5301 &  0.7349 \tabularnewline
82 &  0.2596 &  0.5192 &  0.7404 \tabularnewline
83 &  0.2503 &  0.5007 &  0.7497 \tabularnewline
84 &  0.5226 &  0.9549 &  0.4774 \tabularnewline
85 &  0.4843 &  0.9686 &  0.5157 \tabularnewline
86 &  0.5387 &  0.9226 &  0.4613 \tabularnewline
87 &  0.4972 &  0.9944 &  0.5028 \tabularnewline
88 &  0.6548 &  0.6904 &  0.3452 \tabularnewline
89 &  0.6258 &  0.7485 &  0.3742 \tabularnewline
90 &  0.595 &  0.8101 &  0.405 \tabularnewline
91 &  0.595 &  0.8101 &  0.405 \tabularnewline
92 &  0.5499 &  0.9001 &  0.4501 \tabularnewline
93 &  0.5043 &  0.9913 &  0.4957 \tabularnewline
94 &  0.4614 &  0.9229 &  0.5386 \tabularnewline
95 &  0.4207 &  0.8414 &  0.5793 \tabularnewline
96 &  0.4649 &  0.9299 &  0.5351 \tabularnewline
97 &  0.478 &  0.956 &  0.522 \tabularnewline
98 &  0.4469 &  0.8939 &  0.5531 \tabularnewline
99 &  0.4714 &  0.9427 &  0.5286 \tabularnewline
100 &  0.4319 &  0.8639 &  0.5681 \tabularnewline
101 &  0.5928 &  0.8144 &  0.4072 \tabularnewline
102 &  0.5504 &  0.8992 &  0.4496 \tabularnewline
103 &  0.506 &  0.9879 &  0.494 \tabularnewline
104 &  0.4635 &  0.9269 &  0.5365 \tabularnewline
105 &  0.4252 &  0.8504 &  0.5748 \tabularnewline
106 &  0.3879 &  0.7757 &  0.6121 \tabularnewline
107 &  0.3448 &  0.6896 &  0.6552 \tabularnewline
108 &  0.3074 &  0.6149 &  0.6926 \tabularnewline
109 &  0.3147 &  0.6294 &  0.6853 \tabularnewline
110 &  0.2735 &  0.5469 &  0.7265 \tabularnewline
111 &  0.2934 &  0.5868 &  0.7066 \tabularnewline
112 &  0.5703 &  0.8593 &  0.4297 \tabularnewline
113 &  0.5519 &  0.8962 &  0.4481 \tabularnewline
114 &  0.5226 &  0.9549 &  0.4774 \tabularnewline
115 &  0.5116 &  0.9768 &  0.4884 \tabularnewline
116 &  0.4736 &  0.9473 &  0.5264 \tabularnewline
117 &  0.491 &  0.982 &  0.509 \tabularnewline
118 &  0.4415 &  0.8831 &  0.5585 \tabularnewline
119 &  0.4005 &  0.8009 &  0.5995 \tabularnewline
120 &  0.3566 &  0.7132 &  0.6434 \tabularnewline
121 &  0.3315 &  0.6629 &  0.6685 \tabularnewline
122 &  0.3019 &  0.6037 &  0.6981 \tabularnewline
123 &  0.2625 &  0.525 &  0.7375 \tabularnewline
124 &  0.2367 &  0.4734 &  0.7633 \tabularnewline
125 &  0.211 &  0.4219 &  0.789 \tabularnewline
126 &  0.1995 &  0.3989 &  0.8005 \tabularnewline
127 &  0.1635 &  0.3271 &  0.8365 \tabularnewline
128 &  0.1624 &  0.3248 &  0.8376 \tabularnewline
129 &  0.1315 &  0.2631 &  0.8685 \tabularnewline
130 &  0.1341 &  0.2683 &  0.8659 \tabularnewline
131 &  0.1393 &  0.2786 &  0.8607 \tabularnewline
132 &  0.2735 &  0.547 &  0.7265 \tabularnewline
133 &  0.2625 &  0.525 &  0.7375 \tabularnewline
134 &  0.228 &  0.4561 &  0.772 \tabularnewline
135 &  0.2019 &  0.4038 &  0.7981 \tabularnewline
136 &  0.1723 &  0.3445 &  0.8277 \tabularnewline
137 &  0.1613 &  0.3225 &  0.8387 \tabularnewline
138 &  0.1578 &  0.3156 &  0.8422 \tabularnewline
139 &  0.1453 &  0.2907 &  0.8547 \tabularnewline
140 &  0.1105 &  0.221 &  0.8895 \tabularnewline
141 &  0.1228 &  0.2456 &  0.8772 \tabularnewline
142 &  0.1468 &  0.2935 &  0.8532 \tabularnewline
143 &  0.1356 &  0.2713 &  0.8644 \tabularnewline
144 &  0.2384 &  0.4767 &  0.7616 \tabularnewline
145 &  0.334 &  0.6681 &  0.666 \tabularnewline
146 &  0.2624 &  0.5248 &  0.7376 \tabularnewline
147 &  0.2889 &  0.5778 &  0.7111 \tabularnewline
148 &  0.2259 &  0.4517 &  0.7741 \tabularnewline
149 &  0.2163 &  0.4326 &  0.7837 \tabularnewline
150 &  0.1525 &  0.3049 &  0.8475 \tabularnewline
151 &  0.1439 &  0.2878 &  0.8561 \tabularnewline
152 &  0.09794 &  0.1959 &  0.9021 \tabularnewline
153 &  0.05921 &  0.1184 &  0.9408 \tabularnewline
154 &  0.1581 &  0.3163 &  0.8419 \tabularnewline
155 &  0.5804 &  0.8391 &  0.4196 \tabularnewline
\hline
\end{tabular}
%Source: https://freestatistics.org/blog/index.php?pk=&T=5

[TABLE]
[ROW][C]Goldfeld-Quandt test for Heteroskedasticity[/C][/ROW]
[ROW][C]p-values[/C][C]Alternative Hypothesis[/C][/ROW]
[ROW][C]breakpoint index[/C][C]greater[/C][C]2-sided[/C][C]less[/C][/ROW]
[ROW][C]10[/C][C] 0.2732[/C][C] 0.5463[/C][C] 0.7268[/C][/ROW]
[ROW][C]11[/C][C] 0.1967[/C][C] 0.3934[/C][C] 0.8033[/C][/ROW]
[ROW][C]12[/C][C] 0.1037[/C][C] 0.2073[/C][C] 0.8963[/C][/ROW]
[ROW][C]13[/C][C] 0.05505[/C][C] 0.1101[/C][C] 0.9449[/C][/ROW]
[ROW][C]14[/C][C] 0.05148[/C][C] 0.103[/C][C] 0.9485[/C][/ROW]
[ROW][C]15[/C][C] 0.07033[/C][C] 0.1407[/C][C] 0.9297[/C][/ROW]
[ROW][C]16[/C][C] 0.07718[/C][C] 0.1544[/C][C] 0.9228[/C][/ROW]
[ROW][C]17[/C][C] 0.04505[/C][C] 0.09009[/C][C] 0.955[/C][/ROW]
[ROW][C]18[/C][C] 0.09545[/C][C] 0.1909[/C][C] 0.9045[/C][/ROW]
[ROW][C]19[/C][C] 0.06746[/C][C] 0.1349[/C][C] 0.9325[/C][/ROW]
[ROW][C]20[/C][C] 0.0522[/C][C] 0.1044[/C][C] 0.9478[/C][/ROW]
[ROW][C]21[/C][C] 0.04314[/C][C] 0.08627[/C][C] 0.9569[/C][/ROW]
[ROW][C]22[/C][C] 0.02661[/C][C] 0.05322[/C][C] 0.9734[/C][/ROW]
[ROW][C]23[/C][C] 0.02765[/C][C] 0.05531[/C][C] 0.9723[/C][/ROW]
[ROW][C]24[/C][C] 0.02704[/C][C] 0.05407[/C][C] 0.973[/C][/ROW]
[ROW][C]25[/C][C] 0.08292[/C][C] 0.1658[/C][C] 0.9171[/C][/ROW]
[ROW][C]26[/C][C] 0.06013[/C][C] 0.1203[/C][C] 0.9399[/C][/ROW]
[ROW][C]27[/C][C] 0.05158[/C][C] 0.1032[/C][C] 0.9484[/C][/ROW]
[ROW][C]28[/C][C] 0.03686[/C][C] 0.07373[/C][C] 0.9631[/C][/ROW]
[ROW][C]29[/C][C] 0.02457[/C][C] 0.04914[/C][C] 0.9754[/C][/ROW]
[ROW][C]30[/C][C] 0.03317[/C][C] 0.06634[/C][C] 0.9668[/C][/ROW]
[ROW][C]31[/C][C] 0.04886[/C][C] 0.09771[/C][C] 0.9511[/C][/ROW]
[ROW][C]32[/C][C] 0.04645[/C][C] 0.09291[/C][C] 0.9535[/C][/ROW]
[ROW][C]33[/C][C] 0.03251[/C][C] 0.06502[/C][C] 0.9675[/C][/ROW]
[ROW][C]34[/C][C] 0.03171[/C][C] 0.06341[/C][C] 0.9683[/C][/ROW]
[ROW][C]35[/C][C] 0.02278[/C][C] 0.04556[/C][C] 0.9772[/C][/ROW]
[ROW][C]36[/C][C] 0.01574[/C][C] 0.03148[/C][C] 0.9843[/C][/ROW]
[ROW][C]37[/C][C] 0.01202[/C][C] 0.02403[/C][C] 0.988[/C][/ROW]
[ROW][C]38[/C][C] 0.01012[/C][C] 0.02025[/C][C] 0.9899[/C][/ROW]
[ROW][C]39[/C][C] 0.02718[/C][C] 0.05437[/C][C] 0.9728[/C][/ROW]
[ROW][C]40[/C][C] 0.02354[/C][C] 0.04708[/C][C] 0.9765[/C][/ROW]
[ROW][C]41[/C][C] 0.01644[/C][C] 0.03288[/C][C] 0.9836[/C][/ROW]
[ROW][C]42[/C][C] 0.01769[/C][C] 0.03537[/C][C] 0.9823[/C][/ROW]
[ROW][C]43[/C][C] 0.01494[/C][C] 0.02988[/C][C] 0.9851[/C][/ROW]
[ROW][C]44[/C][C] 0.01104[/C][C] 0.02208[/C][C] 0.989[/C][/ROW]
[ROW][C]45[/C][C] 0.00842[/C][C] 0.01684[/C][C] 0.9916[/C][/ROW]
[ROW][C]46[/C][C] 0.005789[/C][C] 0.01158[/C][C] 0.9942[/C][/ROW]
[ROW][C]47[/C][C] 0.005148[/C][C] 0.0103[/C][C] 0.9949[/C][/ROW]
[ROW][C]48[/C][C] 0.01621[/C][C] 0.03243[/C][C] 0.9838[/C][/ROW]
[ROW][C]49[/C][C] 0.012[/C][C] 0.02401[/C][C] 0.988[/C][/ROW]
[ROW][C]50[/C][C] 0.009623[/C][C] 0.01925[/C][C] 0.9904[/C][/ROW]
[ROW][C]51[/C][C] 0.008735[/C][C] 0.01747[/C][C] 0.9913[/C][/ROW]
[ROW][C]52[/C][C] 0.06073[/C][C] 0.1215[/C][C] 0.9393[/C][/ROW]
[ROW][C]53[/C][C] 0.04713[/C][C] 0.09426[/C][C] 0.9529[/C][/ROW]
[ROW][C]54[/C][C] 0.08786[/C][C] 0.1757[/C][C] 0.9121[/C][/ROW]
[ROW][C]55[/C][C] 0.0718[/C][C] 0.1436[/C][C] 0.9282[/C][/ROW]
[ROW][C]56[/C][C] 0.08544[/C][C] 0.1709[/C][C] 0.9146[/C][/ROW]
[ROW][C]57[/C][C] 0.07222[/C][C] 0.1444[/C][C] 0.9278[/C][/ROW]
[ROW][C]58[/C][C] 0.06045[/C][C] 0.1209[/C][C] 0.9395[/C][/ROW]
[ROW][C]59[/C][C] 0.0478[/C][C] 0.09559[/C][C] 0.9522[/C][/ROW]
[ROW][C]60[/C][C] 0.04248[/C][C] 0.08495[/C][C] 0.9575[/C][/ROW]
[ROW][C]61[/C][C] 0.03265[/C][C] 0.0653[/C][C] 0.9674[/C][/ROW]
[ROW][C]62[/C][C] 0.0311[/C][C] 0.0622[/C][C] 0.9689[/C][/ROW]
[ROW][C]63[/C][C] 0.02562[/C][C] 0.05124[/C][C] 0.9744[/C][/ROW]
[ROW][C]64[/C][C] 0.02633[/C][C] 0.05267[/C][C] 0.9737[/C][/ROW]
[ROW][C]65[/C][C] 0.03012[/C][C] 0.06024[/C][C] 0.9699[/C][/ROW]
[ROW][C]66[/C][C] 0.03244[/C][C] 0.06488[/C][C] 0.9676[/C][/ROW]
[ROW][C]67[/C][C] 0.03437[/C][C] 0.06873[/C][C] 0.9656[/C][/ROW]
[ROW][C]68[/C][C] 0.02987[/C][C] 0.05974[/C][C] 0.9701[/C][/ROW]
[ROW][C]69[/C][C] 0.02424[/C][C] 0.04849[/C][C] 0.9758[/C][/ROW]
[ROW][C]70[/C][C] 0.03614[/C][C] 0.07229[/C][C] 0.9639[/C][/ROW]
[ROW][C]71[/C][C] 0.04234[/C][C] 0.08469[/C][C] 0.9577[/C][/ROW]
[ROW][C]72[/C][C] 0.07898[/C][C] 0.158[/C][C] 0.921[/C][/ROW]
[ROW][C]73[/C][C] 0.1045[/C][C] 0.2089[/C][C] 0.8955[/C][/ROW]
[ROW][C]74[/C][C] 0.09141[/C][C] 0.1828[/C][C] 0.9086[/C][/ROW]
[ROW][C]75[/C][C] 0.0747[/C][C] 0.1494[/C][C] 0.9253[/C][/ROW]
[ROW][C]76[/C][C] 0.06854[/C][C] 0.1371[/C][C] 0.9315[/C][/ROW]
[ROW][C]77[/C][C] 0.06056[/C][C] 0.1211[/C][C] 0.9394[/C][/ROW]
[ROW][C]78[/C][C] 0.1012[/C][C] 0.2024[/C][C] 0.8988[/C][/ROW]
[ROW][C]79[/C][C] 0.08373[/C][C] 0.1675[/C][C] 0.9163[/C][/ROW]
[ROW][C]80[/C][C] 0.3019[/C][C] 0.6037[/C][C] 0.6981[/C][/ROW]
[ROW][C]81[/C][C] 0.2651[/C][C] 0.5301[/C][C] 0.7349[/C][/ROW]
[ROW][C]82[/C][C] 0.2596[/C][C] 0.5192[/C][C] 0.7404[/C][/ROW]
[ROW][C]83[/C][C] 0.2503[/C][C] 0.5007[/C][C] 0.7497[/C][/ROW]
[ROW][C]84[/C][C] 0.5226[/C][C] 0.9549[/C][C] 0.4774[/C][/ROW]
[ROW][C]85[/C][C] 0.4843[/C][C] 0.9686[/C][C] 0.5157[/C][/ROW]
[ROW][C]86[/C][C] 0.5387[/C][C] 0.9226[/C][C] 0.4613[/C][/ROW]
[ROW][C]87[/C][C] 0.4972[/C][C] 0.9944[/C][C] 0.5028[/C][/ROW]
[ROW][C]88[/C][C] 0.6548[/C][C] 0.6904[/C][C] 0.3452[/C][/ROW]
[ROW][C]89[/C][C] 0.6258[/C][C] 0.7485[/C][C] 0.3742[/C][/ROW]
[ROW][C]90[/C][C] 0.595[/C][C] 0.8101[/C][C] 0.405[/C][/ROW]
[ROW][C]91[/C][C] 0.595[/C][C] 0.8101[/C][C] 0.405[/C][/ROW]
[ROW][C]92[/C][C] 0.5499[/C][C] 0.9001[/C][C] 0.4501[/C][/ROW]
[ROW][C]93[/C][C] 0.5043[/C][C] 0.9913[/C][C] 0.4957[/C][/ROW]
[ROW][C]94[/C][C] 0.4614[/C][C] 0.9229[/C][C] 0.5386[/C][/ROW]
[ROW][C]95[/C][C] 0.4207[/C][C] 0.8414[/C][C] 0.5793[/C][/ROW]
[ROW][C]96[/C][C] 0.4649[/C][C] 0.9299[/C][C] 0.5351[/C][/ROW]
[ROW][C]97[/C][C] 0.478[/C][C] 0.956[/C][C] 0.522[/C][/ROW]
[ROW][C]98[/C][C] 0.4469[/C][C] 0.8939[/C][C] 0.5531[/C][/ROW]
[ROW][C]99[/C][C] 0.4714[/C][C] 0.9427[/C][C] 0.5286[/C][/ROW]
[ROW][C]100[/C][C] 0.4319[/C][C] 0.8639[/C][C] 0.5681[/C][/ROW]
[ROW][C]101[/C][C] 0.5928[/C][C] 0.8144[/C][C] 0.4072[/C][/ROW]
[ROW][C]102[/C][C] 0.5504[/C][C] 0.8992[/C][C] 0.4496[/C][/ROW]
[ROW][C]103[/C][C] 0.506[/C][C] 0.9879[/C][C] 0.494[/C][/ROW]
[ROW][C]104[/C][C] 0.4635[/C][C] 0.9269[/C][C] 0.5365[/C][/ROW]
[ROW][C]105[/C][C] 0.4252[/C][C] 0.8504[/C][C] 0.5748[/C][/ROW]
[ROW][C]106[/C][C] 0.3879[/C][C] 0.7757[/C][C] 0.6121[/C][/ROW]
[ROW][C]107[/C][C] 0.3448[/C][C] 0.6896[/C][C] 0.6552[/C][/ROW]
[ROW][C]108[/C][C] 0.3074[/C][C] 0.6149[/C][C] 0.6926[/C][/ROW]
[ROW][C]109[/C][C] 0.3147[/C][C] 0.6294[/C][C] 0.6853[/C][/ROW]
[ROW][C]110[/C][C] 0.2735[/C][C] 0.5469[/C][C] 0.7265[/C][/ROW]
[ROW][C]111[/C][C] 0.2934[/C][C] 0.5868[/C][C] 0.7066[/C][/ROW]
[ROW][C]112[/C][C] 0.5703[/C][C] 0.8593[/C][C] 0.4297[/C][/ROW]
[ROW][C]113[/C][C] 0.5519[/C][C] 0.8962[/C][C] 0.4481[/C][/ROW]
[ROW][C]114[/C][C] 0.5226[/C][C] 0.9549[/C][C] 0.4774[/C][/ROW]
[ROW][C]115[/C][C] 0.5116[/C][C] 0.9768[/C][C] 0.4884[/C][/ROW]
[ROW][C]116[/C][C] 0.4736[/C][C] 0.9473[/C][C] 0.5264[/C][/ROW]
[ROW][C]117[/C][C] 0.491[/C][C] 0.982[/C][C] 0.509[/C][/ROW]
[ROW][C]118[/C][C] 0.4415[/C][C] 0.8831[/C][C] 0.5585[/C][/ROW]
[ROW][C]119[/C][C] 0.4005[/C][C] 0.8009[/C][C] 0.5995[/C][/ROW]
[ROW][C]120[/C][C] 0.3566[/C][C] 0.7132[/C][C] 0.6434[/C][/ROW]
[ROW][C]121[/C][C] 0.3315[/C][C] 0.6629[/C][C] 0.6685[/C][/ROW]
[ROW][C]122[/C][C] 0.3019[/C][C] 0.6037[/C][C] 0.6981[/C][/ROW]
[ROW][C]123[/C][C] 0.2625[/C][C] 0.525[/C][C] 0.7375[/C][/ROW]
[ROW][C]124[/C][C] 0.2367[/C][C] 0.4734[/C][C] 0.7633[/C][/ROW]
[ROW][C]125[/C][C] 0.211[/C][C] 0.4219[/C][C] 0.789[/C][/ROW]
[ROW][C]126[/C][C] 0.1995[/C][C] 0.3989[/C][C] 0.8005[/C][/ROW]
[ROW][C]127[/C][C] 0.1635[/C][C] 0.3271[/C][C] 0.8365[/C][/ROW]
[ROW][C]128[/C][C] 0.1624[/C][C] 0.3248[/C][C] 0.8376[/C][/ROW]
[ROW][C]129[/C][C] 0.1315[/C][C] 0.2631[/C][C] 0.8685[/C][/ROW]
[ROW][C]130[/C][C] 0.1341[/C][C] 0.2683[/C][C] 0.8659[/C][/ROW]
[ROW][C]131[/C][C] 0.1393[/C][C] 0.2786[/C][C] 0.8607[/C][/ROW]
[ROW][C]132[/C][C] 0.2735[/C][C] 0.547[/C][C] 0.7265[/C][/ROW]
[ROW][C]133[/C][C] 0.2625[/C][C] 0.525[/C][C] 0.7375[/C][/ROW]
[ROW][C]134[/C][C] 0.228[/C][C] 0.4561[/C][C] 0.772[/C][/ROW]
[ROW][C]135[/C][C] 0.2019[/C][C] 0.4038[/C][C] 0.7981[/C][/ROW]
[ROW][C]136[/C][C] 0.1723[/C][C] 0.3445[/C][C] 0.8277[/C][/ROW]
[ROW][C]137[/C][C] 0.1613[/C][C] 0.3225[/C][C] 0.8387[/C][/ROW]
[ROW][C]138[/C][C] 0.1578[/C][C] 0.3156[/C][C] 0.8422[/C][/ROW]
[ROW][C]139[/C][C] 0.1453[/C][C] 0.2907[/C][C] 0.8547[/C][/ROW]
[ROW][C]140[/C][C] 0.1105[/C][C] 0.221[/C][C] 0.8895[/C][/ROW]
[ROW][C]141[/C][C] 0.1228[/C][C] 0.2456[/C][C] 0.8772[/C][/ROW]
[ROW][C]142[/C][C] 0.1468[/C][C] 0.2935[/C][C] 0.8532[/C][/ROW]
[ROW][C]143[/C][C] 0.1356[/C][C] 0.2713[/C][C] 0.8644[/C][/ROW]
[ROW][C]144[/C][C] 0.2384[/C][C] 0.4767[/C][C] 0.7616[/C][/ROW]
[ROW][C]145[/C][C] 0.334[/C][C] 0.6681[/C][C] 0.666[/C][/ROW]
[ROW][C]146[/C][C] 0.2624[/C][C] 0.5248[/C][C] 0.7376[/C][/ROW]
[ROW][C]147[/C][C] 0.2889[/C][C] 0.5778[/C][C] 0.7111[/C][/ROW]
[ROW][C]148[/C][C] 0.2259[/C][C] 0.4517[/C][C] 0.7741[/C][/ROW]
[ROW][C]149[/C][C] 0.2163[/C][C] 0.4326[/C][C] 0.7837[/C][/ROW]
[ROW][C]150[/C][C] 0.1525[/C][C] 0.3049[/C][C] 0.8475[/C][/ROW]
[ROW][C]151[/C][C] 0.1439[/C][C] 0.2878[/C][C] 0.8561[/C][/ROW]
[ROW][C]152[/C][C] 0.09794[/C][C] 0.1959[/C][C] 0.9021[/C][/ROW]
[ROW][C]153[/C][C] 0.05921[/C][C] 0.1184[/C][C] 0.9408[/C][/ROW]
[ROW][C]154[/C][C] 0.1581[/C][C] 0.3163[/C][C] 0.8419[/C][/ROW]
[ROW][C]155[/C][C] 0.5804[/C][C] 0.8391[/C][C] 0.4196[/C][/ROW]
[/TABLE]
Source: https://freestatistics.org/blog/index.php?pk=&T=5

Globally Unique Identifier (entire table): ba.freestatistics.org/blog/index.php?pk=&T=5

As an alternative you can also use a QR Code:  

The GUIDs for individual cells are displayed in the table below:

Goldfeld-Quandt test for Heteroskedasticity
p-valuesAlternative Hypothesis
breakpoint indexgreater2-sidedless
10 0.2732 0.5463 0.7268
11 0.1967 0.3934 0.8033
12 0.1037 0.2073 0.8963
13 0.05505 0.1101 0.9449
14 0.05148 0.103 0.9485
15 0.07033 0.1407 0.9297
16 0.07718 0.1544 0.9228
17 0.04505 0.09009 0.955
18 0.09545 0.1909 0.9045
19 0.06746 0.1349 0.9325
20 0.0522 0.1044 0.9478
21 0.04314 0.08627 0.9569
22 0.02661 0.05322 0.9734
23 0.02765 0.05531 0.9723
24 0.02704 0.05407 0.973
25 0.08292 0.1658 0.9171
26 0.06013 0.1203 0.9399
27 0.05158 0.1032 0.9484
28 0.03686 0.07373 0.9631
29 0.02457 0.04914 0.9754
30 0.03317 0.06634 0.9668
31 0.04886 0.09771 0.9511
32 0.04645 0.09291 0.9535
33 0.03251 0.06502 0.9675
34 0.03171 0.06341 0.9683
35 0.02278 0.04556 0.9772
36 0.01574 0.03148 0.9843
37 0.01202 0.02403 0.988
38 0.01012 0.02025 0.9899
39 0.02718 0.05437 0.9728
40 0.02354 0.04708 0.9765
41 0.01644 0.03288 0.9836
42 0.01769 0.03537 0.9823
43 0.01494 0.02988 0.9851
44 0.01104 0.02208 0.989
45 0.00842 0.01684 0.9916
46 0.005789 0.01158 0.9942
47 0.005148 0.0103 0.9949
48 0.01621 0.03243 0.9838
49 0.012 0.02401 0.988
50 0.009623 0.01925 0.9904
51 0.008735 0.01747 0.9913
52 0.06073 0.1215 0.9393
53 0.04713 0.09426 0.9529
54 0.08786 0.1757 0.9121
55 0.0718 0.1436 0.9282
56 0.08544 0.1709 0.9146
57 0.07222 0.1444 0.9278
58 0.06045 0.1209 0.9395
59 0.0478 0.09559 0.9522
60 0.04248 0.08495 0.9575
61 0.03265 0.0653 0.9674
62 0.0311 0.0622 0.9689
63 0.02562 0.05124 0.9744
64 0.02633 0.05267 0.9737
65 0.03012 0.06024 0.9699
66 0.03244 0.06488 0.9676
67 0.03437 0.06873 0.9656
68 0.02987 0.05974 0.9701
69 0.02424 0.04849 0.9758
70 0.03614 0.07229 0.9639
71 0.04234 0.08469 0.9577
72 0.07898 0.158 0.921
73 0.1045 0.2089 0.8955
74 0.09141 0.1828 0.9086
75 0.0747 0.1494 0.9253
76 0.06854 0.1371 0.9315
77 0.06056 0.1211 0.9394
78 0.1012 0.2024 0.8988
79 0.08373 0.1675 0.9163
80 0.3019 0.6037 0.6981
81 0.2651 0.5301 0.7349
82 0.2596 0.5192 0.7404
83 0.2503 0.5007 0.7497
84 0.5226 0.9549 0.4774
85 0.4843 0.9686 0.5157
86 0.5387 0.9226 0.4613
87 0.4972 0.9944 0.5028
88 0.6548 0.6904 0.3452
89 0.6258 0.7485 0.3742
90 0.595 0.8101 0.405
91 0.595 0.8101 0.405
92 0.5499 0.9001 0.4501
93 0.5043 0.9913 0.4957
94 0.4614 0.9229 0.5386
95 0.4207 0.8414 0.5793
96 0.4649 0.9299 0.5351
97 0.478 0.956 0.522
98 0.4469 0.8939 0.5531
99 0.4714 0.9427 0.5286
100 0.4319 0.8639 0.5681
101 0.5928 0.8144 0.4072
102 0.5504 0.8992 0.4496
103 0.506 0.9879 0.494
104 0.4635 0.9269 0.5365
105 0.4252 0.8504 0.5748
106 0.3879 0.7757 0.6121
107 0.3448 0.6896 0.6552
108 0.3074 0.6149 0.6926
109 0.3147 0.6294 0.6853
110 0.2735 0.5469 0.7265
111 0.2934 0.5868 0.7066
112 0.5703 0.8593 0.4297
113 0.5519 0.8962 0.4481
114 0.5226 0.9549 0.4774
115 0.5116 0.9768 0.4884
116 0.4736 0.9473 0.5264
117 0.491 0.982 0.509
118 0.4415 0.8831 0.5585
119 0.4005 0.8009 0.5995
120 0.3566 0.7132 0.6434
121 0.3315 0.6629 0.6685
122 0.3019 0.6037 0.6981
123 0.2625 0.525 0.7375
124 0.2367 0.4734 0.7633
125 0.211 0.4219 0.789
126 0.1995 0.3989 0.8005
127 0.1635 0.3271 0.8365
128 0.1624 0.3248 0.8376
129 0.1315 0.2631 0.8685
130 0.1341 0.2683 0.8659
131 0.1393 0.2786 0.8607
132 0.2735 0.547 0.7265
133 0.2625 0.525 0.7375
134 0.228 0.4561 0.772
135 0.2019 0.4038 0.7981
136 0.1723 0.3445 0.8277
137 0.1613 0.3225 0.8387
138 0.1578 0.3156 0.8422
139 0.1453 0.2907 0.8547
140 0.1105 0.221 0.8895
141 0.1228 0.2456 0.8772
142 0.1468 0.2935 0.8532
143 0.1356 0.2713 0.8644
144 0.2384 0.4767 0.7616
145 0.334 0.6681 0.666
146 0.2624 0.5248 0.7376
147 0.2889 0.5778 0.7111
148 0.2259 0.4517 0.7741
149 0.2163 0.4326 0.7837
150 0.1525 0.3049 0.8475
151 0.1439 0.2878 0.8561
152 0.09794 0.1959 0.9021
153 0.05921 0.1184 0.9408
154 0.1581 0.3163 0.8419
155 0.5804 0.8391 0.4196


Meta Analysis of Goldfeld-Quandt test for Heteroskedasticity
Description# significant tests% significant testsOK/NOK
1% type I error level0 0OK
5% type I error level180.123288NOK
10% type I error level430.294521NOK

\begin{tabular}{lllllllll}
\hline
Meta Analysis of Goldfeld-Quandt test for Heteroskedasticity \tabularnewline
Description & # significant tests & % significant tests & OK/NOK \tabularnewline
1% type I error level & 0 &  0 & OK \tabularnewline
5% type I error level & 18 & 0.123288 & NOK \tabularnewline
10% type I error level & 43 & 0.294521 & NOK \tabularnewline
\hline
\end{tabular}
%Source: https://freestatistics.org/blog/index.php?pk=&T=6

[TABLE]
[ROW][C]Meta Analysis of Goldfeld-Quandt test for Heteroskedasticity[/C][/ROW]
[ROW][C]Description[/C][C]# significant tests[/C][C]% significant tests[/C][C]OK/NOK[/C][/ROW]
[ROW][C]1% type I error level[/C][C]0[/C][C] 0[/C][C]OK[/C][/ROW]
[ROW][C]5% type I error level[/C][C]18[/C][C]0.123288[/C][C]NOK[/C][/ROW]
[ROW][C]10% type I error level[/C][C]43[/C][C]0.294521[/C][C]NOK[/C][/ROW]
[/TABLE]
Source: https://freestatistics.org/blog/index.php?pk=&T=6

Globally Unique Identifier (entire table): ba.freestatistics.org/blog/index.php?pk=&T=6

As an alternative you can also use a QR Code:  

The GUIDs for individual cells are displayed in the table below:

Meta Analysis of Goldfeld-Quandt test for Heteroskedasticity
Description# significant tests% significant testsOK/NOK
1% type I error level0 0OK
5% type I error level180.123288NOK
10% type I error level430.294521NOK


Ramsey RESET F-Test for powers (2 and 3) of fitted values
> reset_test_fitted
	RESET test
data:  mylm
RESET = 1.4823, df1 = 2, df2 = 156, p-value = 0.2303
Ramsey RESET F-Test for powers (2 and 3) of regressors
> reset_test_regressors
	RESET test
data:  mylm
RESET = 1.0889, df1 = 12, df2 = 146, p-value = 0.3737
Ramsey RESET F-Test for powers (2 and 3) of principal components
> reset_test_principal_components
	RESET test
data:  mylm
RESET = 1.3856, df1 = 2, df2 = 156, p-value = 0.2532

\begin{tabular}{lllllllll}
\hline
Ramsey RESET F-Test for powers (2 and 3) of fitted values \tabularnewline
> reset_test_fitted
	RESET test
data:  mylm
RESET = 1.4823, df1 = 2, df2 = 156, p-value = 0.2303
\tabularnewline Ramsey RESET F-Test for powers (2 and 3) of regressors \tabularnewline
> reset_test_regressors
	RESET test
data:  mylm
RESET = 1.0889, df1 = 12, df2 = 146, p-value = 0.3737
\tabularnewline Ramsey RESET F-Test for powers (2 and 3) of principal components \tabularnewline
> reset_test_principal_components
	RESET test
data:  mylm
RESET = 1.3856, df1 = 2, df2 = 156, p-value = 0.2532
\tabularnewline \hline \end{tabular} %Source: https://freestatistics.org/blog/index.php?pk=&T=7

[TABLE]
[ROW][C]Ramsey RESET F-Test for powers (2 and 3) of fitted values[/C][/ROW]
[ROW][C]
> reset_test_fitted
	RESET test
data:  mylm
RESET = 1.4823, df1 = 2, df2 = 156, p-value = 0.2303
[/C][/ROW] [ROW][C]Ramsey RESET F-Test for powers (2 and 3) of regressors[/C][/ROW] [ROW][C]
> reset_test_regressors
	RESET test
data:  mylm
RESET = 1.0889, df1 = 12, df2 = 146, p-value = 0.3737
[/C][/ROW] [ROW][C]Ramsey RESET F-Test for powers (2 and 3) of principal components[/C][/ROW] [ROW][C]
> reset_test_principal_components
	RESET test
data:  mylm
RESET = 1.3856, df1 = 2, df2 = 156, p-value = 0.2532
[/C][/ROW] [/TABLE] Source: https://freestatistics.org/blog/index.php?pk=&T=7

Globally Unique Identifier (entire table): ba.freestatistics.org/blog/index.php?pk=&T=7

As an alternative you can also use a QR Code:  

The GUIDs for individual cells are displayed in the table below:

Ramsey RESET F-Test for powers (2 and 3) of fitted values
> reset_test_fitted
	RESET test
data:  mylm
RESET = 1.4823, df1 = 2, df2 = 156, p-value = 0.2303
Ramsey RESET F-Test for powers (2 and 3) of regressors
> reset_test_regressors
	RESET test
data:  mylm
RESET = 1.0889, df1 = 12, df2 = 146, p-value = 0.3737
Ramsey RESET F-Test for powers (2 and 3) of principal components
> reset_test_principal_components
	RESET test
data:  mylm
RESET = 1.3856, df1 = 2, df2 = 156, p-value = 0.2532


Variance Inflation Factors (Multicollinearity)
> vif
     SK1      SK2      SK3      SK4      SK5      SK6 
1.096654 1.123377 1.041969 1.038007 1.046991 1.042807 

\begin{tabular}{lllllllll}
\hline
Variance Inflation Factors (Multicollinearity) \tabularnewline
> vif
     SK1      SK2      SK3      SK4      SK5      SK6 
1.096654 1.123377 1.041969 1.038007 1.046991 1.042807 
\tabularnewline \hline \end{tabular} %Source: https://freestatistics.org/blog/index.php?pk=&T=8

[TABLE]
[ROW][C]Variance Inflation Factors (Multicollinearity)[/C][/ROW]
[ROW][C]
> vif
     SK1      SK2      SK3      SK4      SK5      SK6 
1.096654 1.123377 1.041969 1.038007 1.046991 1.042807 
[/C][/ROW] [/TABLE] Source: https://freestatistics.org/blog/index.php?pk=&T=8

Globally Unique Identifier (entire table): ba.freestatistics.org/blog/index.php?pk=&T=8

As an alternative you can also use a QR Code:  

The GUIDs for individual cells are displayed in the table below:

Variance Inflation Factors (Multicollinearity)
> vif
     SK1      SK2      SK3      SK4      SK5      SK6 
1.096654 1.123377 1.041969 1.038007 1.046991 1.042807 


Parameters (Session):
par1 = 7 ; par2 = Do not include Seasonal Dummies ; par3 = No Linear Trend ; par4 = 0 ; par5 = 0 ;
Parameters (R input):
par1 = 7 ; par2 = Do not include Seasonal Dummies ; par3 = No Linear Trend ; par4 = 0 ; par5 = 0 ;
R code (references can be found in the software module):
par5 <- '0'
par4 <- '0'
par3 <- 'No Linear Trend'
par2 <- 'Do not include Seasonal Dummies'
par1 <- '7'
library(lattice)
library(lmtest)
library(car)
library(MASS)
n25 <- 25 #minimum number of obs. for Goldfeld-Quandt test
mywarning <- ''
par1 <- as.numeric(par1)
if(is.na(par1)) {
par1 <- 1
mywarning = 'Warning: you did not specify the column number of the endogenous series! The first column was selected by default.'
}
if (par4=='') par4 <- 0
par4 <- as.numeric(par4)
if (par5=='') par5 <- 0
par5 <- as.numeric(par5)
x <- na.omit(t(y))
k <- length(x[1,])
n <- length(x[,1])
x1 <- cbind(x[,par1], x[,1:k!=par1])
mycolnames <- c(colnames(x)[par1], colnames(x)[1:k!=par1])
colnames(x1) <- mycolnames #colnames(x)[par1]
x <- x1
if (par3 == 'First Differences'){
(n <- n -1)
x2 <- array(0, dim=c(n,k), dimnames=list(1:n, paste('(1-B)',colnames(x),sep='')))
for (i in 1:n) {
for (j in 1:k) {
x2[i,j] <- x[i+1,j] - x[i,j]
}
}
x <- x2
}
if (par3 == 'Seasonal Differences (s=12)'){
(n <- n - 12)
x2 <- array(0, dim=c(n,k), dimnames=list(1:n, paste('(1-B12)',colnames(x),sep='')))
for (i in 1:n) {
for (j in 1:k) {
x2[i,j] <- x[i+12,j] - x[i,j]
}
}
x <- x2
}
if (par3 == 'First and Seasonal Differences (s=12)'){
(n <- n -1)
x2 <- array(0, dim=c(n,k), dimnames=list(1:n, paste('(1-B)',colnames(x),sep='')))
for (i in 1:n) {
for (j in 1:k) {
x2[i,j] <- x[i+1,j] - x[i,j]
}
}
x <- x2
(n <- n - 12)
x2 <- array(0, dim=c(n,k), dimnames=list(1:n, paste('(1-B12)',colnames(x),sep='')))
for (i in 1:n) {
for (j in 1:k) {
x2[i,j] <- x[i+12,j] - x[i,j]
}
}
x <- x2
}
if(par4 > 0) {
x2 <- array(0, dim=c(n-par4,par4), dimnames=list(1:(n-par4), paste(colnames(x)[par1],'(t-',1:par4,')',sep='')))
for (i in 1:(n-par4)) {
for (j in 1:par4) {
x2[i,j] <- x[i+par4-j,par1]
}
}
x <- cbind(x[(par4+1):n,], x2)
n <- n - par4
}
if(par5 > 0) {
x2 <- array(0, dim=c(n-par5*12,par5), dimnames=list(1:(n-par5*12), paste(colnames(x)[par1],'(t-',1:par5,'s)',sep='')))
for (i in 1:(n-par5*12)) {
for (j in 1:par5) {
x2[i,j] <- x[i+par5*12-j*12,par1]
}
}
x <- cbind(x[(par5*12+1):n,], x2)
n <- n - par5*12
}
if (par2 == 'Include Monthly Dummies'){
x2 <- array(0, dim=c(n,11), dimnames=list(1:n, paste('M', seq(1:11), sep ='')))
for (i in 1:11){
x2[seq(i,n,12),i] <- 1
}
x <- cbind(x, x2)
}
if (par2 == 'Include Quarterly Dummies'){
x2 <- array(0, dim=c(n,3), dimnames=list(1:n, paste('Q', seq(1:3), sep ='')))
for (i in 1:3){
x2[seq(i,n,4),i] <- 1
}
x <- cbind(x, x2)
}
(k <- length(x[n,]))
if (par3 == 'Linear Trend'){
x <- cbind(x, c(1:n))
colnames(x)[k+1] <- 't'
}
print(x)
(k <- length(x[n,]))
head(x)
df <- as.data.frame(x)
(mylm <- lm(df))
(mysum <- summary(mylm))
if (n > n25) {
kp3 <- k + 3
nmkm3 <- n - k - 3
gqarr <- array(NA, dim=c(nmkm3-kp3+1,3))
numgqtests <- 0
numsignificant1 <- 0
numsignificant5 <- 0
numsignificant10 <- 0
for (mypoint in kp3:nmkm3) {
j <- 0
numgqtests <- numgqtests + 1
for (myalt in c('greater', 'two.sided', 'less')) {
j <- j + 1
gqarr[mypoint-kp3+1,j] <- gqtest(mylm, point=mypoint, alternative=myalt)$p.value
}
if (gqarr[mypoint-kp3+1,2] < 0.01) numsignificant1 <- numsignificant1 + 1
if (gqarr[mypoint-kp3+1,2] < 0.05) numsignificant5 <- numsignificant5 + 1
if (gqarr[mypoint-kp3+1,2] < 0.10) numsignificant10 <- numsignificant10 + 1
}
gqarr
}
bitmap(file='test0.png')
plot(x[,1], type='l', main='Actuals and Interpolation', ylab='value of Actuals and Interpolation (dots)', xlab='time or index')
points(x[,1]-mysum$resid)
grid()
dev.off()
bitmap(file='test1.png')
plot(mysum$resid, type='b', pch=19, main='Residuals', ylab='value of Residuals', xlab='time or index')
grid()
dev.off()
bitmap(file='test2.png')
sresid <- studres(mylm)
hist(sresid, freq=FALSE, main='Distribution of Studentized Residuals')
xfit<-seq(min(sresid),max(sresid),length=40)
yfit<-dnorm(xfit)
lines(xfit, yfit)
grid()
dev.off()
bitmap(file='test3.png')
densityplot(~mysum$resid,col='black',main='Residual Density Plot', xlab='values of Residuals')
dev.off()
bitmap(file='test4.png')
qqPlot(mylm, main='QQ Plot')
grid()
dev.off()
(myerror <- as.ts(mysum$resid))
bitmap(file='test5.png')
dum <- cbind(lag(myerror,k=1),myerror)
dum
dum1 <- dum[2:length(myerror),]
dum1
z <- as.data.frame(dum1)
print(z)
plot(z,main=paste('Residual Lag plot, lowess, and regression line'), ylab='values of Residuals', xlab='lagged values of Residuals')
lines(lowess(z))
abline(lm(z))
grid()
dev.off()
bitmap(file='test6.png')
acf(mysum$resid, lag.max=length(mysum$resid)/2, main='Residual Autocorrelation Function')
grid()
dev.off()
bitmap(file='test7.png')
pacf(mysum$resid, lag.max=length(mysum$resid)/2, main='Residual Partial Autocorrelation Function')
grid()
dev.off()
bitmap(file='test8.png')
opar <- par(mfrow = c(2,2), oma = c(0, 0, 1.1, 0))
plot(mylm, las = 1, sub='Residual Diagnostics')
par(opar)
dev.off()
if (n > n25) {
bitmap(file='test9.png')
plot(kp3:nmkm3,gqarr[,2], main='Goldfeld-Quandt test',ylab='2-sided p-value',xlab='breakpoint')
grid()
dev.off()
}
load(file='createtable')
a<-table.start()
a<-table.row.start(a)
a<-table.element(a, 'Multiple Linear Regression - Estimated Regression Equation', 1, TRUE)
a<-table.row.end(a)
myeq <- colnames(x)[1]
myeq <- paste(myeq, '[t] = ', sep='')
for (i in 1:k){
if (mysum$coefficients[i,1] > 0) myeq <- paste(myeq, '+', '')
myeq <- paste(myeq, signif(mysum$coefficients[i,1],6), sep=' ')
if (rownames(mysum$coefficients)[i] != '(Intercept)') {
myeq <- paste(myeq, rownames(mysum$coefficients)[i], sep='')
if (rownames(mysum$coefficients)[i] != 't') myeq <- paste(myeq, '[t]', sep='')
}
}
myeq <- paste(myeq, ' + e[t]')
a<-table.row.start(a)
a<-table.element(a, myeq)
a<-table.row.end(a)
a<-table.row.start(a)
a<-table.element(a, mywarning)
a<-table.row.end(a)
a<-table.end(a)
table.save(a,file='mytable1.tab')
a<-table.start()
a<-table.row.start(a)
a<-table.element(a,'Multiple Linear Regression - Ordinary Least Squares', 6, TRUE)
a<-table.row.end(a)
a<-table.row.start(a)
a<-table.element(a,'Variable',header=TRUE)
a<-table.element(a,'Parameter',header=TRUE)
a<-table.element(a,'S.D.',header=TRUE)
a<-table.element(a,'T-STAT
H0: parameter = 0',header=TRUE)
a<-table.element(a,'2-tail p-value',header=TRUE)
a<-table.element(a,'1-tail p-value',header=TRUE)
a<-table.row.end(a)
for (i in 1:k){
a<-table.row.start(a)
a<-table.element(a,rownames(mysum$coefficients)[i],header=TRUE)
a<-table.element(a,formatC(signif(mysum$coefficients[i,1],5),format='g',flag='+'))
a<-table.element(a,formatC(signif(mysum$coefficients[i,2],5),format='g',flag=' '))
a<-table.element(a,formatC(signif(mysum$coefficients[i,3],4),format='e',flag='+'))
a<-table.element(a,formatC(signif(mysum$coefficients[i,4],4),format='g',flag=' '))
a<-table.element(a,formatC(signif(mysum$coefficients[i,4]/2,4),format='g',flag=' '))
a<-table.row.end(a)
}
a<-table.end(a)
table.save(a,file='mytable2.tab')
a<-table.start()
a<-table.row.start(a)
a<-table.element(a, 'Multiple Linear Regression - Regression Statistics', 2, TRUE)
a<-table.row.end(a)
a<-table.row.start(a)
a<-table.element(a, 'Multiple R',1,TRUE)
a<-table.element(a,formatC(signif(sqrt(mysum$r.squared),6),format='g',flag=' '))
a<-table.row.end(a)
a<-table.row.start(a)
a<-table.element(a, 'R-squared',1,TRUE)
a<-table.element(a,formatC(signif(mysum$r.squared,6),format='g',flag=' '))
a<-table.row.end(a)
a<-table.row.start(a)
a<-table.element(a, 'Adjusted R-squared',1,TRUE)
a<-table.element(a,formatC(signif(mysum$adj.r.squared,6),format='g',flag=' '))
a<-table.row.end(a)
a<-table.row.start(a)
a<-table.element(a, 'F-TEST (value)',1,TRUE)
a<-table.element(a,formatC(signif(mysum$fstatistic[1],6),format='g',flag=' '))
a<-table.row.end(a)
a<-table.row.start(a)
a<-table.element(a, 'F-TEST (DF numerator)',1,TRUE)
a<-table.element(a, signif(mysum$fstatistic[2],6))
a<-table.row.end(a)
a<-table.row.start(a)
a<-table.element(a, 'F-TEST (DF denominator)',1,TRUE)
a<-table.element(a, signif(mysum$fstatistic[3],6))
a<-table.row.end(a)
a<-table.row.start(a)
a<-table.element(a, 'p-value',1,TRUE)
a<-table.element(a,formatC(signif(1-pf(mysum$fstatistic[1],mysum$fstatistic[2],mysum$fstatistic[3]),6),format='g',flag=' '))
a<-table.row.end(a)
a<-table.row.start(a)
a<-table.element(a, 'Multiple Linear Regression - Residual Statistics', 2, TRUE)
a<-table.row.end(a)
a<-table.row.start(a)
a<-table.element(a, 'Residual Standard Deviation',1,TRUE)
a<-table.element(a,formatC(signif(mysum$sigma,6),format='g',flag=' '))
a<-table.row.end(a)
a<-table.row.start(a)
a<-table.element(a, 'Sum Squared Residuals',1,TRUE)
a<-table.element(a,formatC(signif(sum(myerror*myerror),6),format='g',flag=' '))
a<-table.row.end(a)
a<-table.end(a)
table.save(a,file='mytable3.tab')
myr <- as.numeric(mysum$resid)
myr
if(n < 200) {
a<-table.start()
a<-table.row.start(a)
a<-table.element(a, 'Multiple Linear Regression - Actuals, Interpolation, and Residuals', 4, TRUE)
a<-table.row.end(a)
a<-table.row.start(a)
a<-table.element(a, 'Time or Index', 1, TRUE)
a<-table.element(a, 'Actuals', 1, TRUE)
a<-table.element(a, 'Interpolation
Forecast', 1, TRUE)
a<-table.element(a, 'Residuals
Prediction Error', 1, TRUE)
a<-table.row.end(a)
for (i in 1:n) {
a<-table.row.start(a)
a<-table.element(a,i, 1, TRUE)
a<-table.element(a,formatC(signif(x[i],6),format='g',flag=' '))
a<-table.element(a,formatC(signif(x[i]-mysum$resid[i],6),format='g',flag=' '))
a<-table.element(a,formatC(signif(mysum$resid[i],6),format='g',flag=' '))
a<-table.row.end(a)
}
a<-table.end(a)
table.save(a,file='mytable4.tab')
if (n > n25) {
a<-table.start()
a<-table.row.start(a)
a<-table.element(a,'Goldfeld-Quandt test for Heteroskedasticity',4,TRUE)
a<-table.row.end(a)
a<-table.row.start(a)
a<-table.element(a,'p-values',header=TRUE)
a<-table.element(a,'Alternative Hypothesis',3,header=TRUE)
a<-table.row.end(a)
a<-table.row.start(a)
a<-table.element(a,'breakpoint index',header=TRUE)
a<-table.element(a,'greater',header=TRUE)
a<-table.element(a,'2-sided',header=TRUE)
a<-table.element(a,'less',header=TRUE)
a<-table.row.end(a)
for (mypoint in kp3:nmkm3) {
a<-table.row.start(a)
a<-table.element(a,mypoint,header=TRUE)
a<-table.element(a,formatC(signif(gqarr[mypoint-kp3+1,1],6),format='g',flag=' '))
a<-table.element(a,formatC(signif(gqarr[mypoint-kp3+1,2],6),format='g',flag=' '))
a<-table.element(a,formatC(signif(gqarr[mypoint-kp3+1,3],6),format='g',flag=' '))
a<-table.row.end(a)
}
a<-table.end(a)
table.save(a,file='mytable5.tab')
a<-table.start()
a<-table.row.start(a)
a<-table.element(a,'Meta Analysis of Goldfeld-Quandt test for Heteroskedasticity',4,TRUE)
a<-table.row.end(a)
a<-table.row.start(a)
a<-table.element(a,'Description',header=TRUE)
a<-table.element(a,'# significant tests',header=TRUE)
a<-table.element(a,'% significant tests',header=TRUE)
a<-table.element(a,'OK/NOK',header=TRUE)
a<-table.row.end(a)
a<-table.row.start(a)
a<-table.element(a,'1% type I error level',header=TRUE)
a<-table.element(a,signif(numsignificant1,6))
a<-table.element(a,formatC(signif(numsignificant1/numgqtests,6),format='g',flag=' '))
if (numsignificant1/numgqtests < 0.01) dum <- 'OK' else dum <- 'NOK'
a<-table.element(a,dum)
a<-table.row.end(a)
a<-table.row.start(a)
a<-table.element(a,'5% type I error level',header=TRUE)
a<-table.element(a,signif(numsignificant5,6))
a<-table.element(a,signif(numsignificant5/numgqtests,6))
if (numsignificant5/numgqtests < 0.05) dum <- 'OK' else dum <- 'NOK'
a<-table.element(a,dum)
a<-table.row.end(a)
a<-table.row.start(a)
a<-table.element(a,'10% type I error level',header=TRUE)
a<-table.element(a,signif(numsignificant10,6))
a<-table.element(a,signif(numsignificant10/numgqtests,6))
if (numsignificant10/numgqtests < 0.1) dum <- 'OK' else dum <- 'NOK'
a<-table.element(a,dum)
a<-table.row.end(a)
a<-table.end(a)
table.save(a,file='mytable6.tab')
}
}
a<-table.start()
a<-table.row.start(a)
a<-table.element(a,'Ramsey RESET F-Test for powers (2 and 3) of fitted values',1,TRUE)
a<-table.row.end(a)
a<-table.row.start(a)
reset_test_fitted <- resettest(mylm,power=2:3,type='fitted')
a<-table.element(a,paste('
',RC.texteval('reset_test_fitted'),'
',sep=''))
a<-table.row.end(a)
a<-table.row.start(a)
a<-table.element(a,'Ramsey RESET F-Test for powers (2 and 3) of regressors',1,TRUE)
a<-table.row.end(a)
a<-table.row.start(a)
reset_test_regressors <- resettest(mylm,power=2:3,type='regressor')
a<-table.element(a,paste('
',RC.texteval('reset_test_regressors'),'
',sep=''))
a<-table.row.end(a)
a<-table.row.start(a)
a<-table.element(a,'Ramsey RESET F-Test for powers (2 and 3) of principal components',1,TRUE)
a<-table.row.end(a)
a<-table.row.start(a)
reset_test_principal_components <- resettest(mylm,power=2:3,type='princomp')
a<-table.element(a,paste('
',RC.texteval('reset_test_principal_components'),'
',sep=''))
a<-table.row.end(a)
a<-table.end(a)
table.save(a,file='mytable8.tab')
a<-table.start()
a<-table.row.start(a)
a<-table.element(a,'Variance Inflation Factors (Multicollinearity)',1,TRUE)
a<-table.row.end(a)
a<-table.row.start(a)
vif <- vif(mylm)
a<-table.element(a,paste('
',RC.texteval('vif'),'
',sep=''))
a<-table.row.end(a)
a<-table.end(a)
table.save(a,file='mytable9.tab')