Free Statistics

of Irreproducible Research!

Author's title

Author*The author of this computation has been verified*
R Software Modulerwasp_structuraltimeseries.wasp
Title produced by softwareStructural Time Series Models
Date of computationWed, 07 Dec 2016 17:18:08 +0100
Cite this page as followsStatistical Computations at FreeStatistics.org, Office for Research Development and Education, URL https://freestatistics.org/blog/index.php?v=date/2016/Dec/07/t148112756015oqtegbg9mq4s4.htm/, Retrieved Tue, 07 May 2024 12:27:23 +0000
Statistical Computations at FreeStatistics.org, Office for Research Development and Education, URL https://freestatistics.org/blog/index.php?pk=298239, Retrieved Tue, 07 May 2024 12:27:23 +0000
QR Codes:

Original text written by user:
IsPrivate?No (this computation is public)
User-defined keywords
Estimated Impact55
Family? (F = Feedback message, R = changed R code, M = changed R Module, P = changed Parameters, D = changed Data)
-       [Structural Time Series Models] [N1273 F1 comp] [2016-12-07 16:18:08] [fe6e63930acb843607fc81833855c27b] [Current]
Feedback Forum

Post a new message
Dataseries X:
3114
3240
3256
3438
3374
3502
3506
3676
3584
3718
3746
3950
3864
3986
4012
4240
4156
4304
4336
4604
4542
4708
4710
4954
4858
4984
4952
5208
5154
5338
5438
5740
5734
5830
5868
6154


Summary of computational transaction
Raw Input view raw input (R code)
Raw Outputview raw output of R engine
Computing time3 seconds
R ServerBig Analytics Cloud Computing Center

\begin{tabular}{lllllllll}
\hline
Summary of computational transaction \tabularnewline
Raw Input view raw input (R code)  \tabularnewline
Raw Outputview raw output of R engine  \tabularnewline
Computing time3 seconds \tabularnewline
R ServerBig Analytics Cloud Computing Center \tabularnewline
\hline
\end{tabular}
%Source: https://freestatistics.org/blog/index.php?pk=298239&T=0

[TABLE]
[ROW]
Summary of computational transaction[/C][/ROW] [ROW]Raw Input[/C] view raw input (R code) [/C][/ROW] [ROW]Raw Output[/C]view raw output of R engine [/C][/ROW] [ROW]Computing time[/C]3 seconds[/C][/ROW] [ROW]R Server[/C]Big Analytics Cloud Computing Center[/C][/ROW] [/TABLE] Source: https://freestatistics.org/blog/index.php?pk=298239&T=0

Globally Unique Identifier (entire table): ba.freestatistics.org/blog/index.php?pk=298239&T=0

As an alternative you can also use a QR Code:  

The GUIDs for individual cells are displayed in the table below:

Summary of computational transaction
Raw Input view raw input (R code)
Raw Outputview raw output of R engine
Computing time3 seconds
R ServerBig Analytics Cloud Computing Center


Structural Time Series Model -- Interpolation
tObservedLevelSlopeSeasonalStand. Residuals
131143114000
232403204.9039202413611.285844386663635.09607975864342.04526310354138
332563252.0252854255619.1318453825113.974714574438010.817594582589947
434383378.0372065167351.125008879928359.96279348327242.51500098676294
533743404.031315254342.9036455388698-30.0313152543018-0.559120878218321
635023475.7739608682952.502787655038926.226039131710.631270963008734
735063513.3522348175647.5060237157363-7.35223481755586-0.327444478198786
836763630.2724012345870.832856640074745.72759876541741.52710790107131
935843629.5052726168146.7225244432075-45.5052726168107-1.57700252784885
1037183690.5084312138151.535468748317927.49156878618550.314649097575519
1137463742.5048966630351.69088372357013.495103336965310.010158198701473
1239503892.0184606701484.673279001770157.98153932985612.15561442735211
1338643956.8403258415478.153472601932-92.8403258415356-0.459481855551324
1439863995.1184103109864.8985426146429-9.11841031098343-0.857141829102278
1540124046.6246626746360.6016233701189-34.6246626746335-0.273016171163606
1642404145.6079444252272.981193324079194.39205557477890.821597927085462
1741564207.4061684064969.3108102814234-51.4061684064898-0.241654322342599
1843044275.8984502254669.04141392456928.1015497745419-0.0175031337933365
1943364357.0663418957673.0224697242257-21.06634189576270.258712915814016
2046044493.5306756077393.8358850861241110.4693243922751.35725888154109
2145424595.2876976035796.4366848884325-53.2876976035730.169880056555009
2247084690.0384507586995.882861760268217.9615492413152-0.03618884217226
2347104759.6111090562587.250324194395-49.6111090562499-0.564276544046675
2449544868.6922396976794.393749380107485.30776030232610.469046422624022
2548584946.385234196888.9226333580478-88.3852341967966-0.363861876069336
2649845005.07364538979.0092482299484-21.0736453890033-0.646941690878973
2749525026.6360304357160.4187337770063-74.6360304357078-1.20040226007221
2852085093.5414843320362.5103684580895114.4585156679720.137251420201826
2951545186.8074652707872.503038074451-32.80746527078390.658242322112396
3053385300.5022206746685.944255378467337.49777932533630.878572811805595
3154385453.82344904713107.911908355611-15.82344904712961.43037432001697
3257405614.04110411839124.942384341082125.9588958816091.1098841341501
3357345774.66903349163136.557358009777-40.66903349163270.758110621893613
3458305849.19730919498116.374250227057-19.1973091949848-1.31862766256453
3558685936.82685357255107.02990503059-68.8268535725504-0.61148726300159
3661546051.04564082817109.366465615094102.9543591718290.153472746056694

\begin{tabular}{lllllllll}
\hline
Structural Time Series Model -- Interpolation \tabularnewline
t & Observed & Level & Slope & Seasonal & Stand. Residuals \tabularnewline
1 & 3114 & 3114 & 0 & 0 & 0 \tabularnewline
2 & 3240 & 3204.90392024136 & 11.2858443866636 & 35.0960797586434 & 2.04526310354138 \tabularnewline
3 & 3256 & 3252.02528542556 & 19.131845382511 & 3.97471457443801 & 0.817594582589947 \tabularnewline
4 & 3438 & 3378.03720651673 & 51.1250088799283 & 59.9627934832724 & 2.51500098676294 \tabularnewline
5 & 3374 & 3404.0313152543 & 42.9036455388698 & -30.0313152543018 & -0.559120878218321 \tabularnewline
6 & 3502 & 3475.77396086829 & 52.5027876550389 & 26.22603913171 & 0.631270963008734 \tabularnewline
7 & 3506 & 3513.35223481756 & 47.5060237157363 & -7.35223481755586 & -0.327444478198786 \tabularnewline
8 & 3676 & 3630.27240123458 & 70.8328566400747 & 45.7275987654174 & 1.52710790107131 \tabularnewline
9 & 3584 & 3629.50527261681 & 46.7225244432075 & -45.5052726168107 & -1.57700252784885 \tabularnewline
10 & 3718 & 3690.50843121381 & 51.5354687483179 & 27.4915687861855 & 0.314649097575519 \tabularnewline
11 & 3746 & 3742.50489666303 & 51.6908837235701 & 3.49510333696531 & 0.010158198701473 \tabularnewline
12 & 3950 & 3892.01846067014 & 84.6732790017701 & 57.9815393298561 & 2.15561442735211 \tabularnewline
13 & 3864 & 3956.84032584154 & 78.153472601932 & -92.8403258415356 & -0.459481855551324 \tabularnewline
14 & 3986 & 3995.11841031098 & 64.8985426146429 & -9.11841031098343 & -0.857141829102278 \tabularnewline
15 & 4012 & 4046.62466267463 & 60.6016233701189 & -34.6246626746335 & -0.273016171163606 \tabularnewline
16 & 4240 & 4145.60794442522 & 72.9811933240791 & 94.3920555747789 & 0.821597927085462 \tabularnewline
17 & 4156 & 4207.40616840649 & 69.3108102814234 & -51.4061684064898 & -0.241654322342599 \tabularnewline
18 & 4304 & 4275.89845022546 & 69.041413924569 & 28.1015497745419 & -0.0175031337933365 \tabularnewline
19 & 4336 & 4357.06634189576 & 73.0224697242257 & -21.0663418957627 & 0.258712915814016 \tabularnewline
20 & 4604 & 4493.53067560773 & 93.8358850861241 & 110.469324392275 & 1.35725888154109 \tabularnewline
21 & 4542 & 4595.28769760357 & 96.4366848884325 & -53.287697603573 & 0.169880056555009 \tabularnewline
22 & 4708 & 4690.03845075869 & 95.8828617602682 & 17.9615492413152 & -0.03618884217226 \tabularnewline
23 & 4710 & 4759.61110905625 & 87.250324194395 & -49.6111090562499 & -0.564276544046675 \tabularnewline
24 & 4954 & 4868.69223969767 & 94.3937493801074 & 85.3077603023261 & 0.469046422624022 \tabularnewline
25 & 4858 & 4946.3852341968 & 88.9226333580478 & -88.3852341967966 & -0.363861876069336 \tabularnewline
26 & 4984 & 5005.073645389 & 79.0092482299484 & -21.0736453890033 & -0.646941690878973 \tabularnewline
27 & 4952 & 5026.63603043571 & 60.4187337770063 & -74.6360304357078 & -1.20040226007221 \tabularnewline
28 & 5208 & 5093.54148433203 & 62.5103684580895 & 114.458515667972 & 0.137251420201826 \tabularnewline
29 & 5154 & 5186.80746527078 & 72.503038074451 & -32.8074652707839 & 0.658242322112396 \tabularnewline
30 & 5338 & 5300.50222067466 & 85.9442553784673 & 37.4977793253363 & 0.878572811805595 \tabularnewline
31 & 5438 & 5453.82344904713 & 107.911908355611 & -15.8234490471296 & 1.43037432001697 \tabularnewline
32 & 5740 & 5614.04110411839 & 124.942384341082 & 125.958895881609 & 1.1098841341501 \tabularnewline
33 & 5734 & 5774.66903349163 & 136.557358009777 & -40.6690334916327 & 0.758110621893613 \tabularnewline
34 & 5830 & 5849.19730919498 & 116.374250227057 & -19.1973091949848 & -1.31862766256453 \tabularnewline
35 & 5868 & 5936.82685357255 & 107.02990503059 & -68.8268535725504 & -0.61148726300159 \tabularnewline
36 & 6154 & 6051.04564082817 & 109.366465615094 & 102.954359171829 & 0.153472746056694 \tabularnewline
\hline
\end{tabular}
%Source: https://freestatistics.org/blog/index.php?pk=298239&T=1

[TABLE]
[ROW][C]Structural Time Series Model -- Interpolation[/C][/ROW]
[ROW][C]t[/C][C]Observed[/C][C]Level[/C][C]Slope[/C][C]Seasonal[/C][C]Stand. Residuals[/C][/ROW]
[ROW][C]1[/C][C]3114[/C][C]3114[/C][C]0[/C][C]0[/C][C]0[/C][/ROW]
[ROW][C]2[/C][C]3240[/C][C]3204.90392024136[/C][C]11.2858443866636[/C][C]35.0960797586434[/C][C]2.04526310354138[/C][/ROW]
[ROW][C]3[/C][C]3256[/C][C]3252.02528542556[/C][C]19.131845382511[/C][C]3.97471457443801[/C][C]0.817594582589947[/C][/ROW]
[ROW][C]4[/C][C]3438[/C][C]3378.03720651673[/C][C]51.1250088799283[/C][C]59.9627934832724[/C][C]2.51500098676294[/C][/ROW]
[ROW][C]5[/C][C]3374[/C][C]3404.0313152543[/C][C]42.9036455388698[/C][C]-30.0313152543018[/C][C]-0.559120878218321[/C][/ROW]
[ROW][C]6[/C][C]3502[/C][C]3475.77396086829[/C][C]52.5027876550389[/C][C]26.22603913171[/C][C]0.631270963008734[/C][/ROW]
[ROW][C]7[/C][C]3506[/C][C]3513.35223481756[/C][C]47.5060237157363[/C][C]-7.35223481755586[/C][C]-0.327444478198786[/C][/ROW]
[ROW][C]8[/C][C]3676[/C][C]3630.27240123458[/C][C]70.8328566400747[/C][C]45.7275987654174[/C][C]1.52710790107131[/C][/ROW]
[ROW][C]9[/C][C]3584[/C][C]3629.50527261681[/C][C]46.7225244432075[/C][C]-45.5052726168107[/C][C]-1.57700252784885[/C][/ROW]
[ROW][C]10[/C][C]3718[/C][C]3690.50843121381[/C][C]51.5354687483179[/C][C]27.4915687861855[/C][C]0.314649097575519[/C][/ROW]
[ROW][C]11[/C][C]3746[/C][C]3742.50489666303[/C][C]51.6908837235701[/C][C]3.49510333696531[/C][C]0.010158198701473[/C][/ROW]
[ROW][C]12[/C][C]3950[/C][C]3892.01846067014[/C][C]84.6732790017701[/C][C]57.9815393298561[/C][C]2.15561442735211[/C][/ROW]
[ROW][C]13[/C][C]3864[/C][C]3956.84032584154[/C][C]78.153472601932[/C][C]-92.8403258415356[/C][C]-0.459481855551324[/C][/ROW]
[ROW][C]14[/C][C]3986[/C][C]3995.11841031098[/C][C]64.8985426146429[/C][C]-9.11841031098343[/C][C]-0.857141829102278[/C][/ROW]
[ROW][C]15[/C][C]4012[/C][C]4046.62466267463[/C][C]60.6016233701189[/C][C]-34.6246626746335[/C][C]-0.273016171163606[/C][/ROW]
[ROW][C]16[/C][C]4240[/C][C]4145.60794442522[/C][C]72.9811933240791[/C][C]94.3920555747789[/C][C]0.821597927085462[/C][/ROW]
[ROW][C]17[/C][C]4156[/C][C]4207.40616840649[/C][C]69.3108102814234[/C][C]-51.4061684064898[/C][C]-0.241654322342599[/C][/ROW]
[ROW][C]18[/C][C]4304[/C][C]4275.89845022546[/C][C]69.041413924569[/C][C]28.1015497745419[/C][C]-0.0175031337933365[/C][/ROW]
[ROW][C]19[/C][C]4336[/C][C]4357.06634189576[/C][C]73.0224697242257[/C][C]-21.0663418957627[/C][C]0.258712915814016[/C][/ROW]
[ROW][C]20[/C][C]4604[/C][C]4493.53067560773[/C][C]93.8358850861241[/C][C]110.469324392275[/C][C]1.35725888154109[/C][/ROW]
[ROW][C]21[/C][C]4542[/C][C]4595.28769760357[/C][C]96.4366848884325[/C][C]-53.287697603573[/C][C]0.169880056555009[/C][/ROW]
[ROW][C]22[/C][C]4708[/C][C]4690.03845075869[/C][C]95.8828617602682[/C][C]17.9615492413152[/C][C]-0.03618884217226[/C][/ROW]
[ROW][C]23[/C][C]4710[/C][C]4759.61110905625[/C][C]87.250324194395[/C][C]-49.6111090562499[/C][C]-0.564276544046675[/C][/ROW]
[ROW][C]24[/C][C]4954[/C][C]4868.69223969767[/C][C]94.3937493801074[/C][C]85.3077603023261[/C][C]0.469046422624022[/C][/ROW]
[ROW][C]25[/C][C]4858[/C][C]4946.3852341968[/C][C]88.9226333580478[/C][C]-88.3852341967966[/C][C]-0.363861876069336[/C][/ROW]
[ROW][C]26[/C][C]4984[/C][C]5005.073645389[/C][C]79.0092482299484[/C][C]-21.0736453890033[/C][C]-0.646941690878973[/C][/ROW]
[ROW][C]27[/C][C]4952[/C][C]5026.63603043571[/C][C]60.4187337770063[/C][C]-74.6360304357078[/C][C]-1.20040226007221[/C][/ROW]
[ROW][C]28[/C][C]5208[/C][C]5093.54148433203[/C][C]62.5103684580895[/C][C]114.458515667972[/C][C]0.137251420201826[/C][/ROW]
[ROW][C]29[/C][C]5154[/C][C]5186.80746527078[/C][C]72.503038074451[/C][C]-32.8074652707839[/C][C]0.658242322112396[/C][/ROW]
[ROW][C]30[/C][C]5338[/C][C]5300.50222067466[/C][C]85.9442553784673[/C][C]37.4977793253363[/C][C]0.878572811805595[/C][/ROW]
[ROW][C]31[/C][C]5438[/C][C]5453.82344904713[/C][C]107.911908355611[/C][C]-15.8234490471296[/C][C]1.43037432001697[/C][/ROW]
[ROW][C]32[/C][C]5740[/C][C]5614.04110411839[/C][C]124.942384341082[/C][C]125.958895881609[/C][C]1.1098841341501[/C][/ROW]
[ROW][C]33[/C][C]5734[/C][C]5774.66903349163[/C][C]136.557358009777[/C][C]-40.6690334916327[/C][C]0.758110621893613[/C][/ROW]
[ROW][C]34[/C][C]5830[/C][C]5849.19730919498[/C][C]116.374250227057[/C][C]-19.1973091949848[/C][C]-1.31862766256453[/C][/ROW]
[ROW][C]35[/C][C]5868[/C][C]5936.82685357255[/C][C]107.02990503059[/C][C]-68.8268535725504[/C][C]-0.61148726300159[/C][/ROW]
[ROW][C]36[/C][C]6154[/C][C]6051.04564082817[/C][C]109.366465615094[/C][C]102.954359171829[/C][C]0.153472746056694[/C][/ROW]
[/TABLE]
Source: https://freestatistics.org/blog/index.php?pk=298239&T=1

Globally Unique Identifier (entire table): ba.freestatistics.org/blog/index.php?pk=298239&T=1

As an alternative you can also use a QR Code:  

The GUIDs for individual cells are displayed in the table below:

Structural Time Series Model -- Interpolation
tObservedLevelSlopeSeasonalStand. Residuals
131143114000
232403204.9039202413611.285844386663635.09607975864342.04526310354138
332563252.0252854255619.1318453825113.974714574438010.817594582589947
434383378.0372065167351.125008879928359.96279348327242.51500098676294
533743404.031315254342.9036455388698-30.0313152543018-0.559120878218321
635023475.7739608682952.502787655038926.226039131710.631270963008734
735063513.3522348175647.5060237157363-7.35223481755586-0.327444478198786
836763630.2724012345870.832856640074745.72759876541741.52710790107131
935843629.5052726168146.7225244432075-45.5052726168107-1.57700252784885
1037183690.5084312138151.535468748317927.49156878618550.314649097575519
1137463742.5048966630351.69088372357013.495103336965310.010158198701473
1239503892.0184606701484.673279001770157.98153932985612.15561442735211
1338643956.8403258415478.153472601932-92.8403258415356-0.459481855551324
1439863995.1184103109864.8985426146429-9.11841031098343-0.857141829102278
1540124046.6246626746360.6016233701189-34.6246626746335-0.273016171163606
1642404145.6079444252272.981193324079194.39205557477890.821597927085462
1741564207.4061684064969.3108102814234-51.4061684064898-0.241654322342599
1843044275.8984502254669.04141392456928.1015497745419-0.0175031337933365
1943364357.0663418957673.0224697242257-21.06634189576270.258712915814016
2046044493.5306756077393.8358850861241110.4693243922751.35725888154109
2145424595.2876976035796.4366848884325-53.2876976035730.169880056555009
2247084690.0384507586995.882861760268217.9615492413152-0.03618884217226
2347104759.6111090562587.250324194395-49.6111090562499-0.564276544046675
2449544868.6922396976794.393749380107485.30776030232610.469046422624022
2548584946.385234196888.9226333580478-88.3852341967966-0.363861876069336
2649845005.07364538979.0092482299484-21.0736453890033-0.646941690878973
2749525026.6360304357160.4187337770063-74.6360304357078-1.20040226007221
2852085093.5414843320362.5103684580895114.4585156679720.137251420201826
2951545186.8074652707872.503038074451-32.80746527078390.658242322112396
3053385300.5022206746685.944255378467337.49777932533630.878572811805595
3154385453.82344904713107.911908355611-15.82344904712961.43037432001697
3257405614.04110411839124.942384341082125.9588958816091.1098841341501
3357345774.66903349163136.557358009777-40.66903349163270.758110621893613
3458305849.19730919498116.374250227057-19.1973091949848-1.31862766256453
3558685936.82685357255107.02990503059-68.8268535725504-0.61148726300159
3661546051.04564082817109.366465615094102.9543591718290.153472746056694


Structural Time Series Model -- Extrapolation
tObservedLevelSeasonal
16069.710085397266124.51789578452-54.8078103872606
26229.274356699996227.760933327331.51342337266513
36236.237782623486331.00397087014-94.766188246659
46506.066533545966434.2470084129471.819525133019
56453.194148792376537.49004595575-84.2958971633793
66624.475047853766640.73308349856-16.2580356447971
76694.668386062566743.97612104137-49.3077349788078
86968.573386600826847.21915858417121.354228016644
96950.418714708426950.46219612698-0.0434814185588621
107069.439144205237053.7052336697915.7339105354436
117113.2811902367156.9482712126-43.6670809765939
127392.916450513697260.1913087554132.725141758285

\begin{tabular}{lllllllll}
\hline
Structural Time Series Model -- Extrapolation \tabularnewline
t & Observed & Level & Seasonal \tabularnewline
1 & 6069.71008539726 & 6124.51789578452 & -54.8078103872606 \tabularnewline
2 & 6229.27435669999 & 6227.76093332733 & 1.51342337266513 \tabularnewline
3 & 6236.23778262348 & 6331.00397087014 & -94.766188246659 \tabularnewline
4 & 6506.06653354596 & 6434.24700841294 & 71.819525133019 \tabularnewline
5 & 6453.19414879237 & 6537.49004595575 & -84.2958971633793 \tabularnewline
6 & 6624.47504785376 & 6640.73308349856 & -16.2580356447971 \tabularnewline
7 & 6694.66838606256 & 6743.97612104137 & -49.3077349788078 \tabularnewline
8 & 6968.57338660082 & 6847.21915858417 & 121.354228016644 \tabularnewline
9 & 6950.41871470842 & 6950.46219612698 & -0.0434814185588621 \tabularnewline
10 & 7069.43914420523 & 7053.70523366979 & 15.7339105354436 \tabularnewline
11 & 7113.281190236 & 7156.9482712126 & -43.6670809765939 \tabularnewline
12 & 7392.91645051369 & 7260.1913087554 & 132.725141758285 \tabularnewline
\hline
\end{tabular}
%Source: https://freestatistics.org/blog/index.php?pk=298239&T=2

[TABLE]
[ROW][C]Structural Time Series Model -- Extrapolation[/C][/ROW]
[ROW][C]t[/C][C]Observed[/C][C]Level[/C][C]Seasonal[/C][/ROW]
[ROW][C]1[/C][C]6069.71008539726[/C][C]6124.51789578452[/C][C]-54.8078103872606[/C][/ROW]
[ROW][C]2[/C][C]6229.27435669999[/C][C]6227.76093332733[/C][C]1.51342337266513[/C][/ROW]
[ROW][C]3[/C][C]6236.23778262348[/C][C]6331.00397087014[/C][C]-94.766188246659[/C][/ROW]
[ROW][C]4[/C][C]6506.06653354596[/C][C]6434.24700841294[/C][C]71.819525133019[/C][/ROW]
[ROW][C]5[/C][C]6453.19414879237[/C][C]6537.49004595575[/C][C]-84.2958971633793[/C][/ROW]
[ROW][C]6[/C][C]6624.47504785376[/C][C]6640.73308349856[/C][C]-16.2580356447971[/C][/ROW]
[ROW][C]7[/C][C]6694.66838606256[/C][C]6743.97612104137[/C][C]-49.3077349788078[/C][/ROW]
[ROW][C]8[/C][C]6968.57338660082[/C][C]6847.21915858417[/C][C]121.354228016644[/C][/ROW]
[ROW][C]9[/C][C]6950.41871470842[/C][C]6950.46219612698[/C][C]-0.0434814185588621[/C][/ROW]
[ROW][C]10[/C][C]7069.43914420523[/C][C]7053.70523366979[/C][C]15.7339105354436[/C][/ROW]
[ROW][C]11[/C][C]7113.281190236[/C][C]7156.9482712126[/C][C]-43.6670809765939[/C][/ROW]
[ROW][C]12[/C][C]7392.91645051369[/C][C]7260.1913087554[/C][C]132.725141758285[/C][/ROW]
[/TABLE]
Source: https://freestatistics.org/blog/index.php?pk=298239&T=2

Globally Unique Identifier (entire table): ba.freestatistics.org/blog/index.php?pk=298239&T=2

As an alternative you can also use a QR Code:  

The GUIDs for individual cells are displayed in the table below:

Structural Time Series Model -- Extrapolation
tObservedLevelSeasonal
16069.710085397266124.51789578452-54.8078103872606
26229.274356699996227.760933327331.51342337266513
36236.237782623486331.00397087014-94.766188246659
46506.066533545966434.2470084129471.819525133019
56453.194148792376537.49004595575-84.2958971633793
66624.475047853766640.73308349856-16.2580356447971
76694.668386062566743.97612104137-49.3077349788078
86968.573386600826847.21915858417121.354228016644
96950.418714708426950.46219612698-0.0434814185588621
107069.439144205237053.7052336697915.7339105354436
117113.2811902367156.9482712126-43.6670809765939
127392.916450513697260.1913087554132.725141758285


Parameters (Session):
par1 = additive ; par2 = 12 ;
Parameters (R input):
par1 = 12 ; par2 = 12 ; par3 = BFGS ;
R code (references can be found in the software module):
require('stsm')
require('stsm.class')
require('KFKSDS')
par1 <- as.numeric(par1)
par2 <- as.numeric(par2)
nx <- length(x)
x <- ts(x,frequency=par1)
m <- StructTS(x,type='BSM')
print(m$coef)
print(m$fitted)
print(m$resid)
mylevel <- as.numeric(m$fitted[,'level'])
myslope <- as.numeric(m$fitted[,'slope'])
myseas <- as.numeric(m$fitted[,'sea'])
myresid <- as.numeric(m$resid)
myfit <- mylevel+myseas
mm <- stsm.model(model = 'BSM', y = x, transPars = 'StructTS')
fit2 <- stsmFit(mm, stsm.method = 'maxlik.td.optim', method = par3, KF.args = list(P0cov = TRUE))
(fit2.comps <- tsSmooth(fit2, P0cov = FALSE)$states)
m2 <- set.pars(mm, pmax(fit2$par, .Machine$double.eps))
(ss <- char2numeric(m2))
(pred <- predict(ss, x, n.ahead = par2))
mylagmax <- nx/2
bitmap(file='test2.png')
op <- par(mfrow = c(2,2))
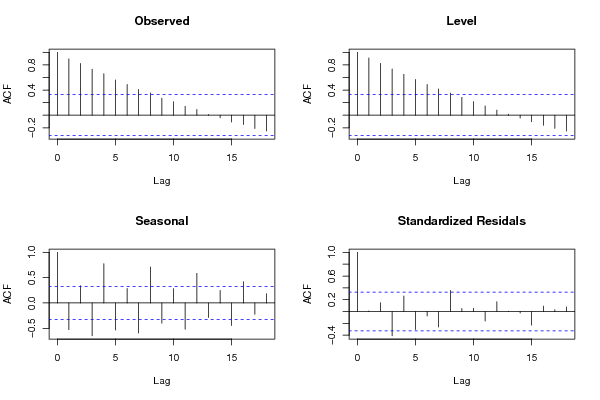
acf(as.numeric(x),lag.max = mylagmax,main='Observed')
acf(mylevel,na.action=na.pass,lag.max = mylagmax,main='Level')
acf(myseas,na.action=na.pass,lag.max = mylagmax,main='Seasonal')
acf(myresid,na.action=na.pass,lag.max = mylagmax,main='Standardized Residals')
par(op)
dev.off()
bitmap(file='test3.png')
op <- par(mfrow = c(2,2))
spectrum(as.numeric(x),main='Observed')
spectrum(mylevel,main='Level')
spectrum(myseas,main='Seasonal')
spectrum(myresid,main='Standardized Residals')
par(op)
dev.off()
bitmap(file='test4.png')
op <- par(mfrow = c(2,2))
cpgram(as.numeric(x),main='Observed')
cpgram(mylevel,main='Level')
cpgram(myseas,main='Seasonal')
cpgram(myresid,main='Standardized Residals')
par(op)
dev.off()
bitmap(file='test1.png')
plot(as.numeric(m$resid),main='Standardized Residuals',ylab='Residuals',xlab='time',type='b')
grid()
dev.off()
bitmap(file='test5.png')
op <- par(mfrow = c(2,2))
hist(m$resid,main='Residual Histogram')
plot(density(m$resid),main='Residual Kernel Density')
qqnorm(m$resid,main='Residual Normal QQ Plot')
qqline(m$resid)
plot(m$resid^2, myfit^2,main='Sq.Resid vs. Sq.Fit',xlab='Squared residuals',ylab='Squared Fit')
par(op)
dev.off()
bitmap(file='test6.png')
par(mfrow = c(3,1), mar = c(3,3,3,3))
plot(cbind(x, pred$pred), type = 'n', plot.type = 'single', ylab = '')
lines(x)
polygon(c(time(pred$pred), rev(time(pred$pred))), c(pred$pred + 2 * pred$se, rev(pred$pred)), col = 'gray85', border = NA)
polygon(c(time(pred$pred), rev(time(pred$pred))), c(pred$pred - 2 * pred$se, rev(pred$pred)), col = ' gray85', border = NA)
lines(pred$pred, col = 'blue', lwd = 1.5)
mtext(text = 'forecasts of the observed series', side = 3, adj = 0)
plot(cbind(x, pred$a[,1]), type = 'n', plot.type = 'single', ylab = '')
lines(x)
polygon(c(time(pred$a[,1]), rev(time(pred$a[,1]))), c(pred$a[,1] + 2 * sqrt(pred$P[,1]), rev(pred$a[,1])), col = 'gray85', border = NA)
polygon(c(time(pred$a[,1]), rev(time(pred$a[,1]))), c(pred$a[,1] - 2 * sqrt(pred$P[,1]), rev(pred$a[,1])), col = ' gray85', border = NA)
lines(pred$a[,1], col = 'blue', lwd = 1.5)
mtext(text = 'forecasts of the level component', side = 3, adj = 0)
plot(cbind(fit2.comps[,3], pred$a[,3]), type = 'n', plot.type = 'single', ylab = '')
lines(fit2.comps[,3])
polygon(c(time(pred$a[,3]), rev(time(pred$a[,3]))), c(pred$a[,3] + 2 * sqrt(pred$P[,3]), rev(pred$a[,3])), col = 'gray85', border = NA)
polygon(c(time(pred$a[,3]), rev(time(pred$a[,3]))), c(pred$a[,3] - 2 * sqrt(pred$P[,3]), rev(pred$a[,3])), col = ' gray85', border = NA)
lines(pred$a[,3], col = 'blue', lwd = 1.5)
mtext(text = 'forecasts of the seasonal component', side = 3, adj = 0)
dev.off()
load(file='createtable')
a<-table.start()
a<-table.row.start(a)
a<-table.element(a,'Structural Time Series Model -- Interpolation',6,TRUE)
a<-table.row.end(a)
a<-table.row.start(a)
a<-table.element(a,'t',header=TRUE)
a<-table.element(a,'Observed',header=TRUE)
a<-table.element(a,'Level',header=TRUE)
a<-table.element(a,'Slope',header=TRUE)
a<-table.element(a,'Seasonal',header=TRUE)
a<-table.element(a,'Stand. Residuals',header=TRUE)
a<-table.row.end(a)
for (i in 1:nx) {
a<-table.row.start(a)
a<-table.element(a,i,header=TRUE)
a<-table.element(a,x[i])
a<-table.element(a,mylevel[i])
a<-table.element(a,myslope[i])
a<-table.element(a,myseas[i])
a<-table.element(a,myresid[i])
a<-table.row.end(a)
}
a<-table.end(a)
table.save(a,file='mytable.tab')
a<-table.start()
a<-table.row.start(a)
a<-table.element(a,'Structural Time Series Model -- Extrapolation',4,TRUE)
a<-table.row.end(a)
a<-table.row.start(a)
a<-table.element(a,'t',header=TRUE)
a<-table.element(a,'Observed',header=TRUE)
a<-table.element(a,'Level',header=TRUE)
a<-table.element(a,'Seasonal',header=TRUE)
a<-table.row.end(a)
for (i in 1:par2) {
a<-table.row.start(a)
a<-table.element(a,i,header=TRUE)
a<-table.element(a,pred$pred[i])
a<-table.element(a,pred$a[i,1])
a<-table.element(a,pred$a[i,3])
a<-table.row.end(a)
}
a<-table.end(a)
table.save(a,file='mytable1.tab')