Free Statistics

of Irreproducible Research!

Author's title

Author*The author of this computation has been verified*
R Software Modulerwasp_autocorrelation.wasp
Title produced by software(Partial) Autocorrelation Function
Date of computationThu, 08 Dec 2016 21:48:46 +0100
Cite this page as followsStatistical Computations at FreeStatistics.org, Office for Research Development and Education, URL https://freestatistics.org/blog/index.php?v=date/2016/Dec/08/t1481230175nbnsjnc4efr8kpz.htm/, Retrieved Sun, 28 Apr 2024 08:47:48 +0000
Statistical Computations at FreeStatistics.org, Office for Research Development and Education, URL https://freestatistics.org/blog/index.php?pk=298395, Retrieved Sun, 28 Apr 2024 08:47:48 +0000
QR Codes:

Original text written by user:
IsPrivate?No (this computation is public)
User-defined keywords
Estimated Impact46
Family? (F = Feedback message, R = changed R code, M = changed R Module, P = changed Parameters, D = changed Data)
-       [(Partial) Autocorrelation Function] [autocorrelatie D=1] [2016-12-08 20:48:46] [d900f94b3f64e304b47af1531cb36401] [Current]
Feedback Forum

Post a new message
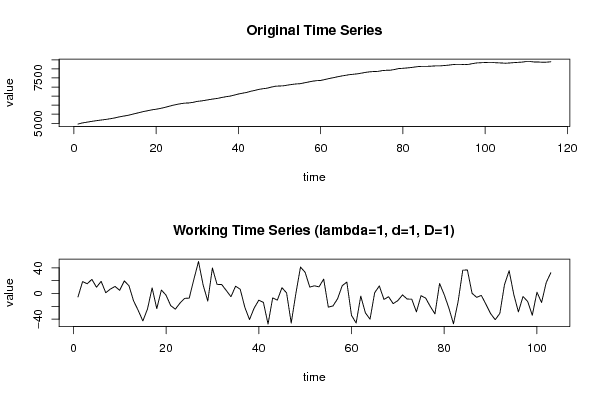
Dataseries X:
4956
5014.8
5053
5092.2
5126
5160
5188.8
5219.4
5255.6
5297
5349.8
5392.4
5429.8
5483.2
5540
5594.4
5650.2
5694
5741.8
5773.6
5816.8
5869.2
5927
5989.2
6038.8
6080.6
6111
6122.6
6154.4
6207
6231.2
6268.4
6309
6342.6
6376
6423.2
6465.2
6499.8
6552.2
6613.6
6658.6
6699.4
6763.4
6814.8
6869.4
6907.6
6936
6994.6
7043.2
7056.2
7068
7106.6
7141.2
7168.2
7184.6
7229.2
7273.4
7320.6
7350
7362.6
7411.2
7465.4
7510.2
7558.8
7605.4
7642.8
7681.6
7705
7729.8
7768.8
7810.4
7840.8
7855.4
7863.6
7904.4
7922.8
7929.4
7968
8018.6
8032.8
8052.6
8075.8
8106.4
8134.6
8140.6
8140
8152.2
8167.2
8166.6
8185
8203.8
8233.6
8251.6
8252.2
8235.6
8251.4
8293.8
8329.8
8342.4
8351.4
8347.8
8349.4
8337
8326
8313
8327.4
8346.4
8360.8
8374.6
8406
8406.2
8381.4
8379.8
8367.4
8372
8393.4


Summary of computational transaction
Raw Input view raw input (R code)
Raw Outputview raw output of R engine
Computing time2 seconds
R ServerBig Analytics Cloud Computing Center

\begin{tabular}{lllllllll}
\hline
Summary of computational transaction \tabularnewline
Raw Input view raw input (R code)  \tabularnewline
Raw Outputview raw output of R engine  \tabularnewline
Computing time2 seconds \tabularnewline
R ServerBig Analytics Cloud Computing Center \tabularnewline
\hline
\end{tabular}
%Source: https://freestatistics.org/blog/index.php?pk=298395&T=0

[TABLE]
[ROW]
Summary of computational transaction[/C][/ROW] [ROW]Raw Input[/C] view raw input (R code) [/C][/ROW] [ROW]Raw Output[/C]view raw output of R engine [/C][/ROW] [ROW]Computing time[/C]2 seconds[/C][/ROW] [ROW]R Server[/C]Big Analytics Cloud Computing Center[/C][/ROW] [/TABLE] Source: https://freestatistics.org/blog/index.php?pk=298395&T=0

Globally Unique Identifier (entire table): ba.freestatistics.org/blog/index.php?pk=298395&T=0

As an alternative you can also use a QR Code:  

The GUIDs for individual cells are displayed in the table below:

Summary of computational transaction
Raw Input view raw input (R code)
Raw Outputview raw output of R engine
Computing time2 seconds
R ServerBig Analytics Cloud Computing Center


Autocorrelation Function
Time lag kACF(k)T-STATP-value
10.4116454.17773.1e-05
2-0.025036-0.25410.399968
30.0070810.07190.471426
40.0759460.77080.221304
50.0526760.53460.29704
6-0.095334-0.96750.167773
7-0.159512-1.61890.054267
80.0696380.70680.240659
90.152171.54440.062785
10-0.110661-1.12310.132006
11-0.433295-4.39751.3e-05
12-0.483444-4.90642e-06
13-0.064592-0.65550.256792
14-0.007502-0.07610.46973
15-0.126921-1.28810.100298
16-0.063795-0.64740.259392
170.0907560.92110.179583
180.229312.32720.010954
190.1634041.65840.050143
20-0.044016-0.44670.328008
210.0801070.8130.209046
220.2626212.66530.004466
230.1888061.91620.029058
240.061020.61930.268548
250.0448350.4550.325026
260.1648751.67330.048651
270.1411521.43250.077509
28-0.039985-0.40580.342865
29-0.080491-0.81690.207937
30-0.068484-0.6950.244298
31-0.016743-0.16990.432701
32-0.028635-0.29060.385967
33-0.193002-1.95880.026422
34-0.107332-1.08930.139281
350.0910280.92380.178867
36-0.023697-0.24050.405212
37-0.166438-1.68920.047106
38-0.107829-1.09430.138178
39-0.005021-0.0510.479731
400.0508510.51610.303452
41-0.018084-0.18350.427371
42-0.091485-0.92850.177668
43-0.010124-0.10270.459181
440.079520.8070.210751
450.0813710.82580.205406
46-0.031001-0.31460.376839
47-0.094042-0.95440.171053
480.0653910.66370.254198

\begin{tabular}{lllllllll}
\hline
Autocorrelation Function \tabularnewline
Time lag k & ACF(k) & T-STAT & P-value \tabularnewline
1 & 0.411645 & 4.1777 & 3.1e-05 \tabularnewline
2 & -0.025036 & -0.2541 & 0.399968 \tabularnewline
3 & 0.007081 & 0.0719 & 0.471426 \tabularnewline
4 & 0.075946 & 0.7708 & 0.221304 \tabularnewline
5 & 0.052676 & 0.5346 & 0.29704 \tabularnewline
6 & -0.095334 & -0.9675 & 0.167773 \tabularnewline
7 & -0.159512 & -1.6189 & 0.054267 \tabularnewline
8 & 0.069638 & 0.7068 & 0.240659 \tabularnewline
9 & 0.15217 & 1.5444 & 0.062785 \tabularnewline
10 & -0.110661 & -1.1231 & 0.132006 \tabularnewline
11 & -0.433295 & -4.3975 & 1.3e-05 \tabularnewline
12 & -0.483444 & -4.9064 & 2e-06 \tabularnewline
13 & -0.064592 & -0.6555 & 0.256792 \tabularnewline
14 & -0.007502 & -0.0761 & 0.46973 \tabularnewline
15 & -0.126921 & -1.2881 & 0.100298 \tabularnewline
16 & -0.063795 & -0.6474 & 0.259392 \tabularnewline
17 & 0.090756 & 0.9211 & 0.179583 \tabularnewline
18 & 0.22931 & 2.3272 & 0.010954 \tabularnewline
19 & 0.163404 & 1.6584 & 0.050143 \tabularnewline
20 & -0.044016 & -0.4467 & 0.328008 \tabularnewline
21 & 0.080107 & 0.813 & 0.209046 \tabularnewline
22 & 0.262621 & 2.6653 & 0.004466 \tabularnewline
23 & 0.188806 & 1.9162 & 0.029058 \tabularnewline
24 & 0.06102 & 0.6193 & 0.268548 \tabularnewline
25 & 0.044835 & 0.455 & 0.325026 \tabularnewline
26 & 0.164875 & 1.6733 & 0.048651 \tabularnewline
27 & 0.141152 & 1.4325 & 0.077509 \tabularnewline
28 & -0.039985 & -0.4058 & 0.342865 \tabularnewline
29 & -0.080491 & -0.8169 & 0.207937 \tabularnewline
30 & -0.068484 & -0.695 & 0.244298 \tabularnewline
31 & -0.016743 & -0.1699 & 0.432701 \tabularnewline
32 & -0.028635 & -0.2906 & 0.385967 \tabularnewline
33 & -0.193002 & -1.9588 & 0.026422 \tabularnewline
34 & -0.107332 & -1.0893 & 0.139281 \tabularnewline
35 & 0.091028 & 0.9238 & 0.178867 \tabularnewline
36 & -0.023697 & -0.2405 & 0.405212 \tabularnewline
37 & -0.166438 & -1.6892 & 0.047106 \tabularnewline
38 & -0.107829 & -1.0943 & 0.138178 \tabularnewline
39 & -0.005021 & -0.051 & 0.479731 \tabularnewline
40 & 0.050851 & 0.5161 & 0.303452 \tabularnewline
41 & -0.018084 & -0.1835 & 0.427371 \tabularnewline
42 & -0.091485 & -0.9285 & 0.177668 \tabularnewline
43 & -0.010124 & -0.1027 & 0.459181 \tabularnewline
44 & 0.07952 & 0.807 & 0.210751 \tabularnewline
45 & 0.081371 & 0.8258 & 0.205406 \tabularnewline
46 & -0.031001 & -0.3146 & 0.376839 \tabularnewline
47 & -0.094042 & -0.9544 & 0.171053 \tabularnewline
48 & 0.065391 & 0.6637 & 0.254198 \tabularnewline
\hline
\end{tabular}
%Source: https://freestatistics.org/blog/index.php?pk=298395&T=1

[TABLE]
[ROW][C]Autocorrelation Function[/C][/ROW]
[ROW][C]Time lag k[/C][C]ACF(k)[/C][C]T-STAT[/C][C]P-value[/C][/ROW]
[ROW][C]1[/C][C]0.411645[/C][C]4.1777[/C][C]3.1e-05[/C][/ROW]
[ROW][C]2[/C][C]-0.025036[/C][C]-0.2541[/C][C]0.399968[/C][/ROW]
[ROW][C]3[/C][C]0.007081[/C][C]0.0719[/C][C]0.471426[/C][/ROW]
[ROW][C]4[/C][C]0.075946[/C][C]0.7708[/C][C]0.221304[/C][/ROW]
[ROW][C]5[/C][C]0.052676[/C][C]0.5346[/C][C]0.29704[/C][/ROW]
[ROW][C]6[/C][C]-0.095334[/C][C]-0.9675[/C][C]0.167773[/C][/ROW]
[ROW][C]7[/C][C]-0.159512[/C][C]-1.6189[/C][C]0.054267[/C][/ROW]
[ROW][C]8[/C][C]0.069638[/C][C]0.7068[/C][C]0.240659[/C][/ROW]
[ROW][C]9[/C][C]0.15217[/C][C]1.5444[/C][C]0.062785[/C][/ROW]
[ROW][C]10[/C][C]-0.110661[/C][C]-1.1231[/C][C]0.132006[/C][/ROW]
[ROW][C]11[/C][C]-0.433295[/C][C]-4.3975[/C][C]1.3e-05[/C][/ROW]
[ROW][C]12[/C][C]-0.483444[/C][C]-4.9064[/C][C]2e-06[/C][/ROW]
[ROW][C]13[/C][C]-0.064592[/C][C]-0.6555[/C][C]0.256792[/C][/ROW]
[ROW][C]14[/C][C]-0.007502[/C][C]-0.0761[/C][C]0.46973[/C][/ROW]
[ROW][C]15[/C][C]-0.126921[/C][C]-1.2881[/C][C]0.100298[/C][/ROW]
[ROW][C]16[/C][C]-0.063795[/C][C]-0.6474[/C][C]0.259392[/C][/ROW]
[ROW][C]17[/C][C]0.090756[/C][C]0.9211[/C][C]0.179583[/C][/ROW]
[ROW][C]18[/C][C]0.22931[/C][C]2.3272[/C][C]0.010954[/C][/ROW]
[ROW][C]19[/C][C]0.163404[/C][C]1.6584[/C][C]0.050143[/C][/ROW]
[ROW][C]20[/C][C]-0.044016[/C][C]-0.4467[/C][C]0.328008[/C][/ROW]
[ROW][C]21[/C][C]0.080107[/C][C]0.813[/C][C]0.209046[/C][/ROW]
[ROW][C]22[/C][C]0.262621[/C][C]2.6653[/C][C]0.004466[/C][/ROW]
[ROW][C]23[/C][C]0.188806[/C][C]1.9162[/C][C]0.029058[/C][/ROW]
[ROW][C]24[/C][C]0.06102[/C][C]0.6193[/C][C]0.268548[/C][/ROW]
[ROW][C]25[/C][C]0.044835[/C][C]0.455[/C][C]0.325026[/C][/ROW]
[ROW][C]26[/C][C]0.164875[/C][C]1.6733[/C][C]0.048651[/C][/ROW]
[ROW][C]27[/C][C]0.141152[/C][C]1.4325[/C][C]0.077509[/C][/ROW]
[ROW][C]28[/C][C]-0.039985[/C][C]-0.4058[/C][C]0.342865[/C][/ROW]
[ROW][C]29[/C][C]-0.080491[/C][C]-0.8169[/C][C]0.207937[/C][/ROW]
[ROW][C]30[/C][C]-0.068484[/C][C]-0.695[/C][C]0.244298[/C][/ROW]
[ROW][C]31[/C][C]-0.016743[/C][C]-0.1699[/C][C]0.432701[/C][/ROW]
[ROW][C]32[/C][C]-0.028635[/C][C]-0.2906[/C][C]0.385967[/C][/ROW]
[ROW][C]33[/C][C]-0.193002[/C][C]-1.9588[/C][C]0.026422[/C][/ROW]
[ROW][C]34[/C][C]-0.107332[/C][C]-1.0893[/C][C]0.139281[/C][/ROW]
[ROW][C]35[/C][C]0.091028[/C][C]0.9238[/C][C]0.178867[/C][/ROW]
[ROW][C]36[/C][C]-0.023697[/C][C]-0.2405[/C][C]0.405212[/C][/ROW]
[ROW][C]37[/C][C]-0.166438[/C][C]-1.6892[/C][C]0.047106[/C][/ROW]
[ROW][C]38[/C][C]-0.107829[/C][C]-1.0943[/C][C]0.138178[/C][/ROW]
[ROW][C]39[/C][C]-0.005021[/C][C]-0.051[/C][C]0.479731[/C][/ROW]
[ROW][C]40[/C][C]0.050851[/C][C]0.5161[/C][C]0.303452[/C][/ROW]
[ROW][C]41[/C][C]-0.018084[/C][C]-0.1835[/C][C]0.427371[/C][/ROW]
[ROW][C]42[/C][C]-0.091485[/C][C]-0.9285[/C][C]0.177668[/C][/ROW]
[ROW][C]43[/C][C]-0.010124[/C][C]-0.1027[/C][C]0.459181[/C][/ROW]
[ROW][C]44[/C][C]0.07952[/C][C]0.807[/C][C]0.210751[/C][/ROW]
[ROW][C]45[/C][C]0.081371[/C][C]0.8258[/C][C]0.205406[/C][/ROW]
[ROW][C]46[/C][C]-0.031001[/C][C]-0.3146[/C][C]0.376839[/C][/ROW]
[ROW][C]47[/C][C]-0.094042[/C][C]-0.9544[/C][C]0.171053[/C][/ROW]
[ROW][C]48[/C][C]0.065391[/C][C]0.6637[/C][C]0.254198[/C][/ROW]
[/TABLE]
Source: https://freestatistics.org/blog/index.php?pk=298395&T=1

Globally Unique Identifier (entire table): ba.freestatistics.org/blog/index.php?pk=298395&T=1

As an alternative you can also use a QR Code:  

The GUIDs for individual cells are displayed in the table below:

Autocorrelation Function
Time lag kACF(k)T-STATP-value
10.4116454.17773.1e-05
2-0.025036-0.25410.399968
30.0070810.07190.471426
40.0759460.77080.221304
50.0526760.53460.29704
6-0.095334-0.96750.167773
7-0.159512-1.61890.054267
80.0696380.70680.240659
90.152171.54440.062785
10-0.110661-1.12310.132006
11-0.433295-4.39751.3e-05
12-0.483444-4.90642e-06
13-0.064592-0.65550.256792
14-0.007502-0.07610.46973
15-0.126921-1.28810.100298
16-0.063795-0.64740.259392
170.0907560.92110.179583
180.229312.32720.010954
190.1634041.65840.050143
20-0.044016-0.44670.328008
210.0801070.8130.209046
220.2626212.66530.004466
230.1888061.91620.029058
240.061020.61930.268548
250.0448350.4550.325026
260.1648751.67330.048651
270.1411521.43250.077509
28-0.039985-0.40580.342865
29-0.080491-0.81690.207937
30-0.068484-0.6950.244298
31-0.016743-0.16990.432701
32-0.028635-0.29060.385967
33-0.193002-1.95880.026422
34-0.107332-1.08930.139281
350.0910280.92380.178867
36-0.023697-0.24050.405212
37-0.166438-1.68920.047106
38-0.107829-1.09430.138178
39-0.005021-0.0510.479731
400.0508510.51610.303452
41-0.018084-0.18350.427371
42-0.091485-0.92850.177668
43-0.010124-0.10270.459181
440.079520.8070.210751
450.0813710.82580.205406
46-0.031001-0.31460.376839
47-0.094042-0.95440.171053
480.0653910.66370.254198


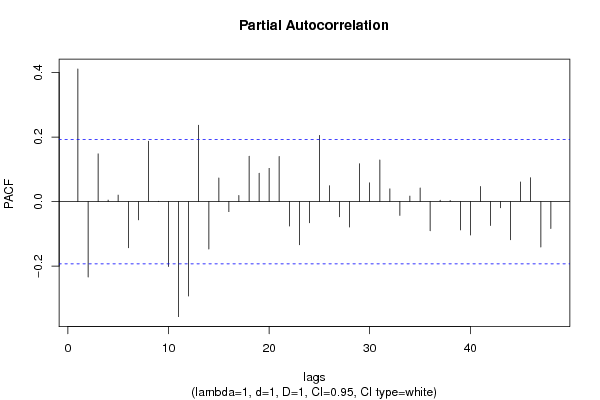
Partial Autocorrelation Function
Time lag kPACF(k)T-STATP-value
10.4116454.17773.1e-05
2-0.234167-2.37650.009662
30.1480161.50220.068053
40.0044650.04530.481971
50.0201840.20480.419047
6-0.143083-1.45210.074751
7-0.056687-0.57530.283167
80.1870211.89810.030244
90.0013260.01350.494646
10-0.201247-2.04240.021832
11-0.357126-3.62440.000226
12-0.292952-2.97310.001835
130.2369362.40460.008987
14-0.147412-1.49610.068847
150.0734330.74530.228906
16-0.031106-0.31570.376437
170.018890.19170.424172
180.1408321.42930.077974
190.0879880.8930.186974
200.1030391.04570.149067
210.1399531.42040.07926
22-0.075833-0.76960.221642
23-0.133769-1.35760.088778
24-0.065676-0.66650.253279
250.2054162.08470.019783
260.0490770.49810.309747
27-0.047296-0.480.316122
28-0.079-0.80180.212268
290.1173561.1910.118189
300.0582150.59080.277967
310.1292361.31160.096285
320.0394360.40020.344906
33-0.042937-0.43580.331962
340.0169290.17180.43196
350.0419340.42560.33565
36-0.09052-0.91870.180205
370.0040830.04140.483513
380.0035480.0360.485671
39-0.08777-0.89080.187564
40-0.1036-1.05140.147761
410.0467520.47450.31808
42-0.074272-0.75380.22635
43-0.019054-0.19340.423523
44-0.118404-1.20170.116124
450.0605670.61470.270058
460.0741440.75250.226738
47-0.140767-1.42860.078068
48-0.083611-0.84860.199046

\begin{tabular}{lllllllll}
\hline
Partial Autocorrelation Function \tabularnewline
Time lag k & PACF(k) & T-STAT & P-value \tabularnewline
1 & 0.411645 & 4.1777 & 3.1e-05 \tabularnewline
2 & -0.234167 & -2.3765 & 0.009662 \tabularnewline
3 & 0.148016 & 1.5022 & 0.068053 \tabularnewline
4 & 0.004465 & 0.0453 & 0.481971 \tabularnewline
5 & 0.020184 & 0.2048 & 0.419047 \tabularnewline
6 & -0.143083 & -1.4521 & 0.074751 \tabularnewline
7 & -0.056687 & -0.5753 & 0.283167 \tabularnewline
8 & 0.187021 & 1.8981 & 0.030244 \tabularnewline
9 & 0.001326 & 0.0135 & 0.494646 \tabularnewline
10 & -0.201247 & -2.0424 & 0.021832 \tabularnewline
11 & -0.357126 & -3.6244 & 0.000226 \tabularnewline
12 & -0.292952 & -2.9731 & 0.001835 \tabularnewline
13 & 0.236936 & 2.4046 & 0.008987 \tabularnewline
14 & -0.147412 & -1.4961 & 0.068847 \tabularnewline
15 & 0.073433 & 0.7453 & 0.228906 \tabularnewline
16 & -0.031106 & -0.3157 & 0.376437 \tabularnewline
17 & 0.01889 & 0.1917 & 0.424172 \tabularnewline
18 & 0.140832 & 1.4293 & 0.077974 \tabularnewline
19 & 0.087988 & 0.893 & 0.186974 \tabularnewline
20 & 0.103039 & 1.0457 & 0.149067 \tabularnewline
21 & 0.139953 & 1.4204 & 0.07926 \tabularnewline
22 & -0.075833 & -0.7696 & 0.221642 \tabularnewline
23 & -0.133769 & -1.3576 & 0.088778 \tabularnewline
24 & -0.065676 & -0.6665 & 0.253279 \tabularnewline
25 & 0.205416 & 2.0847 & 0.019783 \tabularnewline
26 & 0.049077 & 0.4981 & 0.309747 \tabularnewline
27 & -0.047296 & -0.48 & 0.316122 \tabularnewline
28 & -0.079 & -0.8018 & 0.212268 \tabularnewline
29 & 0.117356 & 1.191 & 0.118189 \tabularnewline
30 & 0.058215 & 0.5908 & 0.277967 \tabularnewline
31 & 0.129236 & 1.3116 & 0.096285 \tabularnewline
32 & 0.039436 & 0.4002 & 0.344906 \tabularnewline
33 & -0.042937 & -0.4358 & 0.331962 \tabularnewline
34 & 0.016929 & 0.1718 & 0.43196 \tabularnewline
35 & 0.041934 & 0.4256 & 0.33565 \tabularnewline
36 & -0.09052 & -0.9187 & 0.180205 \tabularnewline
37 & 0.004083 & 0.0414 & 0.483513 \tabularnewline
38 & 0.003548 & 0.036 & 0.485671 \tabularnewline
39 & -0.08777 & -0.8908 & 0.187564 \tabularnewline
40 & -0.1036 & -1.0514 & 0.147761 \tabularnewline
41 & 0.046752 & 0.4745 & 0.31808 \tabularnewline
42 & -0.074272 & -0.7538 & 0.22635 \tabularnewline
43 & -0.019054 & -0.1934 & 0.423523 \tabularnewline
44 & -0.118404 & -1.2017 & 0.116124 \tabularnewline
45 & 0.060567 & 0.6147 & 0.270058 \tabularnewline
46 & 0.074144 & 0.7525 & 0.226738 \tabularnewline
47 & -0.140767 & -1.4286 & 0.078068 \tabularnewline
48 & -0.083611 & -0.8486 & 0.199046 \tabularnewline
\hline
\end{tabular}
%Source: https://freestatistics.org/blog/index.php?pk=298395&T=2

[TABLE]
[ROW][C]Partial Autocorrelation Function[/C][/ROW]
[ROW][C]Time lag k[/C][C]PACF(k)[/C][C]T-STAT[/C][C]P-value[/C][/ROW]
[ROW][C]1[/C][C]0.411645[/C][C]4.1777[/C][C]3.1e-05[/C][/ROW]
[ROW][C]2[/C][C]-0.234167[/C][C]-2.3765[/C][C]0.009662[/C][/ROW]
[ROW][C]3[/C][C]0.148016[/C][C]1.5022[/C][C]0.068053[/C][/ROW]
[ROW][C]4[/C][C]0.004465[/C][C]0.0453[/C][C]0.481971[/C][/ROW]
[ROW][C]5[/C][C]0.020184[/C][C]0.2048[/C][C]0.419047[/C][/ROW]
[ROW][C]6[/C][C]-0.143083[/C][C]-1.4521[/C][C]0.074751[/C][/ROW]
[ROW][C]7[/C][C]-0.056687[/C][C]-0.5753[/C][C]0.283167[/C][/ROW]
[ROW][C]8[/C][C]0.187021[/C][C]1.8981[/C][C]0.030244[/C][/ROW]
[ROW][C]9[/C][C]0.001326[/C][C]0.0135[/C][C]0.494646[/C][/ROW]
[ROW][C]10[/C][C]-0.201247[/C][C]-2.0424[/C][C]0.021832[/C][/ROW]
[ROW][C]11[/C][C]-0.357126[/C][C]-3.6244[/C][C]0.000226[/C][/ROW]
[ROW][C]12[/C][C]-0.292952[/C][C]-2.9731[/C][C]0.001835[/C][/ROW]
[ROW][C]13[/C][C]0.236936[/C][C]2.4046[/C][C]0.008987[/C][/ROW]
[ROW][C]14[/C][C]-0.147412[/C][C]-1.4961[/C][C]0.068847[/C][/ROW]
[ROW][C]15[/C][C]0.073433[/C][C]0.7453[/C][C]0.228906[/C][/ROW]
[ROW][C]16[/C][C]-0.031106[/C][C]-0.3157[/C][C]0.376437[/C][/ROW]
[ROW][C]17[/C][C]0.01889[/C][C]0.1917[/C][C]0.424172[/C][/ROW]
[ROW][C]18[/C][C]0.140832[/C][C]1.4293[/C][C]0.077974[/C][/ROW]
[ROW][C]19[/C][C]0.087988[/C][C]0.893[/C][C]0.186974[/C][/ROW]
[ROW][C]20[/C][C]0.103039[/C][C]1.0457[/C][C]0.149067[/C][/ROW]
[ROW][C]21[/C][C]0.139953[/C][C]1.4204[/C][C]0.07926[/C][/ROW]
[ROW][C]22[/C][C]-0.075833[/C][C]-0.7696[/C][C]0.221642[/C][/ROW]
[ROW][C]23[/C][C]-0.133769[/C][C]-1.3576[/C][C]0.088778[/C][/ROW]
[ROW][C]24[/C][C]-0.065676[/C][C]-0.6665[/C][C]0.253279[/C][/ROW]
[ROW][C]25[/C][C]0.205416[/C][C]2.0847[/C][C]0.019783[/C][/ROW]
[ROW][C]26[/C][C]0.049077[/C][C]0.4981[/C][C]0.309747[/C][/ROW]
[ROW][C]27[/C][C]-0.047296[/C][C]-0.48[/C][C]0.316122[/C][/ROW]
[ROW][C]28[/C][C]-0.079[/C][C]-0.8018[/C][C]0.212268[/C][/ROW]
[ROW][C]29[/C][C]0.117356[/C][C]1.191[/C][C]0.118189[/C][/ROW]
[ROW][C]30[/C][C]0.058215[/C][C]0.5908[/C][C]0.277967[/C][/ROW]
[ROW][C]31[/C][C]0.129236[/C][C]1.3116[/C][C]0.096285[/C][/ROW]
[ROW][C]32[/C][C]0.039436[/C][C]0.4002[/C][C]0.344906[/C][/ROW]
[ROW][C]33[/C][C]-0.042937[/C][C]-0.4358[/C][C]0.331962[/C][/ROW]
[ROW][C]34[/C][C]0.016929[/C][C]0.1718[/C][C]0.43196[/C][/ROW]
[ROW][C]35[/C][C]0.041934[/C][C]0.4256[/C][C]0.33565[/C][/ROW]
[ROW][C]36[/C][C]-0.09052[/C][C]-0.9187[/C][C]0.180205[/C][/ROW]
[ROW][C]37[/C][C]0.004083[/C][C]0.0414[/C][C]0.483513[/C][/ROW]
[ROW][C]38[/C][C]0.003548[/C][C]0.036[/C][C]0.485671[/C][/ROW]
[ROW][C]39[/C][C]-0.08777[/C][C]-0.8908[/C][C]0.187564[/C][/ROW]
[ROW][C]40[/C][C]-0.1036[/C][C]-1.0514[/C][C]0.147761[/C][/ROW]
[ROW][C]41[/C][C]0.046752[/C][C]0.4745[/C][C]0.31808[/C][/ROW]
[ROW][C]42[/C][C]-0.074272[/C][C]-0.7538[/C][C]0.22635[/C][/ROW]
[ROW][C]43[/C][C]-0.019054[/C][C]-0.1934[/C][C]0.423523[/C][/ROW]
[ROW][C]44[/C][C]-0.118404[/C][C]-1.2017[/C][C]0.116124[/C][/ROW]
[ROW][C]45[/C][C]0.060567[/C][C]0.6147[/C][C]0.270058[/C][/ROW]
[ROW][C]46[/C][C]0.074144[/C][C]0.7525[/C][C]0.226738[/C][/ROW]
[ROW][C]47[/C][C]-0.140767[/C][C]-1.4286[/C][C]0.078068[/C][/ROW]
[ROW][C]48[/C][C]-0.083611[/C][C]-0.8486[/C][C]0.199046[/C][/ROW]
[/TABLE]
Source: https://freestatistics.org/blog/index.php?pk=298395&T=2

Globally Unique Identifier (entire table): ba.freestatistics.org/blog/index.php?pk=298395&T=2

As an alternative you can also use a QR Code:  

The GUIDs for individual cells are displayed in the table below:

Partial Autocorrelation Function
Time lag kPACF(k)T-STATP-value
10.4116454.17773.1e-05
2-0.234167-2.37650.009662
30.1480161.50220.068053
40.0044650.04530.481971
50.0201840.20480.419047
6-0.143083-1.45210.074751
7-0.056687-0.57530.283167
80.1870211.89810.030244
90.0013260.01350.494646
10-0.201247-2.04240.021832
11-0.357126-3.62440.000226
12-0.292952-2.97310.001835
130.2369362.40460.008987
14-0.147412-1.49610.068847
150.0734330.74530.228906
16-0.031106-0.31570.376437
170.018890.19170.424172
180.1408321.42930.077974
190.0879880.8930.186974
200.1030391.04570.149067
210.1399531.42040.07926
22-0.075833-0.76960.221642
23-0.133769-1.35760.088778
24-0.065676-0.66650.253279
250.2054162.08470.019783
260.0490770.49810.309747
27-0.047296-0.480.316122
28-0.079-0.80180.212268
290.1173561.1910.118189
300.0582150.59080.277967
310.1292361.31160.096285
320.0394360.40020.344906
33-0.042937-0.43580.331962
340.0169290.17180.43196
350.0419340.42560.33565
36-0.09052-0.91870.180205
370.0040830.04140.483513
380.0035480.0360.485671
39-0.08777-0.89080.187564
40-0.1036-1.05140.147761
410.0467520.47450.31808
42-0.074272-0.75380.22635
43-0.019054-0.19340.423523
44-0.118404-1.20170.116124
450.0605670.61470.270058
460.0741440.75250.226738
47-0.140767-1.42860.078068
48-0.083611-0.84860.199046


Parameters (Session):
par1 = 48 ; par2 = 1 ; par3 = 1 ; par4 = 1 ; par5 = 12 ; par6 = White Noise ; par7 = 0.95 ;
Parameters (R input):
par1 = 48 ; par2 = 1 ; par3 = 1 ; par4 = 1 ; par5 = 12 ; par6 = White Noise ; par7 = 0.95 ; par8 = ;
R code (references can be found in the software module):
if (par1 == 'Default') {
par1 = 10*log10(length(x))
} else {
par1 <- as.numeric(par1)
}
par2 <- as.numeric(par2)
par3 <- as.numeric(par3)
par4 <- as.numeric(par4)
par5 <- as.numeric(par5)
if (par6 == 'White Noise') par6 <- 'white' else par6 <- 'ma'
par7 <- as.numeric(par7)
if (par8 != '') par8 <- as.numeric(par8)
x <- na.omit(x)
ox <- x
if (par8 == '') {
if (par2 == 0) {
x <- log(x)
} else {
x <- (x ^ par2 - 1) / par2
}
} else {
x <- log(x,base=par8)
}
if (par3 > 0) x <- diff(x,lag=1,difference=par3)
if (par4 > 0) x <- diff(x,lag=par5,difference=par4)
bitmap(file='picts.png')
op <- par(mfrow=c(2,1))
plot(ox,type='l',main='Original Time Series',xlab='time',ylab='value')
if (par8=='') {
mytitle <- paste('Working Time Series (lambda=',par2,', d=',par3,', D=',par4,')',sep='')
mysub <- paste('(lambda=',par2,', d=',par3,', D=',par4,', CI=', par7, ', CI type=',par6,')',sep='')
} else {
mytitle <- paste('Working Time Series (base=',par8,', d=',par3,', D=',par4,')',sep='')
mysub <- paste('(base=',par8,', d=',par3,', D=',par4,', CI=', par7, ', CI type=',par6,')',sep='')
}
plot(x,type='l', main=mytitle,xlab='time',ylab='value')
par(op)
dev.off()
bitmap(file='pic1.png')
racf <- acf(x, par1, main='Autocorrelation', xlab='time lag', ylab='ACF', ci.type=par6, ci=par7, sub=mysub)
dev.off()
bitmap(file='pic2.png')
rpacf <- pacf(x,par1,main='Partial Autocorrelation',xlab='lags',ylab='PACF',sub=mysub)
dev.off()
(myacf <- c(racf$acf))
(mypacf <- c(rpacf$acf))
lengthx <- length(x)
sqrtn <- sqrt(lengthx)
load(file='createtable')
a<-table.start()
a<-table.row.start(a)
a<-table.element(a,'Autocorrelation Function',4,TRUE)
a<-table.row.end(a)
a<-table.row.start(a)
a<-table.element(a,'Time lag k',header=TRUE)
a<-table.element(a,'ACF(k)',header=TRUE)
a<-table.element(a,'T-STAT',header=TRUE)
a<-table.element(a,'P-value',header=TRUE)
a<-table.row.end(a)
for (i in 2:(par1+1)) {
a<-table.row.start(a)
a<-table.element(a,i-1,header=TRUE)
a<-table.element(a,round(myacf[i],6))
mytstat <- myacf[i]*sqrtn
a<-table.element(a,round(mytstat,4))
a<-table.element(a,round(1-pt(abs(mytstat),lengthx),6))
a<-table.row.end(a)
}
a<-table.end(a)
table.save(a,file='mytable.tab')
a<-table.start()
a<-table.row.start(a)
a<-table.element(a,'Partial Autocorrelation Function',4,TRUE)
a<-table.row.end(a)
a<-table.row.start(a)
a<-table.element(a,'Time lag k',header=TRUE)
a<-table.element(a,'PACF(k)',header=TRUE)
a<-table.element(a,'T-STAT',header=TRUE)
a<-table.element(a,'P-value',header=TRUE)
a<-table.row.end(a)
for (i in 1:par1) {
a<-table.row.start(a)
a<-table.element(a,i,header=TRUE)
a<-table.element(a,round(mypacf[i],6))
mytstat <- mypacf[i]*sqrtn
a<-table.element(a,round(mytstat,4))
a<-table.element(a,round(1-pt(abs(mytstat),lengthx),6))
a<-table.row.end(a)
}
a<-table.end(a)
table.save(a,file='mytable1.tab')