Free Statistics

of Irreproducible Research!

Author's title

Author*The author of this computation has been verified*
R Software Modulerwasp_pairs.wasp
Title produced by softwareKendall tau Correlation Matrix
Date of computationThu, 08 Dec 2016 21:48:16 +0100
Cite this page as followsStatistical Computations at FreeStatistics.org, Office for Research Development and Education, URL https://freestatistics.org/blog/index.php?v=date/2016/Dec/08/t1481230398dlpz4x8xdu66rw8.htm/, Retrieved Sun, 28 Apr 2024 06:15:18 +0000
Statistical Computations at FreeStatistics.org, Office for Research Development and Education, URL https://freestatistics.org/blog/index.php?pk=298396, Retrieved Sun, 28 Apr 2024 06:15:18 +0000
QR Codes:

Original text written by user:
IsPrivate?No (this computation is public)
User-defined keywords
Estimated Impact62
Family? (F = Feedback message, R = changed R code, M = changed R Module, P = changed Parameters, D = changed Data)
-       [Kendall tau Correlation Matrix] [Kendall Correlation] [2016-12-08 20:48:16] [b2e25925e4919b0d6985405fcb461c0d] [Current]
Feedback Forum

Post a new message
Dataseries X:
4	2	4	3	5	4
5	3	3	4	5	4
4	4	5	4	5	4
3	4	3	3	4	4
4	4	5	4	5	4
3	4	4	4	5	5
3	4	4	3	3	4
3	4	5	4	4	4
4	5	4	4	5	5
4	5	5	4	5	5
4	4	2	4	5	4
4	4	5	3	5	4
4	4	4	3	4	5
3	3	5	4	4	5
4	4	5	4	2	5
3	4	5	4	4	5
3	4	5	4	4	5
NA	NA	5	NA	5	5
5	5	4	3	4	4
4	4	4	4	5	4
3	4	5	3	4	5
4	4	4	4	5	5
4	4	5	4	4	5
4	4	5	4	4	4
4	4	5	4	4	5
3	4	4	4	4	4
3	4	4	3	5	5
4	4	4	4	4	4
2	4	5	4	5	5
5	4	4	4	4	4
4	3	5	4	4	4
4	5	5	4	5	5
5	4	5	4	4	5
4	3	5	4	NA	5
2	3	5	4	5	4
4	5	2	4	4	4
3	4	5	4	4	4
4	3	5	3	4	5
4	3	3	4	4	4
4	4	5	4	4	4
5	4	4	4	4	4
4	5	5	4	5	5
3	3	4	4	4	4
5	5	5	3	5	5
5	4	5	3	4	4
4	4	4	3	4	5
4	4	4	4	4	4
3	5	5	3	3	4
4	4	4	4	5	4
2	3	4	2	NA	4
4	5	5	4	4	4
5	5	2	4	5	4
5	5	5	4	4	4
4	3	5	4	5	5
4	3	4	3	4	5
4	4	5	4	4	4
3	4	4	3	3	4
3	4	4	4	4	3
4	4	4	3	5	4
4	4	4	4	5	4
5	5	3	4	5	5
2	4	4	4	5	5
4	4	4	4	5	5
3	4	4	4	2	4
4	4	5	4	5	5
4	2	4	4	4	4
4	4	4	3	5	3
4	4	4	3	5	4
5	4	5	3	3	5
3	4	4	3	5	5
3	4	4	3	4	5
4	5	5	5	5	4
4	4	3	4	NA	4
4	4	4	4	4	4
4	4	4	5	5	4
3	4	3	4	4	4
4	4	4	4	5	4
3	4	5	3	5	5
3	3	5	4	4	5
4	3	5	4	4	4
4	4	5	4	4	5
3	3	3	4	4	4
4	4	4	4	5	4
4	4	3	4	5	5
4	4	4	4	5	5
5	4	4	4	4	4
5	4	3	5	4	5
4	4	5	4	5	5
3	4	5	4	4	5
3	NA	4	4	4	4
4	2	3	3	4	4
4	4	5	4	4	3
4	4	5	4	4	5
4	4	4	4	5	4
4	5	4	4	5	3
3	4	4	3	5	5
4	4	5	4	4	5
5	4	3	4	4	5
5	4	5	5	4	5
4	5	4	4	5	5
3	4	5	4	4	5
5	3	4	4	5	5
4	4	5	4	4	5
5	4	4	4	4	5
3	4	4	3	NA	4
5	4	4	5	5	5
4	4	5	3	NA	5
4	4	3	3	4	3
4	4	5	4	4	4
4	4	5	4	4	4
3	4	5	4	5	3
4	4	4	4	4	4
4	4	4	3	4	5
3	3	4	3	5	5
4	4	4	3	4	4
3	4	5	4	4	4
4	4	5	4	3	4
5	4	5	1	5	5
5	4	5	4	5	5
4	4	4	4	4	3
4	4	5	3	4	4
3	4	4	3	4	5
4	4	4	4	4	4
4	4	4	4	5	4
4	5	3	4	4	4
3	4	4	4	4	4
4	4	4	3	4	4
4	4	4	4	4	5
3	4	3	3	4	4
4	4	4	3	4	3
3	2	4	2	4	4
4	4	4	3	5	4
5	4	4	3	5	4
2	4	4	3	3	5
3	3	4	4	4	4
4	4	4	3	4	4
5	5	4	4	5	4
NA	NA	2	NA	NA	NA
4	5	5	4	4	4
5	5	5	5	5	4
4	5	5	4	5	5
4	4	4	3	4	5
3	4	5	4	5	4
4	4	5	4	4	4
4	4	2	4	4	4
4	4	3	4	5	5
4	4	4	4	5	5
5	4	5	3	5	4
4	3	5	4	4	4
4	4	5	4	4	4
3	3	2	3	4	4
4	5	5	4	4	3
4	4	4	3	4	4
4	4	4	4	4	5
3	4	5	3	5	5
4	4	5	4	4	5
5	4	5	4	5	4
4	4	5	4	3	4
2	3	5	4	4	4
4	4	4	4	4	5
4	3	4	3	5	5
4	4	4	4	4	3
4	5	5	5	4	4
5	4	3	4	4	4
5	4	4	3	4	4
3	3	1	4	5	5
4	4	4	4	4	5
4	4	4	4	5	4
2	3	4	5	5	4


Summary of computational transaction
Raw Input view raw input (R code)
Raw Outputview raw output of R engine
Computing time1 seconds
R ServerBig Analytics Cloud Computing Center

\begin{tabular}{lllllllll}
\hline
Summary of computational transaction \tabularnewline
Raw Input view raw input (R code)  \tabularnewline
Raw Outputview raw output of R engine  \tabularnewline
Computing time1 seconds \tabularnewline
R ServerBig Analytics Cloud Computing Center \tabularnewline
\hline
\end{tabular}
%Source: https://freestatistics.org/blog/index.php?pk=298396&T=0

[TABLE]
[ROW]
Summary of computational transaction[/C][/ROW] [ROW]Raw Input[/C] view raw input (R code) [/C][/ROW] [ROW]Raw Output[/C]view raw output of R engine [/C][/ROW] [ROW]Computing time[/C]1 seconds[/C][/ROW] [ROW]R Server[/C]Big Analytics Cloud Computing Center[/C][/ROW] [/TABLE] Source: https://freestatistics.org/blog/index.php?pk=298396&T=0

Globally Unique Identifier (entire table): ba.freestatistics.org/blog/index.php?pk=298396&T=0

As an alternative you can also use a QR Code:  

The GUIDs for individual cells are displayed in the table below:

Summary of computational transaction
Raw Input view raw input (R code)
Raw Outputview raw output of R engine
Computing time1 seconds
R ServerBig Analytics Cloud Computing Center


Correlations for all pairs of data series (method=kendall)
ABCDEF
A10.259-0.0250.1180.11-0.019
B0.25910.1150.1360.089-0.016
C-0.0250.11510.128-0.0680.12
D0.1180.1360.12810.088-0.024
E0.110.089-0.0680.08810.14
F-0.019-0.0160.12-0.0240.141

\begin{tabular}{lllllllll}
\hline
Correlations for all pairs of data series (method=kendall) \tabularnewline
  & A & B & C & D & E & F \tabularnewline
A & 1 & 0.259 & -0.025 & 0.118 & 0.11 & -0.019 \tabularnewline
B & 0.259 & 1 & 0.115 & 0.136 & 0.089 & -0.016 \tabularnewline
C & -0.025 & 0.115 & 1 & 0.128 & -0.068 & 0.12 \tabularnewline
D & 0.118 & 0.136 & 0.128 & 1 & 0.088 & -0.024 \tabularnewline
E & 0.11 & 0.089 & -0.068 & 0.088 & 1 & 0.14 \tabularnewline
F & -0.019 & -0.016 & 0.12 & -0.024 & 0.14 & 1 \tabularnewline
\hline
\end{tabular}
%Source: https://freestatistics.org/blog/index.php?pk=298396&T=1

[TABLE]
[ROW][C]Correlations for all pairs of data series (method=kendall)[/C][/ROW]
[ROW][C] [/C][C]A[/C][C]B[/C][C]C[/C][C]D[/C][C]E[/C][C]F[/C][/ROW]
[ROW][C]A[/C][C]1[/C][C]0.259[/C][C]-0.025[/C][C]0.118[/C][C]0.11[/C][C]-0.019[/C][/ROW]
[ROW][C]B[/C][C]0.259[/C][C]1[/C][C]0.115[/C][C]0.136[/C][C]0.089[/C][C]-0.016[/C][/ROW]
[ROW][C]C[/C][C]-0.025[/C][C]0.115[/C][C]1[/C][C]0.128[/C][C]-0.068[/C][C]0.12[/C][/ROW]
[ROW][C]D[/C][C]0.118[/C][C]0.136[/C][C]0.128[/C][C]1[/C][C]0.088[/C][C]-0.024[/C][/ROW]
[ROW][C]E[/C][C]0.11[/C][C]0.089[/C][C]-0.068[/C][C]0.088[/C][C]1[/C][C]0.14[/C][/ROW]
[ROW][C]F[/C][C]-0.019[/C][C]-0.016[/C][C]0.12[/C][C]-0.024[/C][C]0.14[/C][C]1[/C][/ROW]
[/TABLE]
Source: https://freestatistics.org/blog/index.php?pk=298396&T=1

Globally Unique Identifier (entire table): ba.freestatistics.org/blog/index.php?pk=298396&T=1

As an alternative you can also use a QR Code:  

The GUIDs for individual cells are displayed in the table below:

Correlations for all pairs of data series (method=kendall)
ABCDEF
A10.259-0.0250.1180.11-0.019
B0.25910.1150.1360.089-0.016
C-0.0250.11510.128-0.0680.12
D0.1180.1360.12810.088-0.024
E0.110.089-0.0680.08810.14
F-0.019-0.0160.12-0.0240.141


Correlations for all pairs of data series with p-values
pairPearson rSpearman rhoKendall tau
A;B0.26960.28410.2594
p-value(5e-04)(3e-04)(3e-04)
A;C-0.0287-0.0278-0.0251
p-value(0.7174)(0.7266)(0.7244)
A;D0.07930.12540.1184
p-value(0.3176)(0.1128)(0.1044)
A;E0.11240.1180.1103
p-value(0.1558)(0.136)(0.1308)
A;F-0.0194-0.0214-0.0192
p-value(0.8066)(0.7872)(0.7918)
B;C0.12560.1240.1148
p-value(0.1124)(0.1171)(0.113)
B;D0.18060.14430.1356
p-value(0.0219)(0.0678)(0.067)
B;E0.07110.09540.0887
p-value(0.3702)(0.2285)(0.2317)
B;F-0.0098-0.0182-0.0164
p-value(0.9017)(0.8184)(0.825)
C;D0.06630.13770.1276
p-value(0.4037)(0.0814)(0.0825)
C;E-0.0837-0.0741-0.0684
p-value(0.2913)(0.3505)(0.3528)
C;F0.11130.13030.1205
p-value(0.1597)(0.0994)(0.1012)
D;E0.07340.09190.088
p-value(0.3547)(0.2465)(0.2422)
D;F-0.0313-0.0249-0.0236
p-value(0.6933)(0.754)(0.7539)
E;F0.11750.14740.1398
p-value(0.1376)(0.062)(0.0633)

\begin{tabular}{lllllllll}
\hline
Correlations for all pairs of data series with p-values \tabularnewline
pair & Pearson r & Spearman rho & Kendall tau \tabularnewline
A;B & 0.2696 & 0.2841 & 0.2594 \tabularnewline
p-value & (5e-04) & (3e-04) & (3e-04) \tabularnewline
A;C & -0.0287 & -0.0278 & -0.0251 \tabularnewline
p-value & (0.7174) & (0.7266) & (0.7244) \tabularnewline
A;D & 0.0793 & 0.1254 & 0.1184 \tabularnewline
p-value & (0.3176) & (0.1128) & (0.1044) \tabularnewline
A;E & 0.1124 & 0.118 & 0.1103 \tabularnewline
p-value & (0.1558) & (0.136) & (0.1308) \tabularnewline
A;F & -0.0194 & -0.0214 & -0.0192 \tabularnewline
p-value & (0.8066) & (0.7872) & (0.7918) \tabularnewline
B;C & 0.1256 & 0.124 & 0.1148 \tabularnewline
p-value & (0.1124) & (0.1171) & (0.113) \tabularnewline
B;D & 0.1806 & 0.1443 & 0.1356 \tabularnewline
p-value & (0.0219) & (0.0678) & (0.067) \tabularnewline
B;E & 0.0711 & 0.0954 & 0.0887 \tabularnewline
p-value & (0.3702) & (0.2285) & (0.2317) \tabularnewline
B;F & -0.0098 & -0.0182 & -0.0164 \tabularnewline
p-value & (0.9017) & (0.8184) & (0.825) \tabularnewline
C;D & 0.0663 & 0.1377 & 0.1276 \tabularnewline
p-value & (0.4037) & (0.0814) & (0.0825) \tabularnewline
C;E & -0.0837 & -0.0741 & -0.0684 \tabularnewline
p-value & (0.2913) & (0.3505) & (0.3528) \tabularnewline
C;F & 0.1113 & 0.1303 & 0.1205 \tabularnewline
p-value & (0.1597) & (0.0994) & (0.1012) \tabularnewline
D;E & 0.0734 & 0.0919 & 0.088 \tabularnewline
p-value & (0.3547) & (0.2465) & (0.2422) \tabularnewline
D;F & -0.0313 & -0.0249 & -0.0236 \tabularnewline
p-value & (0.6933) & (0.754) & (0.7539) \tabularnewline
E;F & 0.1175 & 0.1474 & 0.1398 \tabularnewline
p-value & (0.1376) & (0.062) & (0.0633) \tabularnewline
\hline
\end{tabular}
%Source: https://freestatistics.org/blog/index.php?pk=298396&T=2

[TABLE]
[ROW][C]Correlations for all pairs of data series with p-values[/C][/ROW]
[ROW][C]pair[/C][C]Pearson r[/C][C]Spearman rho[/C][C]Kendall tau[/C][/ROW]
[ROW][C]A;B[/C][C]0.2696[/C][C]0.2841[/C][C]0.2594[/C][/ROW]
[ROW][C]p-value[/C][C](5e-04)[/C][C](3e-04)[/C][C](3e-04)[/C][/ROW]
[ROW][C]A;C[/C][C]-0.0287[/C][C]-0.0278[/C][C]-0.0251[/C][/ROW]
[ROW][C]p-value[/C][C](0.7174)[/C][C](0.7266)[/C][C](0.7244)[/C][/ROW]
[ROW][C]A;D[/C][C]0.0793[/C][C]0.1254[/C][C]0.1184[/C][/ROW]
[ROW][C]p-value[/C][C](0.3176)[/C][C](0.1128)[/C][C](0.1044)[/C][/ROW]
[ROW][C]A;E[/C][C]0.1124[/C][C]0.118[/C][C]0.1103[/C][/ROW]
[ROW][C]p-value[/C][C](0.1558)[/C][C](0.136)[/C][C](0.1308)[/C][/ROW]
[ROW][C]A;F[/C][C]-0.0194[/C][C]-0.0214[/C][C]-0.0192[/C][/ROW]
[ROW][C]p-value[/C][C](0.8066)[/C][C](0.7872)[/C][C](0.7918)[/C][/ROW]
[ROW][C]B;C[/C][C]0.1256[/C][C]0.124[/C][C]0.1148[/C][/ROW]
[ROW][C]p-value[/C][C](0.1124)[/C][C](0.1171)[/C][C](0.113)[/C][/ROW]
[ROW][C]B;D[/C][C]0.1806[/C][C]0.1443[/C][C]0.1356[/C][/ROW]
[ROW][C]p-value[/C][C](0.0219)[/C][C](0.0678)[/C][C](0.067)[/C][/ROW]
[ROW][C]B;E[/C][C]0.0711[/C][C]0.0954[/C][C]0.0887[/C][/ROW]
[ROW][C]p-value[/C][C](0.3702)[/C][C](0.2285)[/C][C](0.2317)[/C][/ROW]
[ROW][C]B;F[/C][C]-0.0098[/C][C]-0.0182[/C][C]-0.0164[/C][/ROW]
[ROW][C]p-value[/C][C](0.9017)[/C][C](0.8184)[/C][C](0.825)[/C][/ROW]
[ROW][C]C;D[/C][C]0.0663[/C][C]0.1377[/C][C]0.1276[/C][/ROW]
[ROW][C]p-value[/C][C](0.4037)[/C][C](0.0814)[/C][C](0.0825)[/C][/ROW]
[ROW][C]C;E[/C][C]-0.0837[/C][C]-0.0741[/C][C]-0.0684[/C][/ROW]
[ROW][C]p-value[/C][C](0.2913)[/C][C](0.3505)[/C][C](0.3528)[/C][/ROW]
[ROW][C]C;F[/C][C]0.1113[/C][C]0.1303[/C][C]0.1205[/C][/ROW]
[ROW][C]p-value[/C][C](0.1597)[/C][C](0.0994)[/C][C](0.1012)[/C][/ROW]
[ROW][C]D;E[/C][C]0.0734[/C][C]0.0919[/C][C]0.088[/C][/ROW]
[ROW][C]p-value[/C][C](0.3547)[/C][C](0.2465)[/C][C](0.2422)[/C][/ROW]
[ROW][C]D;F[/C][C]-0.0313[/C][C]-0.0249[/C][C]-0.0236[/C][/ROW]
[ROW][C]p-value[/C][C](0.6933)[/C][C](0.754)[/C][C](0.7539)[/C][/ROW]
[ROW][C]E;F[/C][C]0.1175[/C][C]0.1474[/C][C]0.1398[/C][/ROW]
[ROW][C]p-value[/C][C](0.1376)[/C][C](0.062)[/C][C](0.0633)[/C][/ROW]
[/TABLE]
Source: https://freestatistics.org/blog/index.php?pk=298396&T=2

Globally Unique Identifier (entire table): ba.freestatistics.org/blog/index.php?pk=298396&T=2

As an alternative you can also use a QR Code:  

The GUIDs for individual cells are displayed in the table below:

Correlations for all pairs of data series with p-values
pairPearson rSpearman rhoKendall tau
A;B0.26960.28410.2594
p-value(5e-04)(3e-04)(3e-04)
A;C-0.0287-0.0278-0.0251
p-value(0.7174)(0.7266)(0.7244)
A;D0.07930.12540.1184
p-value(0.3176)(0.1128)(0.1044)
A;E0.11240.1180.1103
p-value(0.1558)(0.136)(0.1308)
A;F-0.0194-0.0214-0.0192
p-value(0.8066)(0.7872)(0.7918)
B;C0.12560.1240.1148
p-value(0.1124)(0.1171)(0.113)
B;D0.18060.14430.1356
p-value(0.0219)(0.0678)(0.067)
B;E0.07110.09540.0887
p-value(0.3702)(0.2285)(0.2317)
B;F-0.0098-0.0182-0.0164
p-value(0.9017)(0.8184)(0.825)
C;D0.06630.13770.1276
p-value(0.4037)(0.0814)(0.0825)
C;E-0.0837-0.0741-0.0684
p-value(0.2913)(0.3505)(0.3528)
C;F0.11130.13030.1205
p-value(0.1597)(0.0994)(0.1012)
D;E0.07340.09190.088
p-value(0.3547)(0.2465)(0.2422)
D;F-0.0313-0.0249-0.0236
p-value(0.6933)(0.754)(0.7539)
E;F0.11750.14740.1398
p-value(0.1376)(0.062)(0.0633)


Meta Analysis of Correlation Tests
Number of significant by total number of Correlations
Type I errorPearson rSpearman rhoKendall tau
0.010.070.070.07
0.020.070.070.07
0.030.130.070.07
0.040.130.070.07
0.050.130.070.07
0.060.130.070.07
0.070.130.20.2
0.080.130.20.2
0.090.130.270.27
0.10.130.330.27

\begin{tabular}{lllllllll}
\hline
Meta Analysis of Correlation Tests \tabularnewline
Number of significant by total number of Correlations \tabularnewline
Type I error & Pearson r & Spearman rho & Kendall tau \tabularnewline
0.01 & 0.07 & 0.07 & 0.07 \tabularnewline
0.02 & 0.07 & 0.07 & 0.07 \tabularnewline
0.03 & 0.13 & 0.07 & 0.07 \tabularnewline
0.04 & 0.13 & 0.07 & 0.07 \tabularnewline
0.05 & 0.13 & 0.07 & 0.07 \tabularnewline
0.06 & 0.13 & 0.07 & 0.07 \tabularnewline
0.07 & 0.13 & 0.2 & 0.2 \tabularnewline
0.08 & 0.13 & 0.2 & 0.2 \tabularnewline
0.09 & 0.13 & 0.27 & 0.27 \tabularnewline
0.1 & 0.13 & 0.33 & 0.27 \tabularnewline
\hline
\end{tabular}
%Source: https://freestatistics.org/blog/index.php?pk=298396&T=3

[TABLE]
[ROW][C]Meta Analysis of Correlation Tests[/C][/ROW]
[ROW][C]Number of significant by total number of Correlations[/C][/ROW]
[ROW][C]Type I error[/C][C]Pearson r[/C][C]Spearman rho[/C][C]Kendall tau[/C][/ROW]
[ROW][C]0.01[/C][C]0.07[/C][C]0.07[/C][C]0.07[/C][/ROW]
[ROW][C]0.02[/C][C]0.07[/C][C]0.07[/C][C]0.07[/C][/ROW]
[ROW][C]0.03[/C][C]0.13[/C][C]0.07[/C][C]0.07[/C][/ROW]
[ROW][C]0.04[/C][C]0.13[/C][C]0.07[/C][C]0.07[/C][/ROW]
[ROW][C]0.05[/C][C]0.13[/C][C]0.07[/C][C]0.07[/C][/ROW]
[ROW][C]0.06[/C][C]0.13[/C][C]0.07[/C][C]0.07[/C][/ROW]
[ROW][C]0.07[/C][C]0.13[/C][C]0.2[/C][C]0.2[/C][/ROW]
[ROW][C]0.08[/C][C]0.13[/C][C]0.2[/C][C]0.2[/C][/ROW]
[ROW][C]0.09[/C][C]0.13[/C][C]0.27[/C][C]0.27[/C][/ROW]
[ROW][C]0.1[/C][C]0.13[/C][C]0.33[/C][C]0.27[/C][/ROW]
[/TABLE]
Source: https://freestatistics.org/blog/index.php?pk=298396&T=3

Globally Unique Identifier (entire table): ba.freestatistics.org/blog/index.php?pk=298396&T=3

As an alternative you can also use a QR Code:  

The GUIDs for individual cells are displayed in the table below:

Meta Analysis of Correlation Tests
Number of significant by total number of Correlations
Type I errorPearson rSpearman rhoKendall tau
0.010.070.070.07
0.020.070.070.07
0.030.130.070.07
0.040.130.070.07
0.050.130.070.07
0.060.130.070.07
0.070.130.20.2
0.080.130.20.2
0.090.130.270.27
0.10.130.330.27


Parameters (Session):
par1 = kendall ;
Parameters (R input):
par1 = kendall ;
R code (references can be found in the software module):
par1 <- 'kendall'
panel.tau <- function(x, y, digits=2, prefix='', cex.cor)
{
usr <- par('usr'); on.exit(par(usr))
par(usr = c(0, 1, 0, 1))
rr <- cor.test(x, y, method=par1)
r <- round(rr$p.value,2)
txt <- format(c(r, 0.123456789), digits=digits)[1]
txt <- paste(prefix, txt, sep='')
if(missing(cex.cor)) cex <- 0.5/strwidth(txt)
text(0.5, 0.5, txt, cex = cex)
}
panel.hist <- function(x, ...)
{
usr <- par('usr'); on.exit(par(usr))
par(usr = c(usr[1:2], 0, 1.5) )
h <- hist(x, plot = FALSE)
breaks <- h$breaks; nB <- length(breaks)
y <- h$counts; y <- y/max(y)
rect(breaks[-nB], 0, breaks[-1], y, col='grey', ...)
}
x <- na.omit(x)
y <- t(na.omit(t(y)))
bitmap(file='test1.png')
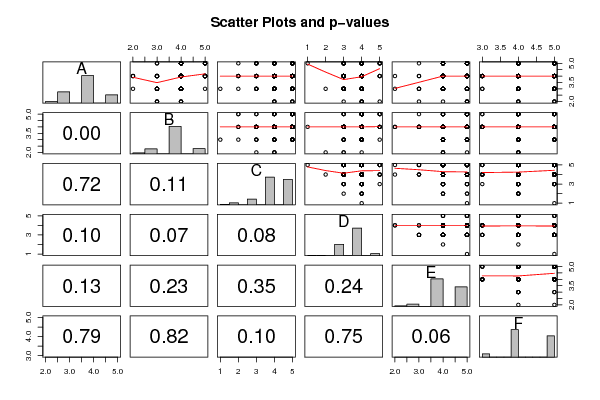
pairs(t(y),diag.panel=panel.hist, upper.panel=panel.smooth, lower.panel=panel.tau, main=main)
dev.off()
load(file='createtable')
n <- length(y[,1])
print(n)
a<-table.start()
a<-table.row.start(a)
a<-table.element(a,paste('Correlations for all pairs of data series (method=',par1,')',sep=''),n+1,TRUE)
a<-table.row.end(a)
a<-table.row.start(a)
a<-table.element(a,' ',header=TRUE)
for (i in 1:n) {
a<-table.element(a,dimnames(t(x))[[2]][i],header=TRUE)
}
a<-table.row.end(a)
for (i in 1:n) {
a<-table.row.start(a)
a<-table.element(a,dimnames(t(x))[[2]][i],header=TRUE)
for (j in 1:n) {
r <- cor.test(y[i,],y[j,],method=par1)
a<-table.element(a,round(r$estimate,3))
}
a<-table.row.end(a)
}
a<-table.end(a)
table.save(a,file='mytable.tab')
ncorrs <- (n*n -n)/2
mycorrs <- array(0, dim=c(10,3))
a<-table.start()
a<-table.row.start(a)
a<-table.element(a,'Correlations for all pairs of data series with p-values',4,TRUE)
a<-table.row.end(a)
a<-table.row.start(a)
a<-table.element(a,'pair',1,TRUE)
a<-table.element(a,'Pearson r',1,TRUE)
a<-table.element(a,'Spearman rho',1,TRUE)
a<-table.element(a,'Kendall tau',1,TRUE)
a<-table.row.end(a)
cor.test(y[1,],y[2,],method=par1)
for (i in 1:(n-1))
{
for (j in (i+1):n)
{
a<-table.row.start(a)
dum <- paste(dimnames(t(x))[[2]][i],';',dimnames(t(x))[[2]][j],sep='')
a<-table.element(a,dum,header=TRUE)
rp <- cor.test(y[i,],y[j,],method='pearson')
a<-table.element(a,round(rp$estimate,4))
rs <- cor.test(y[i,],y[j,],method='spearman')
a<-table.element(a,round(rs$estimate,4))
rk <- cor.test(y[i,],y[j,],method='kendall')
a<-table.element(a,round(rk$estimate,4))
a<-table.row.end(a)
a<-table.row.start(a)
a<-table.element(a,'p-value',header=T)
a<-table.element(a,paste('(',round(rp$p.value,4),')',sep=''))
a<-table.element(a,paste('(',round(rs$p.value,4),')',sep=''))
a<-table.element(a,paste('(',round(rk$p.value,4),')',sep=''))
a<-table.row.end(a)
for (iii in 1:10) {
iiid100 <- iii / 100
if (rp$p.value < iiid100) mycorrs[iii, 1] = mycorrs[iii, 1] + 1
if (rs$p.value < iiid100) mycorrs[iii, 2] = mycorrs[iii, 2] + 1
if (rk$p.value < iiid100) mycorrs[iii, 3] = mycorrs[iii, 3] + 1
}
}
}
a<-table.end(a)
table.save(a,file='mytable1.tab')
a<-table.start()
a<-table.row.start(a)
a<-table.element(a,'Meta Analysis of Correlation Tests',4,TRUE)
a<-table.row.end(a)
a<-table.row.start(a)
a<-table.element(a,'Number of significant by total number of Correlations',4,TRUE)
a<-table.row.end(a)
a<-table.row.start(a)
a<-table.element(a,'Type I error',1,TRUE)
a<-table.element(a,'Pearson r',1,TRUE)
a<-table.element(a,'Spearman rho',1,TRUE)
a<-table.element(a,'Kendall tau',1,TRUE)
a<-table.row.end(a)
for (iii in 1:10) {
iiid100 <- iii / 100
a<-table.row.start(a)
a<-table.element(a,round(iiid100,2),header=T)
a<-table.element(a,round(mycorrs[iii,1]/ncorrs,2))
a<-table.element(a,round(mycorrs[iii,2]/ncorrs,2))
a<-table.element(a,round(mycorrs[iii,3]/ncorrs,2))
a<-table.row.end(a)
}
a<-table.end(a)
table.save(a,file='mytable2.tab')