Free Statistics

of Irreproducible Research!

Author's title

Author*The author of this computation has been verified*
R Software Modulerwasp_univariatedataseries.wasp
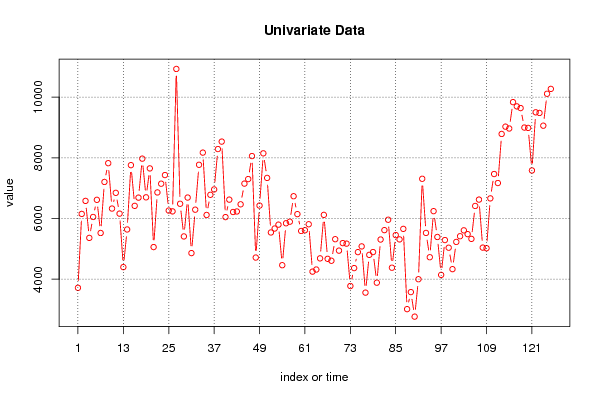
Title produced by softwareUnivariate Data Series
Date of computationThu, 08 Dec 2016 22:17:18 +0100
Cite this page as followsStatistical Computations at FreeStatistics.org, Office for Research Development and Education, URL https://freestatistics.org/blog/index.php?v=date/2016/Dec/08/t1481231906frkvc8gkc7r9t6z.htm/, Retrieved Sat, 27 Apr 2024 19:38:35 +0000
Statistical Computations at FreeStatistics.org, Office for Research Development and Education, URL https://freestatistics.org/blog/index.php?pk=298398, Retrieved Sat, 27 Apr 2024 19:38:35 +0000
QR Codes:

Original text written by user:
IsPrivate?No (this computation is public)
User-defined keywords
Estimated Impact48
Family? (F = Feedback message, R = changed R code, M = changed R Module, P = changed Parameters, D = changed Data)
-       [Univariate Data Series] [Plot dataseries N...] [2016-12-08 21:17:18] [c0b73e623858a81821526bb2f691ccd9] [Current]
Feedback Forum

Post a new message
Dataseries X:
3716
6151
6580
5361
6050
6616
5523
7205
7823
6328
6846
6160
4398
5639
7758
6417
6687
7972
6698
7651
5058
6859
7146
7432
6262
6236
10928
6485
5409
6690
4860
6290
7770
8171
6116
6781
6958
8289
8534
6046
6621
6214
6231
6468
7149
7300
8058
4713
6426
8148
7337
5540
5670
5797
4461
5844
5894
6734
6144
5589
5614
5811
4249
4319
4687
6119
4671
4608
5318
4941
5190
5171
3775
4366
4893
5081
3557
4802
4895
3885
5308
5617
5959
4378
5454
5312
5658
3014
3575
2766
3999
7309
5524
4724
6242
5391
4142
5290
5037
4331
5228
5416
5610
5485
5329
6413
6623
5041
5021
6663
7466
7169
8786
9026
8965
9835
9695
9639
8996
8985
7583
9500
9478
9058
10110
10271


Summary of computational transaction
Raw Input view raw input (R code)
Raw Outputview raw output of R engine
Computing time0 seconds
R ServerBig Analytics Cloud Computing Center

\begin{tabular}{lllllllll}
\hline
Summary of computational transaction \tabularnewline
Raw Input view raw input (R code)  \tabularnewline
Raw Outputview raw output of R engine  \tabularnewline
Computing time0 seconds \tabularnewline
R ServerBig Analytics Cloud Computing Center \tabularnewline
\hline
\end{tabular}
%Source: https://freestatistics.org/blog/index.php?pk=298398&T=0

[TABLE]
[ROW]
Summary of computational transaction[/C][/ROW] [ROW]Raw Input[/C] view raw input (R code) [/C][/ROW] [ROW]Raw Output[/C]view raw output of R engine [/C][/ROW] [ROW]Computing time[/C]0 seconds[/C][/ROW] [ROW]R Server[/C]Big Analytics Cloud Computing Center[/C][/ROW] [/TABLE] Source: https://freestatistics.org/blog/index.php?pk=298398&T=0

Globally Unique Identifier (entire table): ba.freestatistics.org/blog/index.php?pk=298398&T=0

As an alternative you can also use a QR Code:  

The GUIDs for individual cells are displayed in the table below:

Summary of computational transaction
Raw Input view raw input (R code)
Raw Outputview raw output of R engine
Computing time0 seconds
R ServerBig Analytics Cloud Computing Center


Univariate Dataseries
Name of dataseries
Source
Description
Number of observations126

\begin{tabular}{lllllllll}
\hline
Univariate Dataseries \tabularnewline
Name of dataseries &  \tabularnewline
Source &  \tabularnewline
Description &  \tabularnewline
Number of observations & 126 \tabularnewline
\hline
\end{tabular}
%Source: https://freestatistics.org/blog/index.php?pk=298398&T=1

[TABLE]
[ROW][C]Univariate Dataseries[/C][/ROW]
[ROW][C]Name of dataseries[/C][C][/C][/ROW]
[ROW][C]Source[/C][C][/C][/ROW]
[ROW][C]Description[/C][C][/C][/ROW]
[ROW][C]Number of observations[/C][C]126[/C][/ROW]
[/TABLE]
Source: https://freestatistics.org/blog/index.php?pk=298398&T=1

Globally Unique Identifier (entire table): ba.freestatistics.org/blog/index.php?pk=298398&T=1

As an alternative you can also use a QR Code:  

The GUIDs for individual cells are displayed in the table below:

Univariate Dataseries
Name of dataseries
Source
Description
Number of observations126


Summary Statistics of dataseries x
> summary(x)
   Min. 1st Qu.  Median    Mean 3rd Qu.    Max. 
   2766    5176    6118    6259    7164   10930 

\begin{tabular}{lllllllll}
\hline
Summary Statistics of dataseries x \tabularnewline
> summary(x)
   Min. 1st Qu.  Median    Mean 3rd Qu.    Max. 
   2766    5176    6118    6259    7164   10930 
\tabularnewline \hline \end{tabular} %Source: https://freestatistics.org/blog/index.php?pk=298398&T=2

[TABLE]
[ROW][C]Summary Statistics of dataseries x[/C][/ROW]
[ROW][C]
> summary(x)
   Min. 1st Qu.  Median    Mean 3rd Qu.    Max. 
   2766    5176    6118    6259    7164   10930 
[/C][/ROW] [/TABLE] Source: https://freestatistics.org/blog/index.php?pk=298398&T=2

Globally Unique Identifier (entire table): ba.freestatistics.org/blog/index.php?pk=298398&T=2

As an alternative you can also use a QR Code:  

The GUIDs for individual cells are displayed in the table below:

Summary Statistics of dataseries x
> summary(x)
   Min. 1st Qu.  Median    Mean 3rd Qu.    Max. 
   2766    5176    6118    6259    7164   10930 


Parameters (Session):
par4 = 12 ;
Parameters (R input):
par1 = ; par2 = ; par3 = ; par4 = 12 ;
R code (references can be found in the software module):
if (par4 != 'No season') {
par4 <- as.numeric(par4)
if (par4 < 4) par4 <- 12
}
summary(x)
n <- length(x)
bitmap(file='test1.png')
if (par4=='No season') {
plot(x,col=2,type='b',main=main,xlab=xlab,ylab=ylab,xaxt='n')
axis(1,at=seq(1,n,10))
}
if (par4!='No season') {
plot(x,col=2,type='b',main=main,xlab=xlab,ylab=ylab,xaxt='n')
axis(1,at=seq(1,n,par4))
grid(nx=0,ny=NULL,col='black')
abline(v=seq(1,n,par4),col='black',lty='dotted')
}
dev.off()
load(file='createtable')
a<-table.start()
a<-table.row.start(a)
a<-table.element(a,'Univariate Dataseries',2,TRUE)
a<-table.row.end(a)
a<-table.row.start(a)
a<-table.element(a,'Name of dataseries',header=TRUE)
a<-table.element(a,par1)
a<-table.row.end(a)
a<-table.row.start(a)
a<-table.element(a,'Source',header=TRUE)
a<-table.element(a,par2)
a<-table.row.end(a)
a<-table.row.start(a)
a<-table.element(a,'Description',header=TRUE)
a<-table.element(a,par3)
a<-table.row.end(a)
a<-table.row.start(a)
a<-table.element(a,'Number of observations',header=TRUE)
a<-table.element(a,length(x))
a<-table.row.end(a)
a<-table.end(a)
table.save(a,file='mytable.tab')
a<-table.start()
a<-table.row.start(a)
a<-table.element(a,'Summary Statistics of dataseries x',1,TRUE)
a<-table.row.end(a)
a<-table.row.start(a)
a<-table.element(a,paste('
',RC.texteval('summary(x)'),'
',sep=''))
a<-table.row.end(a)
a<-table.end(a)
table.save(a,file='mytable1.tab')