Free Statistics

of Irreproducible Research!

Author's title

Author*The author of this computation has been verified*
R Software Modulerwasp_smp.wasp
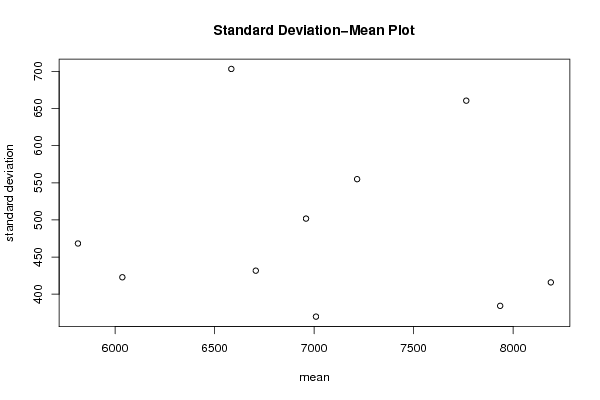
Title produced by softwareStandard Deviation-Mean Plot
Date of computationSat, 10 Dec 2016 11:36:43 +0100
Cite this page as followsStatistical Computations at FreeStatistics.org, Office for Research Development and Education, URL https://freestatistics.org/blog/index.php?v=date/2016/Dec/10/t1481366277wu5jtfg605aap17.htm/, Retrieved Mon, 06 May 2024 07:16:21 +0000
Statistical Computations at FreeStatistics.org, Office for Research Development and Education, URL https://freestatistics.org/blog/index.php?pk=298629, Retrieved Mon, 06 May 2024 07:16:21 +0000
QR Codes:

Original text written by user:
IsPrivate?No (this computation is public)
User-defined keywords
Estimated Impact106
Family? (F = Feedback message, R = changed R code, M = changed R Module, P = changed Parameters, D = changed Data)
F     [Univariate Data Series] [HPC Retail Sales] [2008-03-02 15:42:48] [74be16979710d4c4e7c6647856088456]
- RMPD    [Standard Deviation-Mean Plot] [N1993 Standard de...] [2016-12-10 10:36:43] [1eb03b74c4069f30e782d39ada1a3213] [Current]
Feedback Forum

Post a new message
Dataseries X:
6970
6455
8005
8115
8180
7930
7275
7865
7610
7435
8480
8850
8345
8275
8595
8430
8395
7735
7890
8435
7620
7610
8005
8935
8320
7670
8660
8485
8160
7910
7725
7555
7685
7740
7455
7850
6930
6600
7290
7625
7755
6915
6145
5985
6100
5955
5800
5905
5705
5430
6435
6025
5815
5160
4985
5585
5790
6190
6300
6340
6610
6685
7450
7410
7255
6460
6035
6745
6655
7070
7415
7720
7815
7260
7925
7825
7805
7530
7015
6575
6640
7075
6405
6720
6385
6085
6475
6555
6500
5790
5195
5680
5745
6010
5705
6310
6870
6260
7210
7090
7055
6535
6320
6010
6165
6985
6760
7220
6995
6475
7225
7325
7515
6925
7165
6895
6400
6685
6955
7550
7645
6710
7470
7355
7525
7165


Summary of computational transaction
Raw Input view raw input (R code)
Raw Outputview raw output of R engine
Computing time1 seconds
R ServerBig Analytics Cloud Computing Center

\begin{tabular}{lllllllll}
\hline
Summary of computational transaction \tabularnewline
Raw Input view raw input (R code)  \tabularnewline
Raw Outputview raw output of R engine  \tabularnewline
Computing time1 seconds \tabularnewline
R ServerBig Analytics Cloud Computing Center \tabularnewline
\hline
\end{tabular}
%Source: https://freestatistics.org/blog/index.php?pk=298629&T=0

[TABLE]
[ROW]
Summary of computational transaction[/C][/ROW] [ROW]Raw Input[/C] view raw input (R code) [/C][/ROW] [ROW]Raw Output[/C]view raw output of R engine [/C][/ROW] [ROW]Computing time[/C]1 seconds[/C][/ROW] [ROW]R Server[/C]Big Analytics Cloud Computing Center[/C][/ROW] [/TABLE] Source: https://freestatistics.org/blog/index.php?pk=298629&T=0

Globally Unique Identifier (entire table): ba.freestatistics.org/blog/index.php?pk=298629&T=0

As an alternative you can also use a QR Code:  

The GUIDs for individual cells are displayed in the table below:

Summary of computational transaction
Raw Input view raw input (R code)
Raw Outputview raw output of R engine
Computing time1 seconds
R ServerBig Analytics Cloud Computing Center


Standard Deviation-Mean Plot
SectionMeanStandard DeviationRange
17764.16666666667660.5191943165662395
28189.16666666667415.8771307475181325
37934.58333333333384.2907181556771205
46583.75703.2396623678681955
55813.33333333333468.2381548923261450
66959.16666666667501.7552524222671685
77215.83333333333554.8539256307721520
86036.25422.772908093911360
96706.66666666667431.6318577283891210
107009.16666666667369.7347534095061150

\begin{tabular}{lllllllll}
\hline
Standard Deviation-Mean Plot \tabularnewline
Section & Mean & Standard Deviation & Range \tabularnewline
1 & 7764.16666666667 & 660.519194316566 & 2395 \tabularnewline
2 & 8189.16666666667 & 415.877130747518 & 1325 \tabularnewline
3 & 7934.58333333333 & 384.290718155677 & 1205 \tabularnewline
4 & 6583.75 & 703.239662367868 & 1955 \tabularnewline
5 & 5813.33333333333 & 468.238154892326 & 1450 \tabularnewline
6 & 6959.16666666667 & 501.755252422267 & 1685 \tabularnewline
7 & 7215.83333333333 & 554.853925630772 & 1520 \tabularnewline
8 & 6036.25 & 422.77290809391 & 1360 \tabularnewline
9 & 6706.66666666667 & 431.631857728389 & 1210 \tabularnewline
10 & 7009.16666666667 & 369.734753409506 & 1150 \tabularnewline
\hline
\end{tabular}
%Source: https://freestatistics.org/blog/index.php?pk=298629&T=1

[TABLE]
[ROW][C]Standard Deviation-Mean Plot[/C][/ROW]
[ROW][C]Section[/C][C]Mean[/C][C]Standard Deviation[/C][C]Range[/C][/ROW]
[ROW][C]1[/C][C]7764.16666666667[/C][C]660.519194316566[/C][C]2395[/C][/ROW]
[ROW][C]2[/C][C]8189.16666666667[/C][C]415.877130747518[/C][C]1325[/C][/ROW]
[ROW][C]3[/C][C]7934.58333333333[/C][C]384.290718155677[/C][C]1205[/C][/ROW]
[ROW][C]4[/C][C]6583.75[/C][C]703.239662367868[/C][C]1955[/C][/ROW]
[ROW][C]5[/C][C]5813.33333333333[/C][C]468.238154892326[/C][C]1450[/C][/ROW]
[ROW][C]6[/C][C]6959.16666666667[/C][C]501.755252422267[/C][C]1685[/C][/ROW]
[ROW][C]7[/C][C]7215.83333333333[/C][C]554.853925630772[/C][C]1520[/C][/ROW]
[ROW][C]8[/C][C]6036.25[/C][C]422.77290809391[/C][C]1360[/C][/ROW]
[ROW][C]9[/C][C]6706.66666666667[/C][C]431.631857728389[/C][C]1210[/C][/ROW]
[ROW][C]10[/C][C]7009.16666666667[/C][C]369.734753409506[/C][C]1150[/C][/ROW]
[/TABLE]
Source: https://freestatistics.org/blog/index.php?pk=298629&T=1

Globally Unique Identifier (entire table): ba.freestatistics.org/blog/index.php?pk=298629&T=1

As an alternative you can also use a QR Code:  

The GUIDs for individual cells are displayed in the table below:

Standard Deviation-Mean Plot
SectionMeanStandard DeviationRange
17764.16666666667660.5191943165662395
28189.16666666667415.8771307475181325
37934.58333333333384.2907181556771205
46583.75703.2396623678681955
55813.33333333333468.2381548923261450
66959.16666666667501.7552524222671685
77215.83333333333554.8539256307721520
86036.25422.772908093911360
96706.66666666667431.6318577283891210
107009.16666666667369.7347534095061150


Regression: S.E.(k) = alpha + beta * Mean(k)
alpha523.797946696036
beta-0.00462977159718086
S.D.0.0517949544098676
T-STAT-0.0893865367762315
p-value0.930972023903439

\begin{tabular}{lllllllll}
\hline
Regression: S.E.(k) = alpha + beta * Mean(k) \tabularnewline
alpha & 523.797946696036 \tabularnewline
beta & -0.00462977159718086 \tabularnewline
S.D. & 0.0517949544098676 \tabularnewline
T-STAT & -0.0893865367762315 \tabularnewline
p-value & 0.930972023903439 \tabularnewline
\hline
\end{tabular}
%Source: https://freestatistics.org/blog/index.php?pk=298629&T=2

[TABLE]
[ROW][C]Regression: S.E.(k) = alpha + beta * Mean(k)[/C][/ROW]
[ROW][C]alpha[/C][C]523.797946696036[/C][/ROW]
[ROW][C]beta[/C][C]-0.00462977159718086[/C][/ROW]
[ROW][C]S.D.[/C][C]0.0517949544098676[/C][/ROW]
[ROW][C]T-STAT[/C][C]-0.0893865367762315[/C][/ROW]
[ROW][C]p-value[/C][C]0.930972023903439[/C][/ROW]
[/TABLE]
Source: https://freestatistics.org/blog/index.php?pk=298629&T=2

Globally Unique Identifier (entire table): ba.freestatistics.org/blog/index.php?pk=298629&T=2

As an alternative you can also use a QR Code:  

The GUIDs for individual cells are displayed in the table below:

Regression: S.E.(k) = alpha + beta * Mean(k)
alpha523.797946696036
beta-0.00462977159718086
S.D.0.0517949544098676
T-STAT-0.0893865367762315
p-value0.930972023903439


Regression: ln S.E.(k) = alpha + beta * ln Mean(k)
alpha6.86786061190629
beta-0.0783536307142671
S.D.0.691619875271362
T-STAT-0.113290021752953
p-value0.912592015007077
Lambda1.07835363071427

\begin{tabular}{lllllllll}
\hline
Regression: ln S.E.(k) = alpha + beta * ln Mean(k) \tabularnewline
alpha & 6.86786061190629 \tabularnewline
beta & -0.0783536307142671 \tabularnewline
S.D. & 0.691619875271362 \tabularnewline
T-STAT & -0.113290021752953 \tabularnewline
p-value & 0.912592015007077 \tabularnewline
Lambda & 1.07835363071427 \tabularnewline
\hline
\end{tabular}
%Source: https://freestatistics.org/blog/index.php?pk=298629&T=3

[TABLE]
[ROW][C]Regression: ln S.E.(k) = alpha + beta * ln Mean(k)[/C][/ROW]
[ROW][C]alpha[/C][C]6.86786061190629[/C][/ROW]
[ROW][C]beta[/C][C]-0.0783536307142671[/C][/ROW]
[ROW][C]S.D.[/C][C]0.691619875271362[/C][/ROW]
[ROW][C]T-STAT[/C][C]-0.113290021752953[/C][/ROW]
[ROW][C]p-value[/C][C]0.912592015007077[/C][/ROW]
[ROW][C]Lambda[/C][C]1.07835363071427[/C][/ROW]
[/TABLE]
Source: https://freestatistics.org/blog/index.php?pk=298629&T=3

Globally Unique Identifier (entire table): ba.freestatistics.org/blog/index.php?pk=298629&T=3

As an alternative you can also use a QR Code:  

The GUIDs for individual cells are displayed in the table below:

Regression: ln S.E.(k) = alpha + beta * ln Mean(k)
alpha6.86786061190629
beta-0.0783536307142671
S.D.0.691619875271362
T-STAT-0.113290021752953
p-value0.912592015007077
Lambda1.07835363071427


Parameters (Session):
par1 = 12 ;
Parameters (R input):
par1 = 12 ;
R code (references can be found in the software module):
par1 <- as.numeric(par1)
(n <- length(x))
(np <- floor(n / par1))
arr <- array(NA,dim=c(par1,np))
j <- 0
k <- 1
for (i in 1:(np*par1))
{
j = j + 1
arr[j,k] <- x[i]
if (j == par1) {
j = 0
k=k+1
}
}
arr
arr.mean <- array(NA,dim=np)
arr.sd <- array(NA,dim=np)
arr.range <- array(NA,dim=np)
for (j in 1:np)
{
arr.mean[j] <- mean(arr[,j],na.rm=TRUE)
arr.sd[j] <- sd(arr[,j],na.rm=TRUE)
arr.range[j] <- max(arr[,j],na.rm=TRUE) - min(arr[,j],na.rm=TRUE)
}
arr.mean
arr.sd
arr.range
(lm1 <- lm(arr.sd~arr.mean))
(lnlm1 <- lm(log(arr.sd)~log(arr.mean)))
(lm2 <- lm(arr.range~arr.mean))
bitmap(file='test1.png')
plot(arr.mean,arr.sd,main='Standard Deviation-Mean Plot',xlab='mean',ylab='standard deviation')
dev.off()
bitmap(file='test2.png')
plot(arr.mean,arr.range,main='Range-Mean Plot',xlab='mean',ylab='range')
dev.off()
load(file='createtable')
a<-table.start()
a<-table.row.start(a)
a<-table.element(a,'Standard Deviation-Mean Plot',4,TRUE)
a<-table.row.end(a)
a<-table.row.start(a)
a<-table.element(a,'Section',header=TRUE)
a<-table.element(a,'Mean',header=TRUE)
a<-table.element(a,'Standard Deviation',header=TRUE)
a<-table.element(a,'Range',header=TRUE)
a<-table.row.end(a)
for (j in 1:np) {
a<-table.row.start(a)
a<-table.element(a,j,header=TRUE)
a<-table.element(a,arr.mean[j])
a<-table.element(a,arr.sd[j] )
a<-table.element(a,arr.range[j] )
a<-table.row.end(a)
}
a<-table.end(a)
table.save(a,file='mytable.tab')
a<-table.start()
a<-table.row.start(a)
a<-table.element(a,'Regression: S.E.(k) = alpha + beta * Mean(k)',2,TRUE)
a<-table.row.end(a)
a<-table.row.start(a)
a<-table.element(a,'alpha',header=TRUE)
a<-table.element(a,lm1$coefficients[[1]])
a<-table.row.end(a)
a<-table.row.start(a)
a<-table.element(a,'beta',header=TRUE)
a<-table.element(a,lm1$coefficients[[2]])
a<-table.row.end(a)
a<-table.row.start(a)
a<-table.element(a,'S.D.',header=TRUE)
a<-table.element(a,summary(lm1)$coefficients[2,2])
a<-table.row.end(a)
a<-table.row.start(a)
a<-table.element(a,'T-STAT',header=TRUE)
a<-table.element(a,summary(lm1)$coefficients[2,3])
a<-table.row.end(a)
a<-table.row.start(a)
a<-table.element(a,'p-value',header=TRUE)
a<-table.element(a,summary(lm1)$coefficients[2,4])
a<-table.row.end(a)
a<-table.end(a)
table.save(a,file='mytable1.tab')
a<-table.start()
a<-table.row.start(a)
a<-table.element(a,'Regression: ln S.E.(k) = alpha + beta * ln Mean(k)',2,TRUE)
a<-table.row.end(a)
a<-table.row.start(a)
a<-table.element(a,'alpha',header=TRUE)
a<-table.element(a,lnlm1$coefficients[[1]])
a<-table.row.end(a)
a<-table.row.start(a)
a<-table.element(a,'beta',header=TRUE)
a<-table.element(a,lnlm1$coefficients[[2]])
a<-table.row.end(a)
a<-table.row.start(a)
a<-table.element(a,'S.D.',header=TRUE)
a<-table.element(a,summary(lnlm1)$coefficients[2,2])
a<-table.row.end(a)
a<-table.row.start(a)
a<-table.element(a,'T-STAT',header=TRUE)
a<-table.element(a,summary(lnlm1)$coefficients[2,3])
a<-table.row.end(a)
a<-table.row.start(a)
a<-table.element(a,'p-value',header=TRUE)
a<-table.element(a,summary(lnlm1)$coefficients[2,4])
a<-table.row.end(a)
a<-table.row.start(a)
a<-table.element(a,'Lambda',header=TRUE)
a<-table.element(a,1-lnlm1$coefficients[[2]])
a<-table.row.end(a)
a<-table.end(a)
table.save(a,file='mytable2.tab')