Free Statistics

of Irreproducible Research!

Author's title

Author*The author of this computation has been verified*
R Software Modulerwasp_autocorrelation.wasp
Title produced by software(Partial) Autocorrelation Function
Date of computationSat, 10 Dec 2016 11:52:10 +0100
Cite this page as followsStatistical Computations at FreeStatistics.org, Office for Research Development and Education, URL https://freestatistics.org/blog/index.php?v=date/2016/Dec/10/t148136714537jdqf4wyfrews1.htm/, Retrieved Mon, 06 May 2024 05:24:41 +0000
Statistical Computations at FreeStatistics.org, Office for Research Development and Education, URL https://freestatistics.org/blog/index.php?pk=298634, Retrieved Mon, 06 May 2024 05:24:41 +0000
QR Codes:

Original text written by user:
IsPrivate?No (this computation is public)
User-defined keywords
Estimated Impact86
Family? (F = Feedback message, R = changed R code, M = changed R Module, P = changed Parameters, D = changed Data)
-       [(Partial) Autocorrelation Function] [partial autocorre...] [2016-12-10 10:52:10] [4d72a1efe36cb2a85639504d1000816e] [Current]
Feedback Forum

Post a new message
Dataseries X:
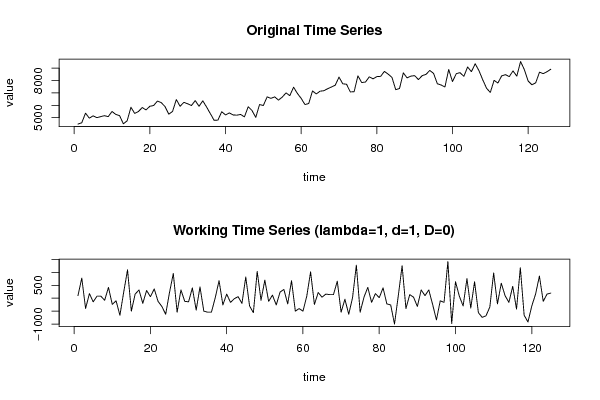
4480
4580
5360
4960
5140
5000
5080
5160
5080
5500
5260
5160
4500
4740
5840
5340
5500
5820
5620
5920
5980
6340
6220
5900
5280
5500
6460
5920
6240
6120
5980
6380
5920
6360
5860
5320
4780
4800
5480
5220
5380
5220
5200
5260
5060
5880
5580
5020
6060
5980
6680
6560
6680
6420
6660
7000
6780
7460
6960
6560
6060
6140
7160
6920
7140
7180
7340
7480
7620
8280
7740
7700
7080
7100
8380
7840
7880
8300
8140
8320
8340
8740
8520
8260
7260
7360
8620
8220
8360
8400
8080
8400
8500
8820
8580
7740
7640
7480
8900
7920
8560
8640
8340
9100
8720
9360
8800
8060
7380
7040
8020
7800
8380
8480
8320
8780
8360
9540
8880
7960
7660
7820
8680
8560
8720
8920


Summary of computational transaction
Raw Input view raw input (R code)
Raw Outputview raw output of R engine
Computing time1 seconds
R ServerBig Analytics Cloud Computing Center

\begin{tabular}{lllllllll}
\hline
Summary of computational transaction \tabularnewline
Raw Input view raw input (R code)  \tabularnewline
Raw Outputview raw output of R engine  \tabularnewline
Computing time1 seconds \tabularnewline
R ServerBig Analytics Cloud Computing Center \tabularnewline
\hline
\end{tabular}
%Source: https://freestatistics.org/blog/index.php?pk=298634&T=0

[TABLE]
[ROW]
Summary of computational transaction[/C][/ROW] [ROW]Raw Input[/C] view raw input (R code) [/C][/ROW] [ROW]Raw Output[/C]view raw output of R engine [/C][/ROW] [ROW]Computing time[/C]1 seconds[/C][/ROW] [ROW]R Server[/C]Big Analytics Cloud Computing Center[/C][/ROW] [/TABLE] Source: https://freestatistics.org/blog/index.php?pk=298634&T=0

Globally Unique Identifier (entire table): ba.freestatistics.org/blog/index.php?pk=298634&T=0

As an alternative you can also use a QR Code:  

The GUIDs for individual cells are displayed in the table below:

Summary of computational transaction
Raw Input view raw input (R code)
Raw Outputview raw output of R engine
Computing time1 seconds
R ServerBig Analytics Cloud Computing Center


Autocorrelation Function
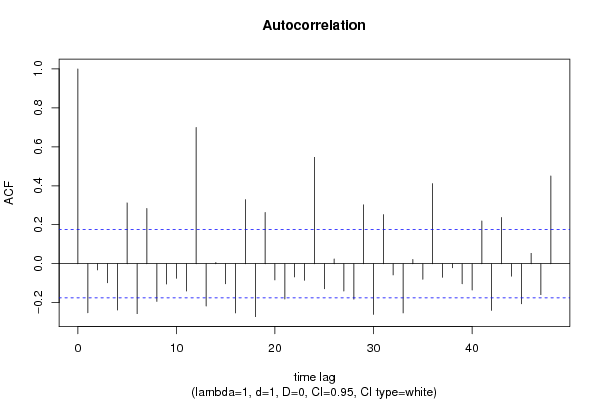
Time lag kACF(k)T-STATP-value
1-0.252176-2.81940.002798
2-0.032019-0.3580.360481
3-0.097565-1.09080.138728
4-0.237728-2.65790.004445
50.3121543.490.000334
6-0.256697-2.870.002411
70.2837283.17220.000952
8-0.1938-2.16680.016075
9-0.104069-1.16350.123417
10-0.075212-0.84090.201006
11-0.140157-1.5670.059821
120.6995157.82080
13-0.217647-2.43340.008187
140.0060610.06780.47304
15-0.103507-1.15720.124689
16-0.252743-2.82570.002747
170.3290953.67940.000173
18-0.271994-3.0410.001437
190.2630372.94080.001951
20-0.083099-0.92910.177321
21-0.181486-2.02910.022287
22-0.067887-0.7590.22464
23-0.084742-0.94740.17262
240.5460656.10520
25-0.12918-1.44430.075582
260.0237880.2660.395355
27-0.140533-1.57120.059332
28-0.182235-2.03750.021858
290.3022123.37880.000486
30-0.260267-2.90990.002141
310.2520252.81770.002812
32-0.05742-0.6420.261032
33-0.252805-2.82640.002741
340.0215310.24070.40508
35-0.079943-0.89380.186577
360.4111864.59725e-06
37-0.070138-0.78420.217212
38-0.021251-0.23760.406294
39-0.103184-1.15360.125426
40-0.135567-1.51570.066062
410.219322.45210.007792
42-0.239991-2.68320.00414
430.2370952.65080.004535
44-0.064109-0.71680.237428
45-0.20556-2.29820.011605
460.0529760.59230.277364
47-0.158794-1.77540.039135
480.4506475.03841e-06

\begin{tabular}{lllllllll}
\hline
Autocorrelation Function \tabularnewline
Time lag k & ACF(k) & T-STAT & P-value \tabularnewline
1 & -0.252176 & -2.8194 & 0.002798 \tabularnewline
2 & -0.032019 & -0.358 & 0.360481 \tabularnewline
3 & -0.097565 & -1.0908 & 0.138728 \tabularnewline
4 & -0.237728 & -2.6579 & 0.004445 \tabularnewline
5 & 0.312154 & 3.49 & 0.000334 \tabularnewline
6 & -0.256697 & -2.87 & 0.002411 \tabularnewline
7 & 0.283728 & 3.1722 & 0.000952 \tabularnewline
8 & -0.1938 & -2.1668 & 0.016075 \tabularnewline
9 & -0.104069 & -1.1635 & 0.123417 \tabularnewline
10 & -0.075212 & -0.8409 & 0.201006 \tabularnewline
11 & -0.140157 & -1.567 & 0.059821 \tabularnewline
12 & 0.699515 & 7.8208 & 0 \tabularnewline
13 & -0.217647 & -2.4334 & 0.008187 \tabularnewline
14 & 0.006061 & 0.0678 & 0.47304 \tabularnewline
15 & -0.103507 & -1.1572 & 0.124689 \tabularnewline
16 & -0.252743 & -2.8257 & 0.002747 \tabularnewline
17 & 0.329095 & 3.6794 & 0.000173 \tabularnewline
18 & -0.271994 & -3.041 & 0.001437 \tabularnewline
19 & 0.263037 & 2.9408 & 0.001951 \tabularnewline
20 & -0.083099 & -0.9291 & 0.177321 \tabularnewline
21 & -0.181486 & -2.0291 & 0.022287 \tabularnewline
22 & -0.067887 & -0.759 & 0.22464 \tabularnewline
23 & -0.084742 & -0.9474 & 0.17262 \tabularnewline
24 & 0.546065 & 6.1052 & 0 \tabularnewline
25 & -0.12918 & -1.4443 & 0.075582 \tabularnewline
26 & 0.023788 & 0.266 & 0.395355 \tabularnewline
27 & -0.140533 & -1.5712 & 0.059332 \tabularnewline
28 & -0.182235 & -2.0375 & 0.021858 \tabularnewline
29 & 0.302212 & 3.3788 & 0.000486 \tabularnewline
30 & -0.260267 & -2.9099 & 0.002141 \tabularnewline
31 & 0.252025 & 2.8177 & 0.002812 \tabularnewline
32 & -0.05742 & -0.642 & 0.261032 \tabularnewline
33 & -0.252805 & -2.8264 & 0.002741 \tabularnewline
34 & 0.021531 & 0.2407 & 0.40508 \tabularnewline
35 & -0.079943 & -0.8938 & 0.186577 \tabularnewline
36 & 0.411186 & 4.5972 & 5e-06 \tabularnewline
37 & -0.070138 & -0.7842 & 0.217212 \tabularnewline
38 & -0.021251 & -0.2376 & 0.406294 \tabularnewline
39 & -0.103184 & -1.1536 & 0.125426 \tabularnewline
40 & -0.135567 & -1.5157 & 0.066062 \tabularnewline
41 & 0.21932 & 2.4521 & 0.007792 \tabularnewline
42 & -0.239991 & -2.6832 & 0.00414 \tabularnewline
43 & 0.237095 & 2.6508 & 0.004535 \tabularnewline
44 & -0.064109 & -0.7168 & 0.237428 \tabularnewline
45 & -0.20556 & -2.2982 & 0.011605 \tabularnewline
46 & 0.052976 & 0.5923 & 0.277364 \tabularnewline
47 & -0.158794 & -1.7754 & 0.039135 \tabularnewline
48 & 0.450647 & 5.0384 & 1e-06 \tabularnewline
\hline
\end{tabular}
%Source: https://freestatistics.org/blog/index.php?pk=298634&T=1

[TABLE]
[ROW][C]Autocorrelation Function[/C][/ROW]
[ROW][C]Time lag k[/C][C]ACF(k)[/C][C]T-STAT[/C][C]P-value[/C][/ROW]
[ROW][C]1[/C][C]-0.252176[/C][C]-2.8194[/C][C]0.002798[/C][/ROW]
[ROW][C]2[/C][C]-0.032019[/C][C]-0.358[/C][C]0.360481[/C][/ROW]
[ROW][C]3[/C][C]-0.097565[/C][C]-1.0908[/C][C]0.138728[/C][/ROW]
[ROW][C]4[/C][C]-0.237728[/C][C]-2.6579[/C][C]0.004445[/C][/ROW]
[ROW][C]5[/C][C]0.312154[/C][C]3.49[/C][C]0.000334[/C][/ROW]
[ROW][C]6[/C][C]-0.256697[/C][C]-2.87[/C][C]0.002411[/C][/ROW]
[ROW][C]7[/C][C]0.283728[/C][C]3.1722[/C][C]0.000952[/C][/ROW]
[ROW][C]8[/C][C]-0.1938[/C][C]-2.1668[/C][C]0.016075[/C][/ROW]
[ROW][C]9[/C][C]-0.104069[/C][C]-1.1635[/C][C]0.123417[/C][/ROW]
[ROW][C]10[/C][C]-0.075212[/C][C]-0.8409[/C][C]0.201006[/C][/ROW]
[ROW][C]11[/C][C]-0.140157[/C][C]-1.567[/C][C]0.059821[/C][/ROW]
[ROW][C]12[/C][C]0.699515[/C][C]7.8208[/C][C]0[/C][/ROW]
[ROW][C]13[/C][C]-0.217647[/C][C]-2.4334[/C][C]0.008187[/C][/ROW]
[ROW][C]14[/C][C]0.006061[/C][C]0.0678[/C][C]0.47304[/C][/ROW]
[ROW][C]15[/C][C]-0.103507[/C][C]-1.1572[/C][C]0.124689[/C][/ROW]
[ROW][C]16[/C][C]-0.252743[/C][C]-2.8257[/C][C]0.002747[/C][/ROW]
[ROW][C]17[/C][C]0.329095[/C][C]3.6794[/C][C]0.000173[/C][/ROW]
[ROW][C]18[/C][C]-0.271994[/C][C]-3.041[/C][C]0.001437[/C][/ROW]
[ROW][C]19[/C][C]0.263037[/C][C]2.9408[/C][C]0.001951[/C][/ROW]
[ROW][C]20[/C][C]-0.083099[/C][C]-0.9291[/C][C]0.177321[/C][/ROW]
[ROW][C]21[/C][C]-0.181486[/C][C]-2.0291[/C][C]0.022287[/C][/ROW]
[ROW][C]22[/C][C]-0.067887[/C][C]-0.759[/C][C]0.22464[/C][/ROW]
[ROW][C]23[/C][C]-0.084742[/C][C]-0.9474[/C][C]0.17262[/C][/ROW]
[ROW][C]24[/C][C]0.546065[/C][C]6.1052[/C][C]0[/C][/ROW]
[ROW][C]25[/C][C]-0.12918[/C][C]-1.4443[/C][C]0.075582[/C][/ROW]
[ROW][C]26[/C][C]0.023788[/C][C]0.266[/C][C]0.395355[/C][/ROW]
[ROW][C]27[/C][C]-0.140533[/C][C]-1.5712[/C][C]0.059332[/C][/ROW]
[ROW][C]28[/C][C]-0.182235[/C][C]-2.0375[/C][C]0.021858[/C][/ROW]
[ROW][C]29[/C][C]0.302212[/C][C]3.3788[/C][C]0.000486[/C][/ROW]
[ROW][C]30[/C][C]-0.260267[/C][C]-2.9099[/C][C]0.002141[/C][/ROW]
[ROW][C]31[/C][C]0.252025[/C][C]2.8177[/C][C]0.002812[/C][/ROW]
[ROW][C]32[/C][C]-0.05742[/C][C]-0.642[/C][C]0.261032[/C][/ROW]
[ROW][C]33[/C][C]-0.252805[/C][C]-2.8264[/C][C]0.002741[/C][/ROW]
[ROW][C]34[/C][C]0.021531[/C][C]0.2407[/C][C]0.40508[/C][/ROW]
[ROW][C]35[/C][C]-0.079943[/C][C]-0.8938[/C][C]0.186577[/C][/ROW]
[ROW][C]36[/C][C]0.411186[/C][C]4.5972[/C][C]5e-06[/C][/ROW]
[ROW][C]37[/C][C]-0.070138[/C][C]-0.7842[/C][C]0.217212[/C][/ROW]
[ROW][C]38[/C][C]-0.021251[/C][C]-0.2376[/C][C]0.406294[/C][/ROW]
[ROW][C]39[/C][C]-0.103184[/C][C]-1.1536[/C][C]0.125426[/C][/ROW]
[ROW][C]40[/C][C]-0.135567[/C][C]-1.5157[/C][C]0.066062[/C][/ROW]
[ROW][C]41[/C][C]0.21932[/C][C]2.4521[/C][C]0.007792[/C][/ROW]
[ROW][C]42[/C][C]-0.239991[/C][C]-2.6832[/C][C]0.00414[/C][/ROW]
[ROW][C]43[/C][C]0.237095[/C][C]2.6508[/C][C]0.004535[/C][/ROW]
[ROW][C]44[/C][C]-0.064109[/C][C]-0.7168[/C][C]0.237428[/C][/ROW]
[ROW][C]45[/C][C]-0.20556[/C][C]-2.2982[/C][C]0.011605[/C][/ROW]
[ROW][C]46[/C][C]0.052976[/C][C]0.5923[/C][C]0.277364[/C][/ROW]
[ROW][C]47[/C][C]-0.158794[/C][C]-1.7754[/C][C]0.039135[/C][/ROW]
[ROW][C]48[/C][C]0.450647[/C][C]5.0384[/C][C]1e-06[/C][/ROW]
[/TABLE]
Source: https://freestatistics.org/blog/index.php?pk=298634&T=1

Globally Unique Identifier (entire table): ba.freestatistics.org/blog/index.php?pk=298634&T=1

As an alternative you can also use a QR Code:  

The GUIDs for individual cells are displayed in the table below:

Autocorrelation Function
Time lag kACF(k)T-STATP-value
1-0.252176-2.81940.002798
2-0.032019-0.3580.360481
3-0.097565-1.09080.138728
4-0.237728-2.65790.004445
50.3121543.490.000334
6-0.256697-2.870.002411
70.2837283.17220.000952
8-0.1938-2.16680.016075
9-0.104069-1.16350.123417
10-0.075212-0.84090.201006
11-0.140157-1.5670.059821
120.6995157.82080
13-0.217647-2.43340.008187
140.0060610.06780.47304
15-0.103507-1.15720.124689
16-0.252743-2.82570.002747
170.3290953.67940.000173
18-0.271994-3.0410.001437
190.2630372.94080.001951
20-0.083099-0.92910.177321
21-0.181486-2.02910.022287
22-0.067887-0.7590.22464
23-0.084742-0.94740.17262
240.5460656.10520
25-0.12918-1.44430.075582
260.0237880.2660.395355
27-0.140533-1.57120.059332
28-0.182235-2.03750.021858
290.3022123.37880.000486
30-0.260267-2.90990.002141
310.2520252.81770.002812
32-0.05742-0.6420.261032
33-0.252805-2.82640.002741
340.0215310.24070.40508
35-0.079943-0.89380.186577
360.4111864.59725e-06
37-0.070138-0.78420.217212
38-0.021251-0.23760.406294
39-0.103184-1.15360.125426
40-0.135567-1.51570.066062
410.219322.45210.007792
42-0.239991-2.68320.00414
430.2370952.65080.004535
44-0.064109-0.71680.237428
45-0.20556-2.29820.011605
460.0529760.59230.277364
47-0.158794-1.77540.039135
480.4506475.03841e-06


Partial Autocorrelation Function
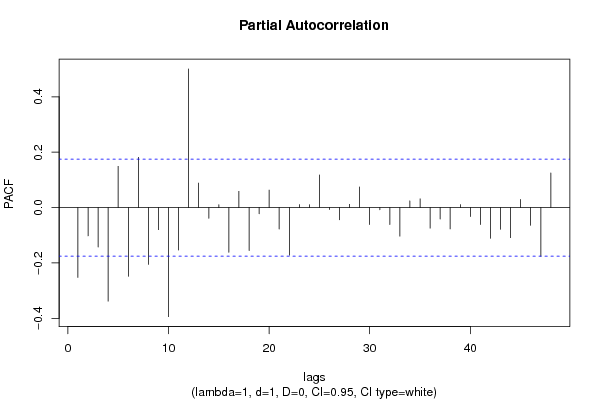
Time lag kPACF(k)T-STATP-value
1-0.252176-2.81940.002798
2-0.102105-1.14160.127908
3-0.142678-1.59520.056597
4-0.33795-3.77840.000122
50.1488571.66430.049281
6-0.248073-2.77350.003198
70.181272.02670.022412
8-0.205199-2.29420.011724
9-0.079635-0.89030.187496
10-0.393909-4.4041.1e-05
11-0.153518-1.71640.044284
120.5006795.59780
130.0883340.98760.162627
14-0.03869-0.43260.333037
150.0101280.11320.455014
16-0.161159-1.80180.036992
170.0586060.65520.25676
18-0.155295-1.73620.042492
19-0.022363-0.250.401491
200.0631520.70610.240731
21-0.077199-0.86310.194865
22-0.171821-1.9210.028503
230.0108460.12130.451837
240.0100920.11280.455174
250.1176351.31520.095426
26-0.007238-0.08090.467817
27-0.043811-0.48980.312559
280.0115830.12950.448585
290.074230.82990.204083
30-0.060893-0.68080.248626
31-0.008085-0.09040.46406
32-0.061113-0.68330.247852
33-0.103079-1.15250.125665
340.0241230.26970.393918
350.0315480.35270.362447
36-0.074244-0.83010.20404
37-0.04099-0.45830.323771
38-0.07706-0.86160.195289
390.0105740.11820.453041
40-0.032525-0.36360.358371
41-0.060855-0.68040.24876
42-0.110762-1.23840.108952
43-0.078605-0.87880.190589
44-0.108455-1.21260.113792
450.0289340.32350.373431
46-0.063835-0.71370.238374
47-0.176061-1.96840.025616
480.1247641.39490.082758

\begin{tabular}{lllllllll}
\hline
Partial Autocorrelation Function \tabularnewline
Time lag k & PACF(k) & T-STAT & P-value \tabularnewline
1 & -0.252176 & -2.8194 & 0.002798 \tabularnewline
2 & -0.102105 & -1.1416 & 0.127908 \tabularnewline
3 & -0.142678 & -1.5952 & 0.056597 \tabularnewline
4 & -0.33795 & -3.7784 & 0.000122 \tabularnewline
5 & 0.148857 & 1.6643 & 0.049281 \tabularnewline
6 & -0.248073 & -2.7735 & 0.003198 \tabularnewline
7 & 0.18127 & 2.0267 & 0.022412 \tabularnewline
8 & -0.205199 & -2.2942 & 0.011724 \tabularnewline
9 & -0.079635 & -0.8903 & 0.187496 \tabularnewline
10 & -0.393909 & -4.404 & 1.1e-05 \tabularnewline
11 & -0.153518 & -1.7164 & 0.044284 \tabularnewline
12 & 0.500679 & 5.5978 & 0 \tabularnewline
13 & 0.088334 & 0.9876 & 0.162627 \tabularnewline
14 & -0.03869 & -0.4326 & 0.333037 \tabularnewline
15 & 0.010128 & 0.1132 & 0.455014 \tabularnewline
16 & -0.161159 & -1.8018 & 0.036992 \tabularnewline
17 & 0.058606 & 0.6552 & 0.25676 \tabularnewline
18 & -0.155295 & -1.7362 & 0.042492 \tabularnewline
19 & -0.022363 & -0.25 & 0.401491 \tabularnewline
20 & 0.063152 & 0.7061 & 0.240731 \tabularnewline
21 & -0.077199 & -0.8631 & 0.194865 \tabularnewline
22 & -0.171821 & -1.921 & 0.028503 \tabularnewline
23 & 0.010846 & 0.1213 & 0.451837 \tabularnewline
24 & 0.010092 & 0.1128 & 0.455174 \tabularnewline
25 & 0.117635 & 1.3152 & 0.095426 \tabularnewline
26 & -0.007238 & -0.0809 & 0.467817 \tabularnewline
27 & -0.043811 & -0.4898 & 0.312559 \tabularnewline
28 & 0.011583 & 0.1295 & 0.448585 \tabularnewline
29 & 0.07423 & 0.8299 & 0.204083 \tabularnewline
30 & -0.060893 & -0.6808 & 0.248626 \tabularnewline
31 & -0.008085 & -0.0904 & 0.46406 \tabularnewline
32 & -0.061113 & -0.6833 & 0.247852 \tabularnewline
33 & -0.103079 & -1.1525 & 0.125665 \tabularnewline
34 & 0.024123 & 0.2697 & 0.393918 \tabularnewline
35 & 0.031548 & 0.3527 & 0.362447 \tabularnewline
36 & -0.074244 & -0.8301 & 0.20404 \tabularnewline
37 & -0.04099 & -0.4583 & 0.323771 \tabularnewline
38 & -0.07706 & -0.8616 & 0.195289 \tabularnewline
39 & 0.010574 & 0.1182 & 0.453041 \tabularnewline
40 & -0.032525 & -0.3636 & 0.358371 \tabularnewline
41 & -0.060855 & -0.6804 & 0.24876 \tabularnewline
42 & -0.110762 & -1.2384 & 0.108952 \tabularnewline
43 & -0.078605 & -0.8788 & 0.190589 \tabularnewline
44 & -0.108455 & -1.2126 & 0.113792 \tabularnewline
45 & 0.028934 & 0.3235 & 0.373431 \tabularnewline
46 & -0.063835 & -0.7137 & 0.238374 \tabularnewline
47 & -0.176061 & -1.9684 & 0.025616 \tabularnewline
48 & 0.124764 & 1.3949 & 0.082758 \tabularnewline
\hline
\end{tabular}
%Source: https://freestatistics.org/blog/index.php?pk=298634&T=2

[TABLE]
[ROW][C]Partial Autocorrelation Function[/C][/ROW]
[ROW][C]Time lag k[/C][C]PACF(k)[/C][C]T-STAT[/C][C]P-value[/C][/ROW]
[ROW][C]1[/C][C]-0.252176[/C][C]-2.8194[/C][C]0.002798[/C][/ROW]
[ROW][C]2[/C][C]-0.102105[/C][C]-1.1416[/C][C]0.127908[/C][/ROW]
[ROW][C]3[/C][C]-0.142678[/C][C]-1.5952[/C][C]0.056597[/C][/ROW]
[ROW][C]4[/C][C]-0.33795[/C][C]-3.7784[/C][C]0.000122[/C][/ROW]
[ROW][C]5[/C][C]0.148857[/C][C]1.6643[/C][C]0.049281[/C][/ROW]
[ROW][C]6[/C][C]-0.248073[/C][C]-2.7735[/C][C]0.003198[/C][/ROW]
[ROW][C]7[/C][C]0.18127[/C][C]2.0267[/C][C]0.022412[/C][/ROW]
[ROW][C]8[/C][C]-0.205199[/C][C]-2.2942[/C][C]0.011724[/C][/ROW]
[ROW][C]9[/C][C]-0.079635[/C][C]-0.8903[/C][C]0.187496[/C][/ROW]
[ROW][C]10[/C][C]-0.393909[/C][C]-4.404[/C][C]1.1e-05[/C][/ROW]
[ROW][C]11[/C][C]-0.153518[/C][C]-1.7164[/C][C]0.044284[/C][/ROW]
[ROW][C]12[/C][C]0.500679[/C][C]5.5978[/C][C]0[/C][/ROW]
[ROW][C]13[/C][C]0.088334[/C][C]0.9876[/C][C]0.162627[/C][/ROW]
[ROW][C]14[/C][C]-0.03869[/C][C]-0.4326[/C][C]0.333037[/C][/ROW]
[ROW][C]15[/C][C]0.010128[/C][C]0.1132[/C][C]0.455014[/C][/ROW]
[ROW][C]16[/C][C]-0.161159[/C][C]-1.8018[/C][C]0.036992[/C][/ROW]
[ROW][C]17[/C][C]0.058606[/C][C]0.6552[/C][C]0.25676[/C][/ROW]
[ROW][C]18[/C][C]-0.155295[/C][C]-1.7362[/C][C]0.042492[/C][/ROW]
[ROW][C]19[/C][C]-0.022363[/C][C]-0.25[/C][C]0.401491[/C][/ROW]
[ROW][C]20[/C][C]0.063152[/C][C]0.7061[/C][C]0.240731[/C][/ROW]
[ROW][C]21[/C][C]-0.077199[/C][C]-0.8631[/C][C]0.194865[/C][/ROW]
[ROW][C]22[/C][C]-0.171821[/C][C]-1.921[/C][C]0.028503[/C][/ROW]
[ROW][C]23[/C][C]0.010846[/C][C]0.1213[/C][C]0.451837[/C][/ROW]
[ROW][C]24[/C][C]0.010092[/C][C]0.1128[/C][C]0.455174[/C][/ROW]
[ROW][C]25[/C][C]0.117635[/C][C]1.3152[/C][C]0.095426[/C][/ROW]
[ROW][C]26[/C][C]-0.007238[/C][C]-0.0809[/C][C]0.467817[/C][/ROW]
[ROW][C]27[/C][C]-0.043811[/C][C]-0.4898[/C][C]0.312559[/C][/ROW]
[ROW][C]28[/C][C]0.011583[/C][C]0.1295[/C][C]0.448585[/C][/ROW]
[ROW][C]29[/C][C]0.07423[/C][C]0.8299[/C][C]0.204083[/C][/ROW]
[ROW][C]30[/C][C]-0.060893[/C][C]-0.6808[/C][C]0.248626[/C][/ROW]
[ROW][C]31[/C][C]-0.008085[/C][C]-0.0904[/C][C]0.46406[/C][/ROW]
[ROW][C]32[/C][C]-0.061113[/C][C]-0.6833[/C][C]0.247852[/C][/ROW]
[ROW][C]33[/C][C]-0.103079[/C][C]-1.1525[/C][C]0.125665[/C][/ROW]
[ROW][C]34[/C][C]0.024123[/C][C]0.2697[/C][C]0.393918[/C][/ROW]
[ROW][C]35[/C][C]0.031548[/C][C]0.3527[/C][C]0.362447[/C][/ROW]
[ROW][C]36[/C][C]-0.074244[/C][C]-0.8301[/C][C]0.20404[/C][/ROW]
[ROW][C]37[/C][C]-0.04099[/C][C]-0.4583[/C][C]0.323771[/C][/ROW]
[ROW][C]38[/C][C]-0.07706[/C][C]-0.8616[/C][C]0.195289[/C][/ROW]
[ROW][C]39[/C][C]0.010574[/C][C]0.1182[/C][C]0.453041[/C][/ROW]
[ROW][C]40[/C][C]-0.032525[/C][C]-0.3636[/C][C]0.358371[/C][/ROW]
[ROW][C]41[/C][C]-0.060855[/C][C]-0.6804[/C][C]0.24876[/C][/ROW]
[ROW][C]42[/C][C]-0.110762[/C][C]-1.2384[/C][C]0.108952[/C][/ROW]
[ROW][C]43[/C][C]-0.078605[/C][C]-0.8788[/C][C]0.190589[/C][/ROW]
[ROW][C]44[/C][C]-0.108455[/C][C]-1.2126[/C][C]0.113792[/C][/ROW]
[ROW][C]45[/C][C]0.028934[/C][C]0.3235[/C][C]0.373431[/C][/ROW]
[ROW][C]46[/C][C]-0.063835[/C][C]-0.7137[/C][C]0.238374[/C][/ROW]
[ROW][C]47[/C][C]-0.176061[/C][C]-1.9684[/C][C]0.025616[/C][/ROW]
[ROW][C]48[/C][C]0.124764[/C][C]1.3949[/C][C]0.082758[/C][/ROW]
[/TABLE]
Source: https://freestatistics.org/blog/index.php?pk=298634&T=2

Globally Unique Identifier (entire table): ba.freestatistics.org/blog/index.php?pk=298634&T=2

As an alternative you can also use a QR Code:  

The GUIDs for individual cells are displayed in the table below:

Partial Autocorrelation Function
Time lag kPACF(k)T-STATP-value
1-0.252176-2.81940.002798
2-0.102105-1.14160.127908
3-0.142678-1.59520.056597
4-0.33795-3.77840.000122
50.1488571.66430.049281
6-0.248073-2.77350.003198
70.181272.02670.022412
8-0.205199-2.29420.011724
9-0.079635-0.89030.187496
10-0.393909-4.4041.1e-05
11-0.153518-1.71640.044284
120.5006795.59780
130.0883340.98760.162627
14-0.03869-0.43260.333037
150.0101280.11320.455014
16-0.161159-1.80180.036992
170.0586060.65520.25676
18-0.155295-1.73620.042492
19-0.022363-0.250.401491
200.0631520.70610.240731
21-0.077199-0.86310.194865
22-0.171821-1.9210.028503
230.0108460.12130.451837
240.0100920.11280.455174
250.1176351.31520.095426
26-0.007238-0.08090.467817
27-0.043811-0.48980.312559
280.0115830.12950.448585
290.074230.82990.204083
30-0.060893-0.68080.248626
31-0.008085-0.09040.46406
32-0.061113-0.68330.247852
33-0.103079-1.15250.125665
340.0241230.26970.393918
350.0315480.35270.362447
36-0.074244-0.83010.20404
37-0.04099-0.45830.323771
38-0.07706-0.86160.195289
390.0105740.11820.453041
40-0.032525-0.36360.358371
41-0.060855-0.68040.24876
42-0.110762-1.23840.108952
43-0.078605-0.87880.190589
44-0.108455-1.21260.113792
450.0289340.32350.373431
46-0.063835-0.71370.238374
47-0.176061-1.96840.025616
480.1247641.39490.082758


Parameters (Session):
Parameters (R input):
par1 = 48 ; par2 = 1 ; par3 = 1 ; par4 = 0 ; par5 = 12 ; par6 = White Noise ; par7 = 0.95 ; par8 = ;
R code (references can be found in the software module):
if (par1 == 'Default') {
par1 = 10*log10(length(x))
} else {
par1 <- as.numeric(par1)
}
par2 <- as.numeric(par2)
par3 <- as.numeric(par3)
par4 <- as.numeric(par4)
par5 <- as.numeric(par5)
if (par6 == 'White Noise') par6 <- 'white' else par6 <- 'ma'
par7 <- as.numeric(par7)
if (par8 != '') par8 <- as.numeric(par8)
x <- na.omit(x)
ox <- x
if (par8 == '') {
if (par2 == 0) {
x <- log(x)
} else {
x <- (x ^ par2 - 1) / par2
}
} else {
x <- log(x,base=par8)
}
if (par3 > 0) x <- diff(x,lag=1,difference=par3)
if (par4 > 0) x <- diff(x,lag=par5,difference=par4)
bitmap(file='picts.png')
op <- par(mfrow=c(2,1))
plot(ox,type='l',main='Original Time Series',xlab='time',ylab='value')
if (par8=='') {
mytitle <- paste('Working Time Series (lambda=',par2,', d=',par3,', D=',par4,')',sep='')
mysub <- paste('(lambda=',par2,', d=',par3,', D=',par4,', CI=', par7, ', CI type=',par6,')',sep='')
} else {
mytitle <- paste('Working Time Series (base=',par8,', d=',par3,', D=',par4,')',sep='')
mysub <- paste('(base=',par8,', d=',par3,', D=',par4,', CI=', par7, ', CI type=',par6,')',sep='')
}
plot(x,type='l', main=mytitle,xlab='time',ylab='value')
par(op)
dev.off()
bitmap(file='pic1.png')
racf <- acf(x, par1, main='Autocorrelation', xlab='time lag', ylab='ACF', ci.type=par6, ci=par7, sub=mysub)
dev.off()
bitmap(file='pic2.png')
rpacf <- pacf(x,par1,main='Partial Autocorrelation',xlab='lags',ylab='PACF',sub=mysub)
dev.off()
(myacf <- c(racf$acf))
(mypacf <- c(rpacf$acf))
lengthx <- length(x)
sqrtn <- sqrt(lengthx)
load(file='createtable')
a<-table.start()
a<-table.row.start(a)
a<-table.element(a,'Autocorrelation Function',4,TRUE)
a<-table.row.end(a)
a<-table.row.start(a)
a<-table.element(a,'Time lag k',header=TRUE)
a<-table.element(a,'ACF(k)',header=TRUE)
a<-table.element(a,'T-STAT',header=TRUE)
a<-table.element(a,'P-value',header=TRUE)
a<-table.row.end(a)
for (i in 2:(par1+1)) {
a<-table.row.start(a)
a<-table.element(a,i-1,header=TRUE)
a<-table.element(a,round(myacf[i],6))
mytstat <- myacf[i]*sqrtn
a<-table.element(a,round(mytstat,4))
a<-table.element(a,round(1-pt(abs(mytstat),lengthx),6))
a<-table.row.end(a)
}
a<-table.end(a)
table.save(a,file='mytable.tab')
a<-table.start()
a<-table.row.start(a)
a<-table.element(a,'Partial Autocorrelation Function',4,TRUE)
a<-table.row.end(a)
a<-table.row.start(a)
a<-table.element(a,'Time lag k',header=TRUE)
a<-table.element(a,'PACF(k)',header=TRUE)
a<-table.element(a,'T-STAT',header=TRUE)
a<-table.element(a,'P-value',header=TRUE)
a<-table.row.end(a)
for (i in 1:par1) {
a<-table.row.start(a)
a<-table.element(a,i,header=TRUE)
a<-table.element(a,round(mypacf[i],6))
mytstat <- mypacf[i]*sqrtn
a<-table.element(a,round(mytstat,4))
a<-table.element(a,round(1-pt(abs(mytstat),lengthx),6))
a<-table.row.end(a)
}
a<-table.end(a)
table.save(a,file='mytable1.tab')