Free Statistics

of Irreproducible Research!

Author's title

Author*The author of this computation has been verified*
R Software Modulerwasp_exponentialsmoothing.wasp
Title produced by softwareExponential Smoothing
Date of computationSun, 11 Dec 2016 16:04:28 +0100
Cite this page as followsStatistical Computations at FreeStatistics.org, Office for Research Development and Education, URL https://freestatistics.org/blog/index.php?v=date/2016/Dec/11/t1481468694ijsvlzt4wwc9hiq.htm/, Retrieved Thu, 02 May 2024 04:30:01 +0000
Statistical Computations at FreeStatistics.org, Office for Research Development and Education, URL https://freestatistics.org/blog/index.php?pk=298799, Retrieved Thu, 02 May 2024 04:30:01 +0000
QR Codes:

Original text written by user:
IsPrivate?No (this computation is public)
User-defined keywords
Estimated Impact85
Family? (F = Feedback message, R = changed R code, M = changed R Module, P = changed Parameters, D = changed Data)
-       [Exponential Smoothing] [Exponential Smoot...] [2016-12-11 15:04:28] [59384cc4294cbecf8e09b453c4247580] [Current]
Feedback Forum

Post a new message
Dataseries X:
2622.4
2607.5
2556.6
2569.3
2533.2
2529
2577.8
2556.6
2558.7
2541.7
2473.8
2461
2435.5
2414.3
2350.6
2329.4
2278.4
2252.9
2269.9
2227.4
2195.6
2204.1
2195.6
2202
2157.4
2142.5
2125.5
2110.7
2072.4
2076.7
2095.8
2023.6
2004.5
1985.4
1953.5
1915.3
1881.3
1821.9
1775.2
1790
1758.2
1747.6
1679.6
1692.3
1675.4
1639.3
1622.3
1577.7
1581.9
1562.8
1552.2
1535.2
1507.6


Summary of computational transaction
Raw Input view raw input (R code)
Raw Outputview raw output of R engine
Computing time1 seconds
R ServerBig Analytics Cloud Computing Center

\begin{tabular}{lllllllll}
\hline
Summary of computational transaction \tabularnewline
Raw Input view raw input (R code)  \tabularnewline
Raw Outputview raw output of R engine  \tabularnewline
Computing time1 seconds \tabularnewline
R ServerBig Analytics Cloud Computing Center \tabularnewline
\hline
\end{tabular}
%Source: https://freestatistics.org/blog/index.php?pk=298799&T=0

[TABLE]
[ROW]
Summary of computational transaction[/C][/ROW] [ROW]Raw Input[/C] view raw input (R code) [/C][/ROW] [ROW]Raw Output[/C]view raw output of R engine [/C][/ROW] [ROW]Computing time[/C]1 seconds[/C][/ROW] [ROW]R Server[/C]Big Analytics Cloud Computing Center[/C][/ROW] [/TABLE] Source: https://freestatistics.org/blog/index.php?pk=298799&T=0

Globally Unique Identifier (entire table): ba.freestatistics.org/blog/index.php?pk=298799&T=0

As an alternative you can also use a QR Code:  

The GUIDs for individual cells are displayed in the table below:

Summary of computational transaction
Raw Input view raw input (R code)
Raw Outputview raw output of R engine
Computing time1 seconds
R ServerBig Analytics Cloud Computing Center


Estimated Parameters of Exponential Smoothing
ParameterValue
alpha0.665495571902525
beta0.115928387929235
gamma0.760197942956209

\begin{tabular}{lllllllll}
\hline
Estimated Parameters of Exponential Smoothing \tabularnewline
Parameter & Value \tabularnewline
alpha & 0.665495571902525 \tabularnewline
beta & 0.115928387929235 \tabularnewline
gamma & 0.760197942956209 \tabularnewline
\hline
\end{tabular}
%Source: https://freestatistics.org/blog/index.php?pk=298799&T=1

[TABLE]
[ROW][C]Estimated Parameters of Exponential Smoothing[/C][/ROW]
[ROW][C]Parameter[/C][C]Value[/C][/ROW]
[ROW][C]alpha[/C][C]0.665495571902525[/C][/ROW]
[ROW][C]beta[/C][C]0.115928387929235[/C][/ROW]
[ROW][C]gamma[/C][C]0.760197942956209[/C][/ROW]
[/TABLE]
Source: https://freestatistics.org/blog/index.php?pk=298799&T=1

Globally Unique Identifier (entire table): ba.freestatistics.org/blog/index.php?pk=298799&T=1

As an alternative you can also use a QR Code:  

The GUIDs for individual cells are displayed in the table below:

Estimated Parameters of Exponential Smoothing
ParameterValue
alpha0.665495571902525
beta0.115928387929235
gamma0.760197942956209


Interpolation Forecasts of Exponential Smoothing
tObservedFittedResiduals
72577.82589.08333333333-11.2833333333338
82556.62560.96715106179-4.36715106179417
92558.72563.78339917623-5.08339917623289
102541.72531.597470632510.1025293674979
112473.82503.57211870125-29.7721187012503
1224612474.72178452086-13.7217845208584
132435.52503.683342598-68.1833425980008
142414.32430.89358887145-16.5935888714471
152350.62415.882214428-65.2822144279985
162329.42333.34268806696-3.94268806695845
172278.42270.593836372867.80616362713954
182252.92258.49551112122-5.5955111212179
192269.92267.305397866472.59460213352895
202227.42248.48663231305-21.0866323130517
212195.62211.50735242296-15.9073524229561
222204.12174.637047645329.4629523547028
232195.62136.8968189832258.7031810167823
2422022158.9787301022743.0212698977271
252157.42209.69270900705-52.2927090070548
262142.52151.55742238604-9.05742238603807
272125.52128.06124938857-2.56124938856783
282110.72116.80024636379-6.1002463637933
292072.42065.274990768677.12500923133166
302076.72047.5115021956329.1884978043706
312095.82062.1826768395233.6173231604785
322023.62076.2425590819-52.6425590818985
332004.52026.05813394616-21.5581339461608
341985.42000.45480617112-15.0548061711224
351953.51944.842480436418.65751956358895
361915.31932.33672390926-17.0367239092575
371881.31912.43249238556-31.1324923855602
381821.91851.53230290964-29.6323029096402
391775.21816.4064169203-41.2064169203022
4017901769.7059808394520.294019160553
411758.21736.7001034989221.4998965010836
421747.61720.2500651611927.3499348388077
431679.61723.76792612927-44.1679261292661
441692.31651.0358889489941.264111051009
451675.41662.0794153272913.3205846727085
461639.31673.44346552422-34.1434655242231
471622.31606.4545708171215.8454291828832
481577.71589.23111770946-11.5311177094572
491581.91547.1899015421434.7100984578569
501562.81553.263081097089.53691890292225
511552.21538.2265705709113.9734294290922
521535.21540.14585613544-4.94585613544177
531507.61509.7424700753-2.14247007530275

\begin{tabular}{lllllllll}
\hline
Interpolation Forecasts of Exponential Smoothing \tabularnewline
t & Observed & Fitted & Residuals \tabularnewline
7 & 2577.8 & 2589.08333333333 & -11.2833333333338 \tabularnewline
8 & 2556.6 & 2560.96715106179 & -4.36715106179417 \tabularnewline
9 & 2558.7 & 2563.78339917623 & -5.08339917623289 \tabularnewline
10 & 2541.7 & 2531.5974706325 & 10.1025293674979 \tabularnewline
11 & 2473.8 & 2503.57211870125 & -29.7721187012503 \tabularnewline
12 & 2461 & 2474.72178452086 & -13.7217845208584 \tabularnewline
13 & 2435.5 & 2503.683342598 & -68.1833425980008 \tabularnewline
14 & 2414.3 & 2430.89358887145 & -16.5935888714471 \tabularnewline
15 & 2350.6 & 2415.882214428 & -65.2822144279985 \tabularnewline
16 & 2329.4 & 2333.34268806696 & -3.94268806695845 \tabularnewline
17 & 2278.4 & 2270.59383637286 & 7.80616362713954 \tabularnewline
18 & 2252.9 & 2258.49551112122 & -5.5955111212179 \tabularnewline
19 & 2269.9 & 2267.30539786647 & 2.59460213352895 \tabularnewline
20 & 2227.4 & 2248.48663231305 & -21.0866323130517 \tabularnewline
21 & 2195.6 & 2211.50735242296 & -15.9073524229561 \tabularnewline
22 & 2204.1 & 2174.6370476453 & 29.4629523547028 \tabularnewline
23 & 2195.6 & 2136.89681898322 & 58.7031810167823 \tabularnewline
24 & 2202 & 2158.97873010227 & 43.0212698977271 \tabularnewline
25 & 2157.4 & 2209.69270900705 & -52.2927090070548 \tabularnewline
26 & 2142.5 & 2151.55742238604 & -9.05742238603807 \tabularnewline
27 & 2125.5 & 2128.06124938857 & -2.56124938856783 \tabularnewline
28 & 2110.7 & 2116.80024636379 & -6.1002463637933 \tabularnewline
29 & 2072.4 & 2065.27499076867 & 7.12500923133166 \tabularnewline
30 & 2076.7 & 2047.51150219563 & 29.1884978043706 \tabularnewline
31 & 2095.8 & 2062.18267683952 & 33.6173231604785 \tabularnewline
32 & 2023.6 & 2076.2425590819 & -52.6425590818985 \tabularnewline
33 & 2004.5 & 2026.05813394616 & -21.5581339461608 \tabularnewline
34 & 1985.4 & 2000.45480617112 & -15.0548061711224 \tabularnewline
35 & 1953.5 & 1944.84248043641 & 8.65751956358895 \tabularnewline
36 & 1915.3 & 1932.33672390926 & -17.0367239092575 \tabularnewline
37 & 1881.3 & 1912.43249238556 & -31.1324923855602 \tabularnewline
38 & 1821.9 & 1851.53230290964 & -29.6323029096402 \tabularnewline
39 & 1775.2 & 1816.4064169203 & -41.2064169203022 \tabularnewline
40 & 1790 & 1769.70598083945 & 20.294019160553 \tabularnewline
41 & 1758.2 & 1736.70010349892 & 21.4998965010836 \tabularnewline
42 & 1747.6 & 1720.25006516119 & 27.3499348388077 \tabularnewline
43 & 1679.6 & 1723.76792612927 & -44.1679261292661 \tabularnewline
44 & 1692.3 & 1651.03588894899 & 41.264111051009 \tabularnewline
45 & 1675.4 & 1662.07941532729 & 13.3205846727085 \tabularnewline
46 & 1639.3 & 1673.44346552422 & -34.1434655242231 \tabularnewline
47 & 1622.3 & 1606.45457081712 & 15.8454291828832 \tabularnewline
48 & 1577.7 & 1589.23111770946 & -11.5311177094572 \tabularnewline
49 & 1581.9 & 1547.18990154214 & 34.7100984578569 \tabularnewline
50 & 1562.8 & 1553.26308109708 & 9.53691890292225 \tabularnewline
51 & 1552.2 & 1538.22657057091 & 13.9734294290922 \tabularnewline
52 & 1535.2 & 1540.14585613544 & -4.94585613544177 \tabularnewline
53 & 1507.6 & 1509.7424700753 & -2.14247007530275 \tabularnewline
\hline
\end{tabular}
%Source: https://freestatistics.org/blog/index.php?pk=298799&T=2

[TABLE]
[ROW][C]Interpolation Forecasts of Exponential Smoothing[/C][/ROW]
[ROW][C]t[/C][C]Observed[/C][C]Fitted[/C][C]Residuals[/C][/ROW]
[ROW][C]7[/C][C]2577.8[/C][C]2589.08333333333[/C][C]-11.2833333333338[/C][/ROW]
[ROW][C]8[/C][C]2556.6[/C][C]2560.96715106179[/C][C]-4.36715106179417[/C][/ROW]
[ROW][C]9[/C][C]2558.7[/C][C]2563.78339917623[/C][C]-5.08339917623289[/C][/ROW]
[ROW][C]10[/C][C]2541.7[/C][C]2531.5974706325[/C][C]10.1025293674979[/C][/ROW]
[ROW][C]11[/C][C]2473.8[/C][C]2503.57211870125[/C][C]-29.7721187012503[/C][/ROW]
[ROW][C]12[/C][C]2461[/C][C]2474.72178452086[/C][C]-13.7217845208584[/C][/ROW]
[ROW][C]13[/C][C]2435.5[/C][C]2503.683342598[/C][C]-68.1833425980008[/C][/ROW]
[ROW][C]14[/C][C]2414.3[/C][C]2430.89358887145[/C][C]-16.5935888714471[/C][/ROW]
[ROW][C]15[/C][C]2350.6[/C][C]2415.882214428[/C][C]-65.2822144279985[/C][/ROW]
[ROW][C]16[/C][C]2329.4[/C][C]2333.34268806696[/C][C]-3.94268806695845[/C][/ROW]
[ROW][C]17[/C][C]2278.4[/C][C]2270.59383637286[/C][C]7.80616362713954[/C][/ROW]
[ROW][C]18[/C][C]2252.9[/C][C]2258.49551112122[/C][C]-5.5955111212179[/C][/ROW]
[ROW][C]19[/C][C]2269.9[/C][C]2267.30539786647[/C][C]2.59460213352895[/C][/ROW]
[ROW][C]20[/C][C]2227.4[/C][C]2248.48663231305[/C][C]-21.0866323130517[/C][/ROW]
[ROW][C]21[/C][C]2195.6[/C][C]2211.50735242296[/C][C]-15.9073524229561[/C][/ROW]
[ROW][C]22[/C][C]2204.1[/C][C]2174.6370476453[/C][C]29.4629523547028[/C][/ROW]
[ROW][C]23[/C][C]2195.6[/C][C]2136.89681898322[/C][C]58.7031810167823[/C][/ROW]
[ROW][C]24[/C][C]2202[/C][C]2158.97873010227[/C][C]43.0212698977271[/C][/ROW]
[ROW][C]25[/C][C]2157.4[/C][C]2209.69270900705[/C][C]-52.2927090070548[/C][/ROW]
[ROW][C]26[/C][C]2142.5[/C][C]2151.55742238604[/C][C]-9.05742238603807[/C][/ROW]
[ROW][C]27[/C][C]2125.5[/C][C]2128.06124938857[/C][C]-2.56124938856783[/C][/ROW]
[ROW][C]28[/C][C]2110.7[/C][C]2116.80024636379[/C][C]-6.1002463637933[/C][/ROW]
[ROW][C]29[/C][C]2072.4[/C][C]2065.27499076867[/C][C]7.12500923133166[/C][/ROW]
[ROW][C]30[/C][C]2076.7[/C][C]2047.51150219563[/C][C]29.1884978043706[/C][/ROW]
[ROW][C]31[/C][C]2095.8[/C][C]2062.18267683952[/C][C]33.6173231604785[/C][/ROW]
[ROW][C]32[/C][C]2023.6[/C][C]2076.2425590819[/C][C]-52.6425590818985[/C][/ROW]
[ROW][C]33[/C][C]2004.5[/C][C]2026.05813394616[/C][C]-21.5581339461608[/C][/ROW]
[ROW][C]34[/C][C]1985.4[/C][C]2000.45480617112[/C][C]-15.0548061711224[/C][/ROW]
[ROW][C]35[/C][C]1953.5[/C][C]1944.84248043641[/C][C]8.65751956358895[/C][/ROW]
[ROW][C]36[/C][C]1915.3[/C][C]1932.33672390926[/C][C]-17.0367239092575[/C][/ROW]
[ROW][C]37[/C][C]1881.3[/C][C]1912.43249238556[/C][C]-31.1324923855602[/C][/ROW]
[ROW][C]38[/C][C]1821.9[/C][C]1851.53230290964[/C][C]-29.6323029096402[/C][/ROW]
[ROW][C]39[/C][C]1775.2[/C][C]1816.4064169203[/C][C]-41.2064169203022[/C][/ROW]
[ROW][C]40[/C][C]1790[/C][C]1769.70598083945[/C][C]20.294019160553[/C][/ROW]
[ROW][C]41[/C][C]1758.2[/C][C]1736.70010349892[/C][C]21.4998965010836[/C][/ROW]
[ROW][C]42[/C][C]1747.6[/C][C]1720.25006516119[/C][C]27.3499348388077[/C][/ROW]
[ROW][C]43[/C][C]1679.6[/C][C]1723.76792612927[/C][C]-44.1679261292661[/C][/ROW]
[ROW][C]44[/C][C]1692.3[/C][C]1651.03588894899[/C][C]41.264111051009[/C][/ROW]
[ROW][C]45[/C][C]1675.4[/C][C]1662.07941532729[/C][C]13.3205846727085[/C][/ROW]
[ROW][C]46[/C][C]1639.3[/C][C]1673.44346552422[/C][C]-34.1434655242231[/C][/ROW]
[ROW][C]47[/C][C]1622.3[/C][C]1606.45457081712[/C][C]15.8454291828832[/C][/ROW]
[ROW][C]48[/C][C]1577.7[/C][C]1589.23111770946[/C][C]-11.5311177094572[/C][/ROW]
[ROW][C]49[/C][C]1581.9[/C][C]1547.18990154214[/C][C]34.7100984578569[/C][/ROW]
[ROW][C]50[/C][C]1562.8[/C][C]1553.26308109708[/C][C]9.53691890292225[/C][/ROW]
[ROW][C]51[/C][C]1552.2[/C][C]1538.22657057091[/C][C]13.9734294290922[/C][/ROW]
[ROW][C]52[/C][C]1535.2[/C][C]1540.14585613544[/C][C]-4.94585613544177[/C][/ROW]
[ROW][C]53[/C][C]1507.6[/C][C]1509.7424700753[/C][C]-2.14247007530275[/C][/ROW]
[/TABLE]
Source: https://freestatistics.org/blog/index.php?pk=298799&T=2

Globally Unique Identifier (entire table): ba.freestatistics.org/blog/index.php?pk=298799&T=2

As an alternative you can also use a QR Code:  

The GUIDs for individual cells are displayed in the table below:

Interpolation Forecasts of Exponential Smoothing
tObservedFittedResiduals
72577.82589.08333333333-11.2833333333338
82556.62560.96715106179-4.36715106179417
92558.72563.78339917623-5.08339917623289
102541.72531.597470632510.1025293674979
112473.82503.57211870125-29.7721187012503
1224612474.72178452086-13.7217845208584
132435.52503.683342598-68.1833425980008
142414.32430.89358887145-16.5935888714471
152350.62415.882214428-65.2822144279985
162329.42333.34268806696-3.94268806695845
172278.42270.593836372867.80616362713954
182252.92258.49551112122-5.5955111212179
192269.92267.305397866472.59460213352895
202227.42248.48663231305-21.0866323130517
212195.62211.50735242296-15.9073524229561
222204.12174.637047645329.4629523547028
232195.62136.8968189832258.7031810167823
2422022158.9787301022743.0212698977271
252157.42209.69270900705-52.2927090070548
262142.52151.55742238604-9.05742238603807
272125.52128.06124938857-2.56124938856783
282110.72116.80024636379-6.1002463637933
292072.42065.274990768677.12500923133166
302076.72047.5115021956329.1884978043706
312095.82062.1826768395233.6173231604785
322023.62076.2425590819-52.6425590818985
332004.52026.05813394616-21.5581339461608
341985.42000.45480617112-15.0548061711224
351953.51944.842480436418.65751956358895
361915.31932.33672390926-17.0367239092575
371881.31912.43249238556-31.1324923855602
381821.91851.53230290964-29.6323029096402
391775.21816.4064169203-41.2064169203022
4017901769.7059808394520.294019160553
411758.21736.7001034989221.4998965010836
421747.61720.2500651611927.3499348388077
431679.61723.76792612927-44.1679261292661
441692.31651.0358889489941.264111051009
451675.41662.0794153272913.3205846727085
461639.31673.44346552422-34.1434655242231
471622.31606.4545708171215.8454291828832
481577.71589.23111770946-11.5311177094572
491581.91547.1899015421434.7100984578569
501562.81553.263081097089.53691890292225
511552.21538.2265705709113.9734294290922
521535.21540.14585613544-4.94585613544177
531507.61509.7424700753-2.14247007530275


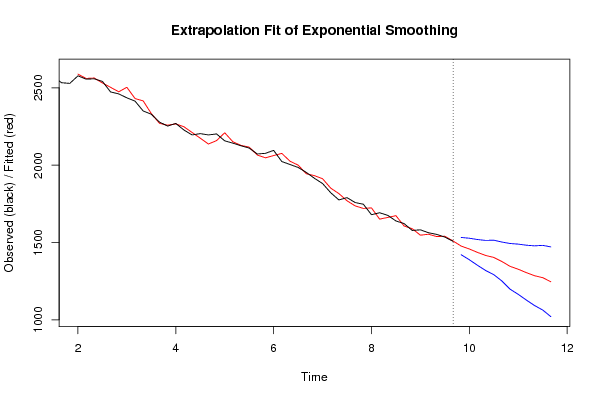
Extrapolation Forecasts of Exponential Smoothing
tForecast95% Lower Bound95% Upper Bound
541476.641789695731420.769442184311532.51413720715
551457.977975005571388.383315447071527.57263456408
561435.817416722411352.502277496031519.13255594879
571416.093471821651318.867610459311513.31933318398
581403.355661677921291.93328841051514.77803494534
591376.791301634231250.835732442281502.74687082619
601345.661233414361197.901441072281493.42102575643
611326.99741872421164.609404962811489.38543248559
621304.836860441041127.337436697741482.33628418434
631285.112915540271092.036109512331478.18972156821
641272.375105396551063.270224178831481.47998661426
651245.810745352861020.240796237181471.38069446854

\begin{tabular}{lllllllll}
\hline
Extrapolation Forecasts of Exponential Smoothing \tabularnewline
t & Forecast & 95% Lower Bound & 95% Upper Bound \tabularnewline
54 & 1476.64178969573 & 1420.76944218431 & 1532.51413720715 \tabularnewline
55 & 1457.97797500557 & 1388.38331544707 & 1527.57263456408 \tabularnewline
56 & 1435.81741672241 & 1352.50227749603 & 1519.13255594879 \tabularnewline
57 & 1416.09347182165 & 1318.86761045931 & 1513.31933318398 \tabularnewline
58 & 1403.35566167792 & 1291.9332884105 & 1514.77803494534 \tabularnewline
59 & 1376.79130163423 & 1250.83573244228 & 1502.74687082619 \tabularnewline
60 & 1345.66123341436 & 1197.90144107228 & 1493.42102575643 \tabularnewline
61 & 1326.9974187242 & 1164.60940496281 & 1489.38543248559 \tabularnewline
62 & 1304.83686044104 & 1127.33743669774 & 1482.33628418434 \tabularnewline
63 & 1285.11291554027 & 1092.03610951233 & 1478.18972156821 \tabularnewline
64 & 1272.37510539655 & 1063.27022417883 & 1481.47998661426 \tabularnewline
65 & 1245.81074535286 & 1020.24079623718 & 1471.38069446854 \tabularnewline
\hline
\end{tabular}
%Source: https://freestatistics.org/blog/index.php?pk=298799&T=3

[TABLE]
[ROW][C]Extrapolation Forecasts of Exponential Smoothing[/C][/ROW]
[ROW][C]t[/C][C]Forecast[/C][C]95% Lower Bound[/C][C]95% Upper Bound[/C][/ROW]
[ROW][C]54[/C][C]1476.64178969573[/C][C]1420.76944218431[/C][C]1532.51413720715[/C][/ROW]
[ROW][C]55[/C][C]1457.97797500557[/C][C]1388.38331544707[/C][C]1527.57263456408[/C][/ROW]
[ROW][C]56[/C][C]1435.81741672241[/C][C]1352.50227749603[/C][C]1519.13255594879[/C][/ROW]
[ROW][C]57[/C][C]1416.09347182165[/C][C]1318.86761045931[/C][C]1513.31933318398[/C][/ROW]
[ROW][C]58[/C][C]1403.35566167792[/C][C]1291.9332884105[/C][C]1514.77803494534[/C][/ROW]
[ROW][C]59[/C][C]1376.79130163423[/C][C]1250.83573244228[/C][C]1502.74687082619[/C][/ROW]
[ROW][C]60[/C][C]1345.66123341436[/C][C]1197.90144107228[/C][C]1493.42102575643[/C][/ROW]
[ROW][C]61[/C][C]1326.9974187242[/C][C]1164.60940496281[/C][C]1489.38543248559[/C][/ROW]
[ROW][C]62[/C][C]1304.83686044104[/C][C]1127.33743669774[/C][C]1482.33628418434[/C][/ROW]
[ROW][C]63[/C][C]1285.11291554027[/C][C]1092.03610951233[/C][C]1478.18972156821[/C][/ROW]
[ROW][C]64[/C][C]1272.37510539655[/C][C]1063.27022417883[/C][C]1481.47998661426[/C][/ROW]
[ROW][C]65[/C][C]1245.81074535286[/C][C]1020.24079623718[/C][C]1471.38069446854[/C][/ROW]
[/TABLE]
Source: https://freestatistics.org/blog/index.php?pk=298799&T=3

Globally Unique Identifier (entire table): ba.freestatistics.org/blog/index.php?pk=298799&T=3

As an alternative you can also use a QR Code:  

The GUIDs for individual cells are displayed in the table below:

Extrapolation Forecasts of Exponential Smoothing
tForecast95% Lower Bound95% Upper Bound
541476.641789695731420.769442184311532.51413720715
551457.977975005571388.383315447071527.57263456408
561435.817416722411352.502277496031519.13255594879
571416.093471821651318.867610459311513.31933318398
581403.355661677921291.93328841051514.77803494534
591376.791301634231250.835732442281502.74687082619
601345.661233414361197.901441072281493.42102575643
611326.99741872421164.609404962811489.38543248559
621304.836860441041127.337436697741482.33628418434
631285.112915540271092.036109512331478.18972156821
641272.375105396551063.270224178831481.47998661426
651245.810745352861020.240796237181471.38069446854


Parameters (Session):
par1 = 12 ; par2 = Double ; par3 = additive ; par4 = 12 ;
Parameters (R input):
par1 = 6 ; par2 = Triple ; par3 = additive ; par4 = 12 ;
R code (references can be found in the software module):
par4 <- '12'
par3 <- 'additive'
par2 <- 'Triple'
par1 <- '6'
par1 <- as.numeric(par1)
par4 <- as.numeric(par4)
if (par2 == 'Single') K <- 1
if (par2 == 'Double') K <- 2
if (par2 == 'Triple') K <- par1
nx <- length(x)
nxmK <- nx - K
x <- ts(x, frequency = par1)
if (par2 == 'Single') fit <- HoltWinters(x, gamma=F, beta=F)
if (par2 == 'Double') fit <- HoltWinters(x, gamma=F)
if (par2 == 'Triple') fit <- HoltWinters(x, seasonal=par3)
fit
myresid <- x - fit$fitted[,'xhat']
bitmap(file='test1.png')
op <- par(mfrow=c(2,1))
plot(fit,ylab='Observed (black) / Fitted (red)',main='Interpolation Fit of Exponential Smoothing')
plot(myresid,ylab='Residuals',main='Interpolation Prediction Errors')
par(op)
dev.off()
bitmap(file='test2.png')
p <- predict(fit, par4, prediction.interval=TRUE)
np <- length(p[,1])
plot(fit,p,ylab='Observed (black) / Fitted (red)',main='Extrapolation Fit of Exponential Smoothing')
dev.off()
bitmap(file='test3.png')
op <- par(mfrow = c(2,2))
acf(as.numeric(myresid),lag.max = nx/2,main='Residual ACF')
spectrum(myresid,main='Residals Periodogram')
cpgram(myresid,main='Residal Cumulative Periodogram')
qqnorm(myresid,main='Residual Normal QQ Plot')
qqline(myresid)
par(op)
dev.off()
load(file='createtable')
a<-table.start()
a<-table.row.start(a)
a<-table.element(a,'Estimated Parameters of Exponential Smoothing',2,TRUE)
a<-table.row.end(a)
a<-table.row.start(a)
a<-table.element(a,'Parameter',header=TRUE)
a<-table.element(a,'Value',header=TRUE)
a<-table.row.end(a)
a<-table.row.start(a)
a<-table.element(a,'alpha',header=TRUE)
a<-table.element(a,fit$alpha)
a<-table.row.end(a)
a<-table.row.start(a)
a<-table.element(a,'beta',header=TRUE)
a<-table.element(a,fit$beta)
a<-table.row.end(a)
a<-table.row.start(a)
a<-table.element(a,'gamma',header=TRUE)
a<-table.element(a,fit$gamma)
a<-table.row.end(a)
a<-table.end(a)
table.save(a,file='mytable.tab')
a<-table.start()
a<-table.row.start(a)
a<-table.element(a,'Interpolation Forecasts of Exponential Smoothing',4,TRUE)
a<-table.row.end(a)
a<-table.row.start(a)
a<-table.element(a,'t',header=TRUE)
a<-table.element(a,'Observed',header=TRUE)
a<-table.element(a,'Fitted',header=TRUE)
a<-table.element(a,'Residuals',header=TRUE)
a<-table.row.end(a)
for (i in 1:nxmK) {
a<-table.row.start(a)
a<-table.element(a,i+K,header=TRUE)
a<-table.element(a,x[i+K])
a<-table.element(a,fit$fitted[i,'xhat'])
a<-table.element(a,myresid[i])
a<-table.row.end(a)
}
a<-table.end(a)
table.save(a,file='mytable1.tab')
a<-table.start()
a<-table.row.start(a)
a<-table.element(a,'Extrapolation Forecasts of Exponential Smoothing',4,TRUE)
a<-table.row.end(a)
a<-table.row.start(a)
a<-table.element(a,'t',header=TRUE)
a<-table.element(a,'Forecast',header=TRUE)
a<-table.element(a,'95% Lower Bound',header=TRUE)
a<-table.element(a,'95% Upper Bound',header=TRUE)
a<-table.row.end(a)
for (i in 1:np) {
a<-table.row.start(a)
a<-table.element(a,nx+i,header=TRUE)
a<-table.element(a,p[i,'fit'])
a<-table.element(a,p[i,'lwr'])
a<-table.element(a,p[i,'upr'])
a<-table.row.end(a)
}
a<-table.end(a)
table.save(a,file='mytable2.tab')