Free Statistics

of Irreproducible Research!

Author's title

Author*The author of this computation has been verified*
R Software Modulerwasp_autocorrelation.wasp
Title produced by software(Partial) Autocorrelation Function
Date of computationSun, 11 Dec 2016 18:13:39 +0100
Cite this page as followsStatistical Computations at FreeStatistics.org, Office for Research Development and Education, URL https://freestatistics.org/blog/index.php?v=date/2016/Dec/11/t14814764314585hjrgb5d9hp1.htm/, Retrieved Thu, 02 May 2024 07:22:28 +0000
Statistical Computations at FreeStatistics.org, Office for Research Development and Education, URL https://freestatistics.org/blog/index.php?pk=298838, Retrieved Thu, 02 May 2024 07:22:28 +0000
QR Codes:

Original text written by user:
IsPrivate?No (this computation is public)
User-defined keywords
Estimated Impact61
Family? (F = Feedback message, R = changed R code, M = changed R Module, P = changed Parameters, D = changed Data)
-       [(Partial) Autocorrelation Function] [] [2016-12-11 17:13:39] [1bf80170c5e6d32ce8f3ad7977dc404a] [Current]
Feedback Forum

Post a new message
Dataseries X:
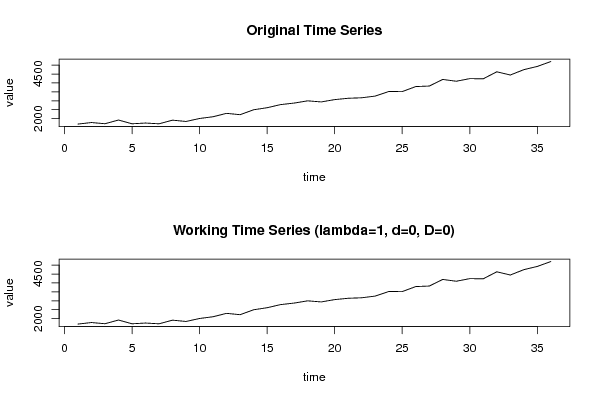
1697.22
1782.58
1715.7
1923.82
1712.6
1754.8
1711.6
1916
1842.2
2010
2107.4
2298.2
2222.2
2498.6
2613
2788.8
2873.6
2999.6
2937.6
3068.2
3142.8
3170.4
3265.6
3522.2
3516.8
3798.8
3828.6
4198.8
4097.8
4244.8
4235
4627.8
4446.8
4747.2
4928.8
5202.2


Summary of computational transaction
Raw Input view raw input (R code)
Raw Outputview raw output of R engine
Computing time1 seconds
R ServerBig Analytics Cloud Computing Center

\begin{tabular}{lllllllll}
\hline
Summary of computational transaction \tabularnewline
Raw Input view raw input (R code)  \tabularnewline
Raw Outputview raw output of R engine  \tabularnewline
Computing time1 seconds \tabularnewline
R ServerBig Analytics Cloud Computing Center \tabularnewline
\hline
\end{tabular}
%Source: https://freestatistics.org/blog/index.php?pk=298838&T=0

[TABLE]
[ROW]
Summary of computational transaction[/C][/ROW] [ROW]Raw Input[/C] view raw input (R code) [/C][/ROW] [ROW]Raw Output[/C]view raw output of R engine [/C][/ROW] [ROW]Computing time[/C]1 seconds[/C][/ROW] [ROW]R Server[/C]Big Analytics Cloud Computing Center[/C][/ROW] [/TABLE] Source: https://freestatistics.org/blog/index.php?pk=298838&T=0

Globally Unique Identifier (entire table): ba.freestatistics.org/blog/index.php?pk=298838&T=0

As an alternative you can also use a QR Code:  

The GUIDs for individual cells are displayed in the table below:

Summary of computational transaction
Raw Input view raw input (R code)
Raw Outputview raw output of R engine
Computing time1 seconds
R ServerBig Analytics Cloud Computing Center


Autocorrelation Function
Time lag kACF(k)T-STATP-value
10.9068345.4412e-06
20.8327944.99688e-06
30.7485734.49143.5e-05
40.6876634.1260.000104
50.591883.55130.000545
60.5205673.12340.00176
70.4333452.60010.006717
80.3596322.15780.018846
90.264171.5850.060854
100.1927481.15650.127549
110.1149080.68940.24748
120.056030.33620.369342
13-0.015895-0.09540.462275
14-0.066606-0.39960.345894
15-0.117832-0.7070.242062
16-0.161502-0.9690.169502
17-0.207262-1.24360.110847
18-0.242403-1.45440.077247
19-0.290981-1.74590.04468
20-0.327128-1.96280.028718
21-0.366346-2.19810.017229
22-0.393964-2.36380.011803
23-0.419559-2.51740.008208
24-0.419067-2.51440.008266
25-0.431161-2.5870.006935
26-0.421524-2.52910.007978
27-0.410382-2.46230.009362
28-0.375492-2.2530.015226
29-0.352613-2.11570.020679
30-0.310783-1.86470.035196
31-0.273568-1.64140.054711
32-0.219795-1.31880.097787
33-0.184934-1.10960.137263
34-0.129049-0.77430.221907
35-0.071298-0.42780.335676
36NANANA
37NANANA
38NANANA
39NANANA
40NANANA
41NANANA
42NANANA
43NANANA
44NANANA
45NANANA
46NANANA
47NANANA
48NANANA

\begin{tabular}{lllllllll}
\hline
Autocorrelation Function \tabularnewline
Time lag k & ACF(k) & T-STAT & P-value \tabularnewline
1 & 0.906834 & 5.441 & 2e-06 \tabularnewline
2 & 0.832794 & 4.9968 & 8e-06 \tabularnewline
3 & 0.748573 & 4.4914 & 3.5e-05 \tabularnewline
4 & 0.687663 & 4.126 & 0.000104 \tabularnewline
5 & 0.59188 & 3.5513 & 0.000545 \tabularnewline
6 & 0.520567 & 3.1234 & 0.00176 \tabularnewline
7 & 0.433345 & 2.6001 & 0.006717 \tabularnewline
8 & 0.359632 & 2.1578 & 0.018846 \tabularnewline
9 & 0.26417 & 1.585 & 0.060854 \tabularnewline
10 & 0.192748 & 1.1565 & 0.127549 \tabularnewline
11 & 0.114908 & 0.6894 & 0.24748 \tabularnewline
12 & 0.05603 & 0.3362 & 0.369342 \tabularnewline
13 & -0.015895 & -0.0954 & 0.462275 \tabularnewline
14 & -0.066606 & -0.3996 & 0.345894 \tabularnewline
15 & -0.117832 & -0.707 & 0.242062 \tabularnewline
16 & -0.161502 & -0.969 & 0.169502 \tabularnewline
17 & -0.207262 & -1.2436 & 0.110847 \tabularnewline
18 & -0.242403 & -1.4544 & 0.077247 \tabularnewline
19 & -0.290981 & -1.7459 & 0.04468 \tabularnewline
20 & -0.327128 & -1.9628 & 0.028718 \tabularnewline
21 & -0.366346 & -2.1981 & 0.017229 \tabularnewline
22 & -0.393964 & -2.3638 & 0.011803 \tabularnewline
23 & -0.419559 & -2.5174 & 0.008208 \tabularnewline
24 & -0.419067 & -2.5144 & 0.008266 \tabularnewline
25 & -0.431161 & -2.587 & 0.006935 \tabularnewline
26 & -0.421524 & -2.5291 & 0.007978 \tabularnewline
27 & -0.410382 & -2.4623 & 0.009362 \tabularnewline
28 & -0.375492 & -2.253 & 0.015226 \tabularnewline
29 & -0.352613 & -2.1157 & 0.020679 \tabularnewline
30 & -0.310783 & -1.8647 & 0.035196 \tabularnewline
31 & -0.273568 & -1.6414 & 0.054711 \tabularnewline
32 & -0.219795 & -1.3188 & 0.097787 \tabularnewline
33 & -0.184934 & -1.1096 & 0.137263 \tabularnewline
34 & -0.129049 & -0.7743 & 0.221907 \tabularnewline
35 & -0.071298 & -0.4278 & 0.335676 \tabularnewline
36 & NA & NA & NA \tabularnewline
37 & NA & NA & NA \tabularnewline
38 & NA & NA & NA \tabularnewline
39 & NA & NA & NA \tabularnewline
40 & NA & NA & NA \tabularnewline
41 & NA & NA & NA \tabularnewline
42 & NA & NA & NA \tabularnewline
43 & NA & NA & NA \tabularnewline
44 & NA & NA & NA \tabularnewline
45 & NA & NA & NA \tabularnewline
46 & NA & NA & NA \tabularnewline
47 & NA & NA & NA \tabularnewline
48 & NA & NA & NA \tabularnewline
\hline
\end{tabular}
%Source: https://freestatistics.org/blog/index.php?pk=298838&T=1

[TABLE]
[ROW][C]Autocorrelation Function[/C][/ROW]
[ROW][C]Time lag k[/C][C]ACF(k)[/C][C]T-STAT[/C][C]P-value[/C][/ROW]
[ROW][C]1[/C][C]0.906834[/C][C]5.441[/C][C]2e-06[/C][/ROW]
[ROW][C]2[/C][C]0.832794[/C][C]4.9968[/C][C]8e-06[/C][/ROW]
[ROW][C]3[/C][C]0.748573[/C][C]4.4914[/C][C]3.5e-05[/C][/ROW]
[ROW][C]4[/C][C]0.687663[/C][C]4.126[/C][C]0.000104[/C][/ROW]
[ROW][C]5[/C][C]0.59188[/C][C]3.5513[/C][C]0.000545[/C][/ROW]
[ROW][C]6[/C][C]0.520567[/C][C]3.1234[/C][C]0.00176[/C][/ROW]
[ROW][C]7[/C][C]0.433345[/C][C]2.6001[/C][C]0.006717[/C][/ROW]
[ROW][C]8[/C][C]0.359632[/C][C]2.1578[/C][C]0.018846[/C][/ROW]
[ROW][C]9[/C][C]0.26417[/C][C]1.585[/C][C]0.060854[/C][/ROW]
[ROW][C]10[/C][C]0.192748[/C][C]1.1565[/C][C]0.127549[/C][/ROW]
[ROW][C]11[/C][C]0.114908[/C][C]0.6894[/C][C]0.24748[/C][/ROW]
[ROW][C]12[/C][C]0.05603[/C][C]0.3362[/C][C]0.369342[/C][/ROW]
[ROW][C]13[/C][C]-0.015895[/C][C]-0.0954[/C][C]0.462275[/C][/ROW]
[ROW][C]14[/C][C]-0.066606[/C][C]-0.3996[/C][C]0.345894[/C][/ROW]
[ROW][C]15[/C][C]-0.117832[/C][C]-0.707[/C][C]0.242062[/C][/ROW]
[ROW][C]16[/C][C]-0.161502[/C][C]-0.969[/C][C]0.169502[/C][/ROW]
[ROW][C]17[/C][C]-0.207262[/C][C]-1.2436[/C][C]0.110847[/C][/ROW]
[ROW][C]18[/C][C]-0.242403[/C][C]-1.4544[/C][C]0.077247[/C][/ROW]
[ROW][C]19[/C][C]-0.290981[/C][C]-1.7459[/C][C]0.04468[/C][/ROW]
[ROW][C]20[/C][C]-0.327128[/C][C]-1.9628[/C][C]0.028718[/C][/ROW]
[ROW][C]21[/C][C]-0.366346[/C][C]-2.1981[/C][C]0.017229[/C][/ROW]
[ROW][C]22[/C][C]-0.393964[/C][C]-2.3638[/C][C]0.011803[/C][/ROW]
[ROW][C]23[/C][C]-0.419559[/C][C]-2.5174[/C][C]0.008208[/C][/ROW]
[ROW][C]24[/C][C]-0.419067[/C][C]-2.5144[/C][C]0.008266[/C][/ROW]
[ROW][C]25[/C][C]-0.431161[/C][C]-2.587[/C][C]0.006935[/C][/ROW]
[ROW][C]26[/C][C]-0.421524[/C][C]-2.5291[/C][C]0.007978[/C][/ROW]
[ROW][C]27[/C][C]-0.410382[/C][C]-2.4623[/C][C]0.009362[/C][/ROW]
[ROW][C]28[/C][C]-0.375492[/C][C]-2.253[/C][C]0.015226[/C][/ROW]
[ROW][C]29[/C][C]-0.352613[/C][C]-2.1157[/C][C]0.020679[/C][/ROW]
[ROW][C]30[/C][C]-0.310783[/C][C]-1.8647[/C][C]0.035196[/C][/ROW]
[ROW][C]31[/C][C]-0.273568[/C][C]-1.6414[/C][C]0.054711[/C][/ROW]
[ROW][C]32[/C][C]-0.219795[/C][C]-1.3188[/C][C]0.097787[/C][/ROW]
[ROW][C]33[/C][C]-0.184934[/C][C]-1.1096[/C][C]0.137263[/C][/ROW]
[ROW][C]34[/C][C]-0.129049[/C][C]-0.7743[/C][C]0.221907[/C][/ROW]
[ROW][C]35[/C][C]-0.071298[/C][C]-0.4278[/C][C]0.335676[/C][/ROW]
[ROW][C]36[/C][C]NA[/C][C]NA[/C][C]NA[/C][/ROW]
[ROW][C]37[/C][C]NA[/C][C]NA[/C][C]NA[/C][/ROW]
[ROW][C]38[/C][C]NA[/C][C]NA[/C][C]NA[/C][/ROW]
[ROW][C]39[/C][C]NA[/C][C]NA[/C][C]NA[/C][/ROW]
[ROW][C]40[/C][C]NA[/C][C]NA[/C][C]NA[/C][/ROW]
[ROW][C]41[/C][C]NA[/C][C]NA[/C][C]NA[/C][/ROW]
[ROW][C]42[/C][C]NA[/C][C]NA[/C][C]NA[/C][/ROW]
[ROW][C]43[/C][C]NA[/C][C]NA[/C][C]NA[/C][/ROW]
[ROW][C]44[/C][C]NA[/C][C]NA[/C][C]NA[/C][/ROW]
[ROW][C]45[/C][C]NA[/C][C]NA[/C][C]NA[/C][/ROW]
[ROW][C]46[/C][C]NA[/C][C]NA[/C][C]NA[/C][/ROW]
[ROW][C]47[/C][C]NA[/C][C]NA[/C][C]NA[/C][/ROW]
[ROW][C]48[/C][C]NA[/C][C]NA[/C][C]NA[/C][/ROW]
[/TABLE]
Source: https://freestatistics.org/blog/index.php?pk=298838&T=1

Globally Unique Identifier (entire table): ba.freestatistics.org/blog/index.php?pk=298838&T=1

As an alternative you can also use a QR Code:  

The GUIDs for individual cells are displayed in the table below:

Autocorrelation Function
Time lag kACF(k)T-STATP-value
10.9068345.4412e-06
20.8327944.99688e-06
30.7485734.49143.5e-05
40.6876634.1260.000104
50.591883.55130.000545
60.5205673.12340.00176
70.4333452.60010.006717
80.3596322.15780.018846
90.264171.5850.060854
100.1927481.15650.127549
110.1149080.68940.24748
120.056030.33620.369342
13-0.015895-0.09540.462275
14-0.066606-0.39960.345894
15-0.117832-0.7070.242062
16-0.161502-0.9690.169502
17-0.207262-1.24360.110847
18-0.242403-1.45440.077247
19-0.290981-1.74590.04468
20-0.327128-1.96280.028718
21-0.366346-2.19810.017229
22-0.393964-2.36380.011803
23-0.419559-2.51740.008208
24-0.419067-2.51440.008266
25-0.431161-2.5870.006935
26-0.421524-2.52910.007978
27-0.410382-2.46230.009362
28-0.375492-2.2530.015226
29-0.352613-2.11570.020679
30-0.310783-1.86470.035196
31-0.273568-1.64140.054711
32-0.219795-1.31880.097787
33-0.184934-1.10960.137263
34-0.129049-0.77430.221907
35-0.071298-0.42780.335676
36NANANA
37NANANA
38NANANA
39NANANA
40NANANA
41NANANA
42NANANA
43NANANA
44NANANA
45NANANA
46NANANA
47NANANA
48NANANA


Partial Autocorrelation Function
Time lag kPACF(k)T-STATP-value
10.9068345.4412e-06
20.0588050.35280.363137
3-0.087831-0.5270.300718
40.0747430.44850.328254
5-0.211512-1.26910.10628
60.0445720.26740.395332
7-0.098588-0.59150.278932
8-0.036025-0.21620.415045
9-0.120727-0.72440.236763
100.0060780.03650.485556
11-0.042273-0.25360.40061
12-0.003424-0.02050.49186
13-0.068739-0.41240.341234
14-0.002972-0.01780.492935
15-0.005944-0.03570.485873
16-0.065284-0.39170.348793
17-0.016596-0.09960.460617
18-0.051386-0.30830.37981
19-0.115129-0.69080.247068
20-0.02695-0.16170.436224
21-0.062728-0.37640.354427
22-0.043786-0.26270.397134
23-0.010915-0.06550.474073
240.0635490.38130.352613
25-0.084174-0.5050.308303
260.0515680.30940.379398
270.0136640.0820.467557
280.0525290.31520.377226
29-0.025906-0.15540.438674
300.0268670.16120.436417
310.0127310.07640.469768
320.0192950.11580.45424
33-0.041922-0.25150.401417
340.0622820.37370.355412
350.0831730.4990.310394
36NANANA
37NANANA
38NANANA
39NANANA
40NANANA
41NANANA
42NANANA
43NANANA
44NANANA
45NANANA
46NANANA
47NANANA
48NANANA

\begin{tabular}{lllllllll}
\hline
Partial Autocorrelation Function \tabularnewline
Time lag k & PACF(k) & T-STAT & P-value \tabularnewline
1 & 0.906834 & 5.441 & 2e-06 \tabularnewline
2 & 0.058805 & 0.3528 & 0.363137 \tabularnewline
3 & -0.087831 & -0.527 & 0.300718 \tabularnewline
4 & 0.074743 & 0.4485 & 0.328254 \tabularnewline
5 & -0.211512 & -1.2691 & 0.10628 \tabularnewline
6 & 0.044572 & 0.2674 & 0.395332 \tabularnewline
7 & -0.098588 & -0.5915 & 0.278932 \tabularnewline
8 & -0.036025 & -0.2162 & 0.415045 \tabularnewline
9 & -0.120727 & -0.7244 & 0.236763 \tabularnewline
10 & 0.006078 & 0.0365 & 0.485556 \tabularnewline
11 & -0.042273 & -0.2536 & 0.40061 \tabularnewline
12 & -0.003424 & -0.0205 & 0.49186 \tabularnewline
13 & -0.068739 & -0.4124 & 0.341234 \tabularnewline
14 & -0.002972 & -0.0178 & 0.492935 \tabularnewline
15 & -0.005944 & -0.0357 & 0.485873 \tabularnewline
16 & -0.065284 & -0.3917 & 0.348793 \tabularnewline
17 & -0.016596 & -0.0996 & 0.460617 \tabularnewline
18 & -0.051386 & -0.3083 & 0.37981 \tabularnewline
19 & -0.115129 & -0.6908 & 0.247068 \tabularnewline
20 & -0.02695 & -0.1617 & 0.436224 \tabularnewline
21 & -0.062728 & -0.3764 & 0.354427 \tabularnewline
22 & -0.043786 & -0.2627 & 0.397134 \tabularnewline
23 & -0.010915 & -0.0655 & 0.474073 \tabularnewline
24 & 0.063549 & 0.3813 & 0.352613 \tabularnewline
25 & -0.084174 & -0.505 & 0.308303 \tabularnewline
26 & 0.051568 & 0.3094 & 0.379398 \tabularnewline
27 & 0.013664 & 0.082 & 0.467557 \tabularnewline
28 & 0.052529 & 0.3152 & 0.377226 \tabularnewline
29 & -0.025906 & -0.1554 & 0.438674 \tabularnewline
30 & 0.026867 & 0.1612 & 0.436417 \tabularnewline
31 & 0.012731 & 0.0764 & 0.469768 \tabularnewline
32 & 0.019295 & 0.1158 & 0.45424 \tabularnewline
33 & -0.041922 & -0.2515 & 0.401417 \tabularnewline
34 & 0.062282 & 0.3737 & 0.355412 \tabularnewline
35 & 0.083173 & 0.499 & 0.310394 \tabularnewline
36 & NA & NA & NA \tabularnewline
37 & NA & NA & NA \tabularnewline
38 & NA & NA & NA \tabularnewline
39 & NA & NA & NA \tabularnewline
40 & NA & NA & NA \tabularnewline
41 & NA & NA & NA \tabularnewline
42 & NA & NA & NA \tabularnewline
43 & NA & NA & NA \tabularnewline
44 & NA & NA & NA \tabularnewline
45 & NA & NA & NA \tabularnewline
46 & NA & NA & NA \tabularnewline
47 & NA & NA & NA \tabularnewline
48 & NA & NA & NA \tabularnewline
\hline
\end{tabular}
%Source: https://freestatistics.org/blog/index.php?pk=298838&T=2

[TABLE]
[ROW][C]Partial Autocorrelation Function[/C][/ROW]
[ROW][C]Time lag k[/C][C]PACF(k)[/C][C]T-STAT[/C][C]P-value[/C][/ROW]
[ROW][C]1[/C][C]0.906834[/C][C]5.441[/C][C]2e-06[/C][/ROW]
[ROW][C]2[/C][C]0.058805[/C][C]0.3528[/C][C]0.363137[/C][/ROW]
[ROW][C]3[/C][C]-0.087831[/C][C]-0.527[/C][C]0.300718[/C][/ROW]
[ROW][C]4[/C][C]0.074743[/C][C]0.4485[/C][C]0.328254[/C][/ROW]
[ROW][C]5[/C][C]-0.211512[/C][C]-1.2691[/C][C]0.10628[/C][/ROW]
[ROW][C]6[/C][C]0.044572[/C][C]0.2674[/C][C]0.395332[/C][/ROW]
[ROW][C]7[/C][C]-0.098588[/C][C]-0.5915[/C][C]0.278932[/C][/ROW]
[ROW][C]8[/C][C]-0.036025[/C][C]-0.2162[/C][C]0.415045[/C][/ROW]
[ROW][C]9[/C][C]-0.120727[/C][C]-0.7244[/C][C]0.236763[/C][/ROW]
[ROW][C]10[/C][C]0.006078[/C][C]0.0365[/C][C]0.485556[/C][/ROW]
[ROW][C]11[/C][C]-0.042273[/C][C]-0.2536[/C][C]0.40061[/C][/ROW]
[ROW][C]12[/C][C]-0.003424[/C][C]-0.0205[/C][C]0.49186[/C][/ROW]
[ROW][C]13[/C][C]-0.068739[/C][C]-0.4124[/C][C]0.341234[/C][/ROW]
[ROW][C]14[/C][C]-0.002972[/C][C]-0.0178[/C][C]0.492935[/C][/ROW]
[ROW][C]15[/C][C]-0.005944[/C][C]-0.0357[/C][C]0.485873[/C][/ROW]
[ROW][C]16[/C][C]-0.065284[/C][C]-0.3917[/C][C]0.348793[/C][/ROW]
[ROW][C]17[/C][C]-0.016596[/C][C]-0.0996[/C][C]0.460617[/C][/ROW]
[ROW][C]18[/C][C]-0.051386[/C][C]-0.3083[/C][C]0.37981[/C][/ROW]
[ROW][C]19[/C][C]-0.115129[/C][C]-0.6908[/C][C]0.247068[/C][/ROW]
[ROW][C]20[/C][C]-0.02695[/C][C]-0.1617[/C][C]0.436224[/C][/ROW]
[ROW][C]21[/C][C]-0.062728[/C][C]-0.3764[/C][C]0.354427[/C][/ROW]
[ROW][C]22[/C][C]-0.043786[/C][C]-0.2627[/C][C]0.397134[/C][/ROW]
[ROW][C]23[/C][C]-0.010915[/C][C]-0.0655[/C][C]0.474073[/C][/ROW]
[ROW][C]24[/C][C]0.063549[/C][C]0.3813[/C][C]0.352613[/C][/ROW]
[ROW][C]25[/C][C]-0.084174[/C][C]-0.505[/C][C]0.308303[/C][/ROW]
[ROW][C]26[/C][C]0.051568[/C][C]0.3094[/C][C]0.379398[/C][/ROW]
[ROW][C]27[/C][C]0.013664[/C][C]0.082[/C][C]0.467557[/C][/ROW]
[ROW][C]28[/C][C]0.052529[/C][C]0.3152[/C][C]0.377226[/C][/ROW]
[ROW][C]29[/C][C]-0.025906[/C][C]-0.1554[/C][C]0.438674[/C][/ROW]
[ROW][C]30[/C][C]0.026867[/C][C]0.1612[/C][C]0.436417[/C][/ROW]
[ROW][C]31[/C][C]0.012731[/C][C]0.0764[/C][C]0.469768[/C][/ROW]
[ROW][C]32[/C][C]0.019295[/C][C]0.1158[/C][C]0.45424[/C][/ROW]
[ROW][C]33[/C][C]-0.041922[/C][C]-0.2515[/C][C]0.401417[/C][/ROW]
[ROW][C]34[/C][C]0.062282[/C][C]0.3737[/C][C]0.355412[/C][/ROW]
[ROW][C]35[/C][C]0.083173[/C][C]0.499[/C][C]0.310394[/C][/ROW]
[ROW][C]36[/C][C]NA[/C][C]NA[/C][C]NA[/C][/ROW]
[ROW][C]37[/C][C]NA[/C][C]NA[/C][C]NA[/C][/ROW]
[ROW][C]38[/C][C]NA[/C][C]NA[/C][C]NA[/C][/ROW]
[ROW][C]39[/C][C]NA[/C][C]NA[/C][C]NA[/C][/ROW]
[ROW][C]40[/C][C]NA[/C][C]NA[/C][C]NA[/C][/ROW]
[ROW][C]41[/C][C]NA[/C][C]NA[/C][C]NA[/C][/ROW]
[ROW][C]42[/C][C]NA[/C][C]NA[/C][C]NA[/C][/ROW]
[ROW][C]43[/C][C]NA[/C][C]NA[/C][C]NA[/C][/ROW]
[ROW][C]44[/C][C]NA[/C][C]NA[/C][C]NA[/C][/ROW]
[ROW][C]45[/C][C]NA[/C][C]NA[/C][C]NA[/C][/ROW]
[ROW][C]46[/C][C]NA[/C][C]NA[/C][C]NA[/C][/ROW]
[ROW][C]47[/C][C]NA[/C][C]NA[/C][C]NA[/C][/ROW]
[ROW][C]48[/C][C]NA[/C][C]NA[/C][C]NA[/C][/ROW]
[/TABLE]
Source: https://freestatistics.org/blog/index.php?pk=298838&T=2

Globally Unique Identifier (entire table): ba.freestatistics.org/blog/index.php?pk=298838&T=2

As an alternative you can also use a QR Code:  

The GUIDs for individual cells are displayed in the table below:

Partial Autocorrelation Function
Time lag kPACF(k)T-STATP-value
10.9068345.4412e-06
20.0588050.35280.363137
3-0.087831-0.5270.300718
40.0747430.44850.328254
5-0.211512-1.26910.10628
60.0445720.26740.395332
7-0.098588-0.59150.278932
8-0.036025-0.21620.415045
9-0.120727-0.72440.236763
100.0060780.03650.485556
11-0.042273-0.25360.40061
12-0.003424-0.02050.49186
13-0.068739-0.41240.341234
14-0.002972-0.01780.492935
15-0.005944-0.03570.485873
16-0.065284-0.39170.348793
17-0.016596-0.09960.460617
18-0.051386-0.30830.37981
19-0.115129-0.69080.247068
20-0.02695-0.16170.436224
21-0.062728-0.37640.354427
22-0.043786-0.26270.397134
23-0.010915-0.06550.474073
240.0635490.38130.352613
25-0.084174-0.5050.308303
260.0515680.30940.379398
270.0136640.0820.467557
280.0525290.31520.377226
29-0.025906-0.15540.438674
300.0268670.16120.436417
310.0127310.07640.469768
320.0192950.11580.45424
33-0.041922-0.25150.401417
340.0622820.37370.355412
350.0831730.4990.310394
36NANANA
37NANANA
38NANANA
39NANANA
40NANANA
41NANANA
42NANANA
43NANANA
44NANANA
45NANANA
46NANANA
47NANANA
48NANANA


Parameters (Session):
par1 = 48 ; par2 = 1 ; par3 = 1 ; par4 = 1 ; par5 = 12 ; par6 = White Noise ; par7 = 0.95 ;
Parameters (R input):
par1 = 48 ; par2 = 1 ; par3 = 0 ; par4 = 0 ; par5 = 12 ; par6 = White Noise ; par7 = 0.95 ; par8 = ;
R code (references can be found in the software module):
if (par1 == 'Default') {
par1 = 10*log10(length(x))
} else {
par1 <- as.numeric(par1)
}
par2 <- as.numeric(par2)
par3 <- as.numeric(par3)
par4 <- as.numeric(par4)
par5 <- as.numeric(par5)
if (par6 == 'White Noise') par6 <- 'white' else par6 <- 'ma'
par7 <- as.numeric(par7)
if (par8 != '') par8 <- as.numeric(par8)
x <- na.omit(x)
ox <- x
if (par8 == '') {
if (par2 == 0) {
x <- log(x)
} else {
x <- (x ^ par2 - 1) / par2
}
} else {
x <- log(x,base=par8)
}
if (par3 > 0) x <- diff(x,lag=1,difference=par3)
if (par4 > 0) x <- diff(x,lag=par5,difference=par4)
bitmap(file='picts.png')
op <- par(mfrow=c(2,1))
plot(ox,type='l',main='Original Time Series',xlab='time',ylab='value')
if (par8=='') {
mytitle <- paste('Working Time Series (lambda=',par2,', d=',par3,', D=',par4,')',sep='')
mysub <- paste('(lambda=',par2,', d=',par3,', D=',par4,', CI=', par7, ', CI type=',par6,')',sep='')
} else {
mytitle <- paste('Working Time Series (base=',par8,', d=',par3,', D=',par4,')',sep='')
mysub <- paste('(base=',par8,', d=',par3,', D=',par4,', CI=', par7, ', CI type=',par6,')',sep='')
}
plot(x,type='l', main=mytitle,xlab='time',ylab='value')
par(op)
dev.off()
bitmap(file='pic1.png')
racf <- acf(x, par1, main='Autocorrelation', xlab='time lag', ylab='ACF', ci.type=par6, ci=par7, sub=mysub)
dev.off()
bitmap(file='pic2.png')
rpacf <- pacf(x,par1,main='Partial Autocorrelation',xlab='lags',ylab='PACF',sub=mysub)
dev.off()
(myacf <- c(racf$acf))
(mypacf <- c(rpacf$acf))
lengthx <- length(x)
sqrtn <- sqrt(lengthx)
load(file='createtable')
a<-table.start()
a<-table.row.start(a)
a<-table.element(a,'Autocorrelation Function',4,TRUE)
a<-table.row.end(a)
a<-table.row.start(a)
a<-table.element(a,'Time lag k',header=TRUE)
a<-table.element(a,'ACF(k)',header=TRUE)
a<-table.element(a,'T-STAT',header=TRUE)
a<-table.element(a,'P-value',header=TRUE)
a<-table.row.end(a)
for (i in 2:(par1+1)) {
a<-table.row.start(a)
a<-table.element(a,i-1,header=TRUE)
a<-table.element(a,round(myacf[i],6))
mytstat <- myacf[i]*sqrtn
a<-table.element(a,round(mytstat,4))
a<-table.element(a,round(1-pt(abs(mytstat),lengthx),6))
a<-table.row.end(a)
}
a<-table.end(a)
table.save(a,file='mytable.tab')
a<-table.start()
a<-table.row.start(a)
a<-table.element(a,'Partial Autocorrelation Function',4,TRUE)
a<-table.row.end(a)
a<-table.row.start(a)
a<-table.element(a,'Time lag k',header=TRUE)
a<-table.element(a,'PACF(k)',header=TRUE)
a<-table.element(a,'T-STAT',header=TRUE)
a<-table.element(a,'P-value',header=TRUE)
a<-table.row.end(a)
for (i in 1:par1) {
a<-table.row.start(a)
a<-table.element(a,i,header=TRUE)
a<-table.element(a,round(mypacf[i],6))
mytstat <- mypacf[i]*sqrtn
a<-table.element(a,round(mytstat,4))
a<-table.element(a,round(1-pt(abs(mytstat),lengthx),6))
a<-table.row.end(a)
}
a<-table.end(a)
table.save(a,file='mytable1.tab')