Free Statistics

of Irreproducible Research!

Author's title

Author*The author of this computation has been verified*
R Software Modulerwasp_structuraltimeseries.wasp
Title produced by softwareStructural Time Series Models
Date of computationSun, 11 Dec 2016 19:53:31 +0100
Cite this page as followsStatistical Computations at FreeStatistics.org, Office for Research Development and Education, URL https://freestatistics.org/blog/index.php?v=date/2016/Dec/11/t1481482474wog6ozh1kpvxdku.htm/, Retrieved Thu, 02 May 2024 07:50:38 +0000
Statistical Computations at FreeStatistics.org, Office for Research Development and Education, URL https://freestatistics.org/blog/index.php?pk=298849, Retrieved Thu, 02 May 2024 07:50:38 +0000
QR Codes:

Original text written by user:
IsPrivate?No (this computation is public)
User-defined keywords
Estimated Impact48
Family? (F = Feedback message, R = changed R code, M = changed R Module, P = changed Parameters, D = changed Data)
-       [Structural Time Series Models] [Structural Time S...] [2016-12-11 18:53:31] [2322cf848a5cbdeb3105c2829b69db5d] [Current]
Feedback Forum

Post a new message
Dataseries X:
5692.4
5634.45
5555.38
5352.26
5233.07
4880.16
4861.88
4661.93
4330.68
3681.56
3540.08
3328.03
3254.92
3217.27
3301.29
4272.3
4424.8
4449.8
4678
4722.2
4708.9
4121.4
4230.6
4263
4241.9
4309.8
4457.9
4543.9
4937
4917.9
5041.1
5017.2
4833.9
4815.4
4785.9


Summary of computational transaction
Raw Input view raw input (R code)
Raw Outputview raw output of R engine
Computing time3 seconds
R ServerBig Analytics Cloud Computing Center

\begin{tabular}{lllllllll}
\hline
Summary of computational transaction \tabularnewline
Raw Input view raw input (R code)  \tabularnewline
Raw Outputview raw output of R engine  \tabularnewline
Computing time3 seconds \tabularnewline
R ServerBig Analytics Cloud Computing Center \tabularnewline
\hline
\end{tabular}
%Source: https://freestatistics.org/blog/index.php?pk=298849&T=0

[TABLE]
[ROW]
Summary of computational transaction[/C][/ROW] [ROW]Raw Input[/C] view raw input (R code) [/C][/ROW] [ROW]Raw Output[/C]view raw output of R engine [/C][/ROW] [ROW]Computing time[/C]3 seconds[/C][/ROW] [ROW]R Server[/C]Big Analytics Cloud Computing Center[/C][/ROW] [/TABLE] Source: https://freestatistics.org/blog/index.php?pk=298849&T=0

Globally Unique Identifier (entire table): ba.freestatistics.org/blog/index.php?pk=298849&T=0

As an alternative you can also use a QR Code:  

The GUIDs for individual cells are displayed in the table below:

Summary of computational transaction
Raw Input view raw input (R code)
Raw Outputview raw output of R engine
Computing time3 seconds
R ServerBig Analytics Cloud Computing Center


Structural Time Series Model -- Interpolation
tObservedLevelSlopeSeasonalStand. Residuals
15692.45692.4000
25634.455655.30301678617-35.1546266408163-1.09065074649896-0.289613530401299
35555.385568.49106559392-71.4181314515799-1.04659373606973-0.237568537872849
45352.265379.74542098228-151.203557907463-0.807743903537414-0.53022601592142
55233.075232.56337116225-148.442038940946-0.3990698334591180.0180820725099791
64880.164918.17481223554-262.709620257985-0.871935512024383-0.743929931684174
74861.884823.94136655989-146.6424031548370.2503211395793640.755258687148875
84661.934665.20721440824-154.973713885894-0.57194813835887-0.0542133863854673
94330.684364.1759810029-255.60544163555-0.820339535698028-0.65482047807571
103681.563760.6888028866-495.278863698527-1.30637884766677-1.55956822006958
113540.083489.42098774322-340.9503639205090.5483179893657911.00422338095533
123328.033295.3495737735-239.761332235992-0.1758029536402880.658442174451181
133254.923181.54837245563-155.57111836942846.03592425893060.624703716917648
143217.273192.74993086239-54.9127128075814-0.2868008482420620.596134490898309
153301.293271.1812277803336.55055040898490.3988761456378610.597290142296039
164272.34098.20158818688581.1340736369860.497673288736873.50395249324556
174424.84474.66270545981440.650202523569-4.59633052042152-0.911516021989857
184449.84539.00550925613182.036189509872-5.51164189306744-1.68258372831908
1946784687.21666050125158.768272671943-1.68388448074212-0.151406712911246
204722.24747.2514311274490.8369370225404-3.05975711911268-0.442027639956406
214708.94734.1326158006219.3150322940789-2.07832958602329-0.465395071354418
224121.44242.13336741806-332.452624386222-6.85259249088548-2.2889695574676
234230.64171.78994001236-152.1349707367530.4342412963724121.17333615041648
2442634220.22905177385-14.1608813063556-1.896592827361040.897805328348776
254241.94211.15633796771-10.714461710275729.62727835549020.0241092924148857
264309.84293.6698732588948.04907851205010.06706603398110.361477423560926
274457.94441.14304405513116.180245489558-5.298345809842710.444673280737044
284543.94543.88819491659106.940818064032.96322599668745-0.0596598075780545
2949374884.44980925552267.1852097484440.9915982024833741.0406103127572
304917.94965.7788219983139.594449038138-6.70065314028979-0.830157401493274
315041.15053.16897850151103.732317997791-0.491979711986354-0.233358062097937
325017.25044.9408857018326.8093865198162-2.90904418944149-0.500537352915215
334833.94875.90961256431-107.7407821179571.42543620403001-0.875522616621847
344815.44811.91099469666-77.6892647916675-6.212163786295670.195546732322784
354785.94776.05797342204-48.94776181191030.5637498848357460.187022425651466

\begin{tabular}{lllllllll}
\hline
Structural Time Series Model -- Interpolation \tabularnewline
t & Observed & Level & Slope & Seasonal & Stand. Residuals \tabularnewline
1 & 5692.4 & 5692.4 & 0 & 0 & 0 \tabularnewline
2 & 5634.45 & 5655.30301678617 & -35.1546266408163 & -1.09065074649896 & -0.289613530401299 \tabularnewline
3 & 5555.38 & 5568.49106559392 & -71.4181314515799 & -1.04659373606973 & -0.237568537872849 \tabularnewline
4 & 5352.26 & 5379.74542098228 & -151.203557907463 & -0.807743903537414 & -0.53022601592142 \tabularnewline
5 & 5233.07 & 5232.56337116225 & -148.442038940946 & -0.399069833459118 & 0.0180820725099791 \tabularnewline
6 & 4880.16 & 4918.17481223554 & -262.709620257985 & -0.871935512024383 & -0.743929931684174 \tabularnewline
7 & 4861.88 & 4823.94136655989 & -146.642403154837 & 0.250321139579364 & 0.755258687148875 \tabularnewline
8 & 4661.93 & 4665.20721440824 & -154.973713885894 & -0.57194813835887 & -0.0542133863854673 \tabularnewline
9 & 4330.68 & 4364.1759810029 & -255.60544163555 & -0.820339535698028 & -0.65482047807571 \tabularnewline
10 & 3681.56 & 3760.6888028866 & -495.278863698527 & -1.30637884766677 & -1.55956822006958 \tabularnewline
11 & 3540.08 & 3489.42098774322 & -340.950363920509 & 0.548317989365791 & 1.00422338095533 \tabularnewline
12 & 3328.03 & 3295.3495737735 & -239.761332235992 & -0.175802953640288 & 0.658442174451181 \tabularnewline
13 & 3254.92 & 3181.54837245563 & -155.571118369428 & 46.0359242589306 & 0.624703716917648 \tabularnewline
14 & 3217.27 & 3192.74993086239 & -54.9127128075814 & -0.286800848242062 & 0.596134490898309 \tabularnewline
15 & 3301.29 & 3271.18122778033 & 36.5505504089849 & 0.398876145637861 & 0.597290142296039 \tabularnewline
16 & 4272.3 & 4098.20158818688 & 581.134073636986 & 0.49767328873687 & 3.50395249324556 \tabularnewline
17 & 4424.8 & 4474.66270545981 & 440.650202523569 & -4.59633052042152 & -0.911516021989857 \tabularnewline
18 & 4449.8 & 4539.00550925613 & 182.036189509872 & -5.51164189306744 & -1.68258372831908 \tabularnewline
19 & 4678 & 4687.21666050125 & 158.768272671943 & -1.68388448074212 & -0.151406712911246 \tabularnewline
20 & 4722.2 & 4747.25143112744 & 90.8369370225404 & -3.05975711911268 & -0.442027639956406 \tabularnewline
21 & 4708.9 & 4734.13261580062 & 19.3150322940789 & -2.07832958602329 & -0.465395071354418 \tabularnewline
22 & 4121.4 & 4242.13336741806 & -332.452624386222 & -6.85259249088548 & -2.2889695574676 \tabularnewline
23 & 4230.6 & 4171.78994001236 & -152.134970736753 & 0.434241296372412 & 1.17333615041648 \tabularnewline
24 & 4263 & 4220.22905177385 & -14.1608813063556 & -1.89659282736104 & 0.897805328348776 \tabularnewline
25 & 4241.9 & 4211.15633796771 & -10.7144617102757 & 29.6272783554902 & 0.0241092924148857 \tabularnewline
26 & 4309.8 & 4293.66987325889 & 48.0490785120501 & 0.0670660339811 & 0.361477423560926 \tabularnewline
27 & 4457.9 & 4441.14304405513 & 116.180245489558 & -5.29834580984271 & 0.444673280737044 \tabularnewline
28 & 4543.9 & 4543.88819491659 & 106.94081806403 & 2.96322599668745 & -0.0596598075780545 \tabularnewline
29 & 4937 & 4884.44980925552 & 267.185209748444 & 0.991598202483374 & 1.0406103127572 \tabularnewline
30 & 4917.9 & 4965.7788219983 & 139.594449038138 & -6.70065314028979 & -0.830157401493274 \tabularnewline
31 & 5041.1 & 5053.16897850151 & 103.732317997791 & -0.491979711986354 & -0.233358062097937 \tabularnewline
32 & 5017.2 & 5044.94088570183 & 26.8093865198162 & -2.90904418944149 & -0.500537352915215 \tabularnewline
33 & 4833.9 & 4875.90961256431 & -107.740782117957 & 1.42543620403001 & -0.875522616621847 \tabularnewline
34 & 4815.4 & 4811.91099469666 & -77.6892647916675 & -6.21216378629567 & 0.195546732322784 \tabularnewline
35 & 4785.9 & 4776.05797342204 & -48.9477618119103 & 0.563749884835746 & 0.187022425651466 \tabularnewline
\hline
\end{tabular}
%Source: https://freestatistics.org/blog/index.php?pk=298849&T=1

[TABLE]
[ROW][C]Structural Time Series Model -- Interpolation[/C][/ROW]
[ROW][C]t[/C][C]Observed[/C][C]Level[/C][C]Slope[/C][C]Seasonal[/C][C]Stand. Residuals[/C][/ROW]
[ROW][C]1[/C][C]5692.4[/C][C]5692.4[/C][C]0[/C][C]0[/C][C]0[/C][/ROW]
[ROW][C]2[/C][C]5634.45[/C][C]5655.30301678617[/C][C]-35.1546266408163[/C][C]-1.09065074649896[/C][C]-0.289613530401299[/C][/ROW]
[ROW][C]3[/C][C]5555.38[/C][C]5568.49106559392[/C][C]-71.4181314515799[/C][C]-1.04659373606973[/C][C]-0.237568537872849[/C][/ROW]
[ROW][C]4[/C][C]5352.26[/C][C]5379.74542098228[/C][C]-151.203557907463[/C][C]-0.807743903537414[/C][C]-0.53022601592142[/C][/ROW]
[ROW][C]5[/C][C]5233.07[/C][C]5232.56337116225[/C][C]-148.442038940946[/C][C]-0.399069833459118[/C][C]0.0180820725099791[/C][/ROW]
[ROW][C]6[/C][C]4880.16[/C][C]4918.17481223554[/C][C]-262.709620257985[/C][C]-0.871935512024383[/C][C]-0.743929931684174[/C][/ROW]
[ROW][C]7[/C][C]4861.88[/C][C]4823.94136655989[/C][C]-146.642403154837[/C][C]0.250321139579364[/C][C]0.755258687148875[/C][/ROW]
[ROW][C]8[/C][C]4661.93[/C][C]4665.20721440824[/C][C]-154.973713885894[/C][C]-0.57194813835887[/C][C]-0.0542133863854673[/C][/ROW]
[ROW][C]9[/C][C]4330.68[/C][C]4364.1759810029[/C][C]-255.60544163555[/C][C]-0.820339535698028[/C][C]-0.65482047807571[/C][/ROW]
[ROW][C]10[/C][C]3681.56[/C][C]3760.6888028866[/C][C]-495.278863698527[/C][C]-1.30637884766677[/C][C]-1.55956822006958[/C][/ROW]
[ROW][C]11[/C][C]3540.08[/C][C]3489.42098774322[/C][C]-340.950363920509[/C][C]0.548317989365791[/C][C]1.00422338095533[/C][/ROW]
[ROW][C]12[/C][C]3328.03[/C][C]3295.3495737735[/C][C]-239.761332235992[/C][C]-0.175802953640288[/C][C]0.658442174451181[/C][/ROW]
[ROW][C]13[/C][C]3254.92[/C][C]3181.54837245563[/C][C]-155.571118369428[/C][C]46.0359242589306[/C][C]0.624703716917648[/C][/ROW]
[ROW][C]14[/C][C]3217.27[/C][C]3192.74993086239[/C][C]-54.9127128075814[/C][C]-0.286800848242062[/C][C]0.596134490898309[/C][/ROW]
[ROW][C]15[/C][C]3301.29[/C][C]3271.18122778033[/C][C]36.5505504089849[/C][C]0.398876145637861[/C][C]0.597290142296039[/C][/ROW]
[ROW][C]16[/C][C]4272.3[/C][C]4098.20158818688[/C][C]581.134073636986[/C][C]0.49767328873687[/C][C]3.50395249324556[/C][/ROW]
[ROW][C]17[/C][C]4424.8[/C][C]4474.66270545981[/C][C]440.650202523569[/C][C]-4.59633052042152[/C][C]-0.911516021989857[/C][/ROW]
[ROW][C]18[/C][C]4449.8[/C][C]4539.00550925613[/C][C]182.036189509872[/C][C]-5.51164189306744[/C][C]-1.68258372831908[/C][/ROW]
[ROW][C]19[/C][C]4678[/C][C]4687.21666050125[/C][C]158.768272671943[/C][C]-1.68388448074212[/C][C]-0.151406712911246[/C][/ROW]
[ROW][C]20[/C][C]4722.2[/C][C]4747.25143112744[/C][C]90.8369370225404[/C][C]-3.05975711911268[/C][C]-0.442027639956406[/C][/ROW]
[ROW][C]21[/C][C]4708.9[/C][C]4734.13261580062[/C][C]19.3150322940789[/C][C]-2.07832958602329[/C][C]-0.465395071354418[/C][/ROW]
[ROW][C]22[/C][C]4121.4[/C][C]4242.13336741806[/C][C]-332.452624386222[/C][C]-6.85259249088548[/C][C]-2.2889695574676[/C][/ROW]
[ROW][C]23[/C][C]4230.6[/C][C]4171.78994001236[/C][C]-152.134970736753[/C][C]0.434241296372412[/C][C]1.17333615041648[/C][/ROW]
[ROW][C]24[/C][C]4263[/C][C]4220.22905177385[/C][C]-14.1608813063556[/C][C]-1.89659282736104[/C][C]0.897805328348776[/C][/ROW]
[ROW][C]25[/C][C]4241.9[/C][C]4211.15633796771[/C][C]-10.7144617102757[/C][C]29.6272783554902[/C][C]0.0241092924148857[/C][/ROW]
[ROW][C]26[/C][C]4309.8[/C][C]4293.66987325889[/C][C]48.0490785120501[/C][C]0.0670660339811[/C][C]0.361477423560926[/C][/ROW]
[ROW][C]27[/C][C]4457.9[/C][C]4441.14304405513[/C][C]116.180245489558[/C][C]-5.29834580984271[/C][C]0.444673280737044[/C][/ROW]
[ROW][C]28[/C][C]4543.9[/C][C]4543.88819491659[/C][C]106.94081806403[/C][C]2.96322599668745[/C][C]-0.0596598075780545[/C][/ROW]
[ROW][C]29[/C][C]4937[/C][C]4884.44980925552[/C][C]267.185209748444[/C][C]0.991598202483374[/C][C]1.0406103127572[/C][/ROW]
[ROW][C]30[/C][C]4917.9[/C][C]4965.7788219983[/C][C]139.594449038138[/C][C]-6.70065314028979[/C][C]-0.830157401493274[/C][/ROW]
[ROW][C]31[/C][C]5041.1[/C][C]5053.16897850151[/C][C]103.732317997791[/C][C]-0.491979711986354[/C][C]-0.233358062097937[/C][/ROW]
[ROW][C]32[/C][C]5017.2[/C][C]5044.94088570183[/C][C]26.8093865198162[/C][C]-2.90904418944149[/C][C]-0.500537352915215[/C][/ROW]
[ROW][C]33[/C][C]4833.9[/C][C]4875.90961256431[/C][C]-107.740782117957[/C][C]1.42543620403001[/C][C]-0.875522616621847[/C][/ROW]
[ROW][C]34[/C][C]4815.4[/C][C]4811.91099469666[/C][C]-77.6892647916675[/C][C]-6.21216378629567[/C][C]0.195546732322784[/C][/ROW]
[ROW][C]35[/C][C]4785.9[/C][C]4776.05797342204[/C][C]-48.9477618119103[/C][C]0.563749884835746[/C][C]0.187022425651466[/C][/ROW]
[/TABLE]
Source: https://freestatistics.org/blog/index.php?pk=298849&T=1

Globally Unique Identifier (entire table): ba.freestatistics.org/blog/index.php?pk=298849&T=1

As an alternative you can also use a QR Code:  

The GUIDs for individual cells are displayed in the table below:

Structural Time Series Model -- Interpolation
tObservedLevelSlopeSeasonalStand. Residuals
15692.45692.4000
25634.455655.30301678617-35.1546266408163-1.09065074649896-0.289613530401299
35555.385568.49106559392-71.4181314515799-1.04659373606973-0.237568537872849
45352.265379.74542098228-151.203557907463-0.807743903537414-0.53022601592142
55233.075232.56337116225-148.442038940946-0.3990698334591180.0180820725099791
64880.164918.17481223554-262.709620257985-0.871935512024383-0.743929931684174
74861.884823.94136655989-146.6424031548370.2503211395793640.755258687148875
84661.934665.20721440824-154.973713885894-0.57194813835887-0.0542133863854673
94330.684364.1759810029-255.60544163555-0.820339535698028-0.65482047807571
103681.563760.6888028866-495.278863698527-1.30637884766677-1.55956822006958
113540.083489.42098774322-340.9503639205090.5483179893657911.00422338095533
123328.033295.3495737735-239.761332235992-0.1758029536402880.658442174451181
133254.923181.54837245563-155.57111836942846.03592425893060.624703716917648
143217.273192.74993086239-54.9127128075814-0.2868008482420620.596134490898309
153301.293271.1812277803336.55055040898490.3988761456378610.597290142296039
164272.34098.20158818688581.1340736369860.497673288736873.50395249324556
174424.84474.66270545981440.650202523569-4.59633052042152-0.911516021989857
184449.84539.00550925613182.036189509872-5.51164189306744-1.68258372831908
1946784687.21666050125158.768272671943-1.68388448074212-0.151406712911246
204722.24747.2514311274490.8369370225404-3.05975711911268-0.442027639956406
214708.94734.1326158006219.3150322940789-2.07832958602329-0.465395071354418
224121.44242.13336741806-332.452624386222-6.85259249088548-2.2889695574676
234230.64171.78994001236-152.1349707367530.4342412963724121.17333615041648
2442634220.22905177385-14.1608813063556-1.896592827361040.897805328348776
254241.94211.15633796771-10.714461710275729.62727835549020.0241092924148857
264309.84293.6698732588948.04907851205010.06706603398110.361477423560926
274457.94441.14304405513116.180245489558-5.298345809842710.444673280737044
284543.94543.88819491659106.940818064032.96322599668745-0.0596598075780545
2949374884.44980925552267.1852097484440.9915982024833741.0406103127572
304917.94965.7788219983139.594449038138-6.70065314028979-0.830157401493274
315041.15053.16897850151103.732317997791-0.491979711986354-0.233358062097937
325017.25044.9408857018326.8093865198162-2.90904418944149-0.500537352915215
334833.94875.90961256431-107.7407821179571.42543620403001-0.875522616621847
344815.44811.91099469666-77.6892647916675-6.212163786295670.195546732322784
354785.94776.05797342204-48.94776181191030.5637498848357460.187022425651466


Structural Time Series Model -- Extrapolation
tObservedLevelSeasonal
14924.739864349455237.79351055418-313.053646204735
25020.706925901335386.1278518566-365.420925955268
35230.24019386865534.46219315902-304.221999290412
45502.213513815265682.79653446143-180.583020646176
55974.39025222725831.13087576385143.259376463355
66325.983374019595979.46521706626346.518156953328
76391.784132763596127.79955836868263.984574394909
86672.031135716616276.13389967109395.897236045515
96779.539386238386424.46824097351355.071145264868
106741.217534534026572.80258227593168.414952258095
116495.282622724726721.13692357834-225.854300853619
126585.45971645096869.47126488076-284.011548429859
136704.751959978447017.80560618317-313.053646204735
146800.719021530327166.13994748559-365.420925955268
157010.252289497597314.47428878801-304.221999290412
167282.225609444257462.80863009042-180.583020646176
177754.402347856197611.14297139284143.259376463355
188105.995469648587759.47731269525346.518156953328

\begin{tabular}{lllllllll}
\hline
Structural Time Series Model -- Extrapolation \tabularnewline
t & Observed & Level & Seasonal \tabularnewline
1 & 4924.73986434945 & 5237.79351055418 & -313.053646204735 \tabularnewline
2 & 5020.70692590133 & 5386.1278518566 & -365.420925955268 \tabularnewline
3 & 5230.2401938686 & 5534.46219315902 & -304.221999290412 \tabularnewline
4 & 5502.21351381526 & 5682.79653446143 & -180.583020646176 \tabularnewline
5 & 5974.3902522272 & 5831.13087576385 & 143.259376463355 \tabularnewline
6 & 6325.98337401959 & 5979.46521706626 & 346.518156953328 \tabularnewline
7 & 6391.78413276359 & 6127.79955836868 & 263.984574394909 \tabularnewline
8 & 6672.03113571661 & 6276.13389967109 & 395.897236045515 \tabularnewline
9 & 6779.53938623838 & 6424.46824097351 & 355.071145264868 \tabularnewline
10 & 6741.21753453402 & 6572.80258227593 & 168.414952258095 \tabularnewline
11 & 6495.28262272472 & 6721.13692357834 & -225.854300853619 \tabularnewline
12 & 6585.4597164509 & 6869.47126488076 & -284.011548429859 \tabularnewline
13 & 6704.75195997844 & 7017.80560618317 & -313.053646204735 \tabularnewline
14 & 6800.71902153032 & 7166.13994748559 & -365.420925955268 \tabularnewline
15 & 7010.25228949759 & 7314.47428878801 & -304.221999290412 \tabularnewline
16 & 7282.22560944425 & 7462.80863009042 & -180.583020646176 \tabularnewline
17 & 7754.40234785619 & 7611.14297139284 & 143.259376463355 \tabularnewline
18 & 8105.99546964858 & 7759.47731269525 & 346.518156953328 \tabularnewline
\hline
\end{tabular}
%Source: https://freestatistics.org/blog/index.php?pk=298849&T=2

[TABLE]
[ROW][C]Structural Time Series Model -- Extrapolation[/C][/ROW]
[ROW][C]t[/C][C]Observed[/C][C]Level[/C][C]Seasonal[/C][/ROW]
[ROW][C]1[/C][C]4924.73986434945[/C][C]5237.79351055418[/C][C]-313.053646204735[/C][/ROW]
[ROW][C]2[/C][C]5020.70692590133[/C][C]5386.1278518566[/C][C]-365.420925955268[/C][/ROW]
[ROW][C]3[/C][C]5230.2401938686[/C][C]5534.46219315902[/C][C]-304.221999290412[/C][/ROW]
[ROW][C]4[/C][C]5502.21351381526[/C][C]5682.79653446143[/C][C]-180.583020646176[/C][/ROW]
[ROW][C]5[/C][C]5974.3902522272[/C][C]5831.13087576385[/C][C]143.259376463355[/C][/ROW]
[ROW][C]6[/C][C]6325.98337401959[/C][C]5979.46521706626[/C][C]346.518156953328[/C][/ROW]
[ROW][C]7[/C][C]6391.78413276359[/C][C]6127.79955836868[/C][C]263.984574394909[/C][/ROW]
[ROW][C]8[/C][C]6672.03113571661[/C][C]6276.13389967109[/C][C]395.897236045515[/C][/ROW]
[ROW][C]9[/C][C]6779.53938623838[/C][C]6424.46824097351[/C][C]355.071145264868[/C][/ROW]
[ROW][C]10[/C][C]6741.21753453402[/C][C]6572.80258227593[/C][C]168.414952258095[/C][/ROW]
[ROW][C]11[/C][C]6495.28262272472[/C][C]6721.13692357834[/C][C]-225.854300853619[/C][/ROW]
[ROW][C]12[/C][C]6585.4597164509[/C][C]6869.47126488076[/C][C]-284.011548429859[/C][/ROW]
[ROW][C]13[/C][C]6704.75195997844[/C][C]7017.80560618317[/C][C]-313.053646204735[/C][/ROW]
[ROW][C]14[/C][C]6800.71902153032[/C][C]7166.13994748559[/C][C]-365.420925955268[/C][/ROW]
[ROW][C]15[/C][C]7010.25228949759[/C][C]7314.47428878801[/C][C]-304.221999290412[/C][/ROW]
[ROW][C]16[/C][C]7282.22560944425[/C][C]7462.80863009042[/C][C]-180.583020646176[/C][/ROW]
[ROW][C]17[/C][C]7754.40234785619[/C][C]7611.14297139284[/C][C]143.259376463355[/C][/ROW]
[ROW][C]18[/C][C]8105.99546964858[/C][C]7759.47731269525[/C][C]346.518156953328[/C][/ROW]
[/TABLE]
Source: https://freestatistics.org/blog/index.php?pk=298849&T=2

Globally Unique Identifier (entire table): ba.freestatistics.org/blog/index.php?pk=298849&T=2

As an alternative you can also use a QR Code:  

The GUIDs for individual cells are displayed in the table below:

Structural Time Series Model -- Extrapolation
tObservedLevelSeasonal
14924.739864349455237.79351055418-313.053646204735
25020.706925901335386.1278518566-365.420925955268
35230.24019386865534.46219315902-304.221999290412
45502.213513815265682.79653446143-180.583020646176
55974.39025222725831.13087576385143.259376463355
66325.983374019595979.46521706626346.518156953328
76391.784132763596127.79955836868263.984574394909
86672.031135716616276.13389967109395.897236045515
96779.539386238386424.46824097351355.071145264868
106741.217534534026572.80258227593168.414952258095
116495.282622724726721.13692357834-225.854300853619
126585.45971645096869.47126488076-284.011548429859
136704.751959978447017.80560618317-313.053646204735
146800.719021530327166.13994748559-365.420925955268
157010.252289497597314.47428878801-304.221999290412
167282.225609444257462.80863009042-180.583020646176
177754.402347856197611.14297139284143.259376463355
188105.995469648587759.47731269525346.518156953328


Parameters (Session):
par1 = 12 ; par2 = 18 ; par3 = BFGS ;
Parameters (R input):
par1 = 12 ; par2 = 18 ; par3 = BFGS ;
R code (references can be found in the software module):
require('stsm')
require('stsm.class')
require('KFKSDS')
par1 <- as.numeric(par1)
par2 <- as.numeric(par2)
nx <- length(x)
x <- ts(x,frequency=par1)
m <- StructTS(x,type='BSM')
print(m$coef)
print(m$fitted)
print(m$resid)
mylevel <- as.numeric(m$fitted[,'level'])
myslope <- as.numeric(m$fitted[,'slope'])
myseas <- as.numeric(m$fitted[,'sea'])
myresid <- as.numeric(m$resid)
myfit <- mylevel+myseas
mm <- stsm.model(model = 'BSM', y = x, transPars = 'StructTS')
fit2 <- stsmFit(mm, stsm.method = 'maxlik.td.optim', method = par3, KF.args = list(P0cov = TRUE))
(fit2.comps <- tsSmooth(fit2, P0cov = FALSE)$states)
m2 <- set.pars(mm, pmax(fit2$par, .Machine$double.eps))
(ss <- char2numeric(m2))
(pred <- predict(ss, x, n.ahead = par2))
mylagmax <- nx/2
bitmap(file='test2.png')
op <- par(mfrow = c(2,2))
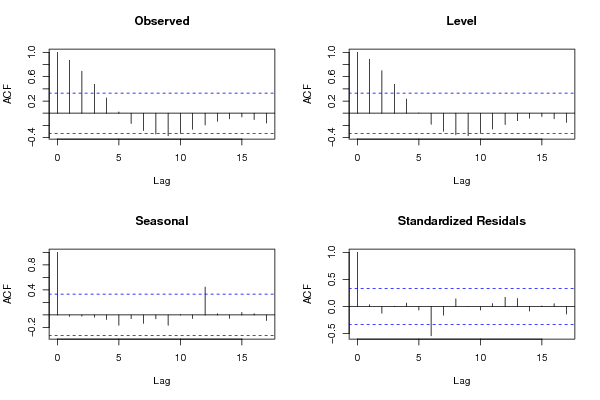
acf(as.numeric(x),lag.max = mylagmax,main='Observed')
acf(mylevel,na.action=na.pass,lag.max = mylagmax,main='Level')
acf(myseas,na.action=na.pass,lag.max = mylagmax,main='Seasonal')
acf(myresid,na.action=na.pass,lag.max = mylagmax,main='Standardized Residals')
par(op)
dev.off()
bitmap(file='test3.png')
op <- par(mfrow = c(2,2))
spectrum(as.numeric(x),main='Observed')
spectrum(mylevel,main='Level')
spectrum(myseas,main='Seasonal')
spectrum(myresid,main='Standardized Residals')
par(op)
dev.off()
bitmap(file='test4.png')
op <- par(mfrow = c(2,2))
cpgram(as.numeric(x),main='Observed')
cpgram(mylevel,main='Level')
cpgram(myseas,main='Seasonal')
cpgram(myresid,main='Standardized Residals')
par(op)
dev.off()
bitmap(file='test1.png')
plot(as.numeric(m$resid),main='Standardized Residuals',ylab='Residuals',xlab='time',type='b')
grid()
dev.off()
bitmap(file='test5.png')
op <- par(mfrow = c(2,2))
hist(m$resid,main='Residual Histogram')
plot(density(m$resid),main='Residual Kernel Density')
qqnorm(m$resid,main='Residual Normal QQ Plot')
qqline(m$resid)
plot(m$resid^2, myfit^2,main='Sq.Resid vs. Sq.Fit',xlab='Squared residuals',ylab='Squared Fit')
par(op)
dev.off()
bitmap(file='test6.png')
par(mfrow = c(3,1), mar = c(3,3,3,3))
plot(cbind(x, pred$pred), type = 'n', plot.type = 'single', ylab = '')
lines(x)
polygon(c(time(pred$pred), rev(time(pred$pred))), c(pred$pred + 2 * pred$se, rev(pred$pred)), col = 'gray85', border = NA)
polygon(c(time(pred$pred), rev(time(pred$pred))), c(pred$pred - 2 * pred$se, rev(pred$pred)), col = ' gray85', border = NA)
lines(pred$pred, col = 'blue', lwd = 1.5)
mtext(text = 'forecasts of the observed series', side = 3, adj = 0)
plot(cbind(x, pred$a[,1]), type = 'n', plot.type = 'single', ylab = '')
lines(x)
polygon(c(time(pred$a[,1]), rev(time(pred$a[,1]))), c(pred$a[,1] + 2 * sqrt(pred$P[,1]), rev(pred$a[,1])), col = 'gray85', border = NA)
polygon(c(time(pred$a[,1]), rev(time(pred$a[,1]))), c(pred$a[,1] - 2 * sqrt(pred$P[,1]), rev(pred$a[,1])), col = ' gray85', border = NA)
lines(pred$a[,1], col = 'blue', lwd = 1.5)
mtext(text = 'forecasts of the level component', side = 3, adj = 0)
plot(cbind(fit2.comps[,3], pred$a[,3]), type = 'n', plot.type = 'single', ylab = '')
lines(fit2.comps[,3])
polygon(c(time(pred$a[,3]), rev(time(pred$a[,3]))), c(pred$a[,3] + 2 * sqrt(pred$P[,3]), rev(pred$a[,3])), col = 'gray85', border = NA)
polygon(c(time(pred$a[,3]), rev(time(pred$a[,3]))), c(pred$a[,3] - 2 * sqrt(pred$P[,3]), rev(pred$a[,3])), col = ' gray85', border = NA)
lines(pred$a[,3], col = 'blue', lwd = 1.5)
mtext(text = 'forecasts of the seasonal component', side = 3, adj = 0)
dev.off()
load(file='createtable')
a<-table.start()
a<-table.row.start(a)
a<-table.element(a,'Structural Time Series Model -- Interpolation',6,TRUE)
a<-table.row.end(a)
a<-table.row.start(a)
a<-table.element(a,'t',header=TRUE)
a<-table.element(a,'Observed',header=TRUE)
a<-table.element(a,'Level',header=TRUE)
a<-table.element(a,'Slope',header=TRUE)
a<-table.element(a,'Seasonal',header=TRUE)
a<-table.element(a,'Stand. Residuals',header=TRUE)
a<-table.row.end(a)
for (i in 1:nx) {
a<-table.row.start(a)
a<-table.element(a,i,header=TRUE)
a<-table.element(a,x[i])
a<-table.element(a,mylevel[i])
a<-table.element(a,myslope[i])
a<-table.element(a,myseas[i])
a<-table.element(a,myresid[i])
a<-table.row.end(a)
}
a<-table.end(a)
table.save(a,file='mytable.tab')
a<-table.start()
a<-table.row.start(a)
a<-table.element(a,'Structural Time Series Model -- Extrapolation',4,TRUE)
a<-table.row.end(a)
a<-table.row.start(a)
a<-table.element(a,'t',header=TRUE)
a<-table.element(a,'Observed',header=TRUE)
a<-table.element(a,'Level',header=TRUE)
a<-table.element(a,'Seasonal',header=TRUE)
a<-table.row.end(a)
for (i in 1:par2) {
a<-table.row.start(a)
a<-table.element(a,i,header=TRUE)
a<-table.element(a,pred$pred[i])
a<-table.element(a,pred$a[i,1])
a<-table.element(a,pred$a[i,3])
a<-table.row.end(a)
}
a<-table.end(a)
table.save(a,file='mytable1.tab')