Free Statistics

of Irreproducible Research!

Author's title

Author*The author of this computation has been verified*
R Software Modulerwasp_exponentialsmoothing.wasp
Title produced by softwareExponential Smoothing
Date of computationSun, 11 Dec 2016 20:21:03 +0100
Cite this page as followsStatistical Computations at FreeStatistics.org, Office for Research Development and Education, URL https://freestatistics.org/blog/index.php?v=date/2016/Dec/11/t1481484531h1lt3opt9bac1zq.htm/, Retrieved Wed, 01 May 2024 23:24:58 +0000
Statistical Computations at FreeStatistics.org, Office for Research Development and Education, URL https://freestatistics.org/blog/index.php?pk=298853, Retrieved Wed, 01 May 2024 23:24:58 +0000
QR Codes:

Original text written by user:
IsPrivate?No (this computation is public)
User-defined keywords
Estimated Impact78
Family? (F = Feedback message, R = changed R code, M = changed R Module, P = changed Parameters, D = changed Data)
-       [Exponential Smoothing] [Exponential Smoot...] [2016-12-11 19:21:03] [2322cf848a5cbdeb3105c2829b69db5d] [Current]
Feedback Forum

Post a new message
Dataseries X:
5692.4
5634.45
5555.38
5352.26
5233.07
4880.16
4861.88
4661.93
4330.68
3681.56
3540.08
3328.03
3254.92
3217.27
3301.29
4272.3
4424.8
4449.8
4678
4722.2
4708.9
4121.4
4230.6
4263
4241.9
4309.8
4457.9
4543.9
4937
4917.9
5041.1
5017.2
4833.9
4815.4
4785.9


Summary of computational transaction
Raw Input view raw input (R code)
Raw Outputview raw output of R engine
Computing time1 seconds
R ServerBig Analytics Cloud Computing Center

\begin{tabular}{lllllllll}
\hline
Summary of computational transaction \tabularnewline
Raw Input view raw input (R code)  \tabularnewline
Raw Outputview raw output of R engine  \tabularnewline
Computing time1 seconds \tabularnewline
R ServerBig Analytics Cloud Computing Center \tabularnewline
\hline
\end{tabular}
%Source: https://freestatistics.org/blog/index.php?pk=298853&T=0

[TABLE]
[ROW]
Summary of computational transaction[/C][/ROW] [ROW]Raw Input[/C] view raw input (R code) [/C][/ROW] [ROW]Raw Output[/C]view raw output of R engine [/C][/ROW] [ROW]Computing time[/C]1 seconds[/C][/ROW] [ROW]R Server[/C]Big Analytics Cloud Computing Center[/C][/ROW] [/TABLE] Source: https://freestatistics.org/blog/index.php?pk=298853&T=0

Globally Unique Identifier (entire table): ba.freestatistics.org/blog/index.php?pk=298853&T=0

As an alternative you can also use a QR Code:  

The GUIDs for individual cells are displayed in the table below:

Summary of computational transaction
Raw Input view raw input (R code)
Raw Outputview raw output of R engine
Computing time1 seconds
R ServerBig Analytics Cloud Computing Center


Estimated Parameters of Exponential Smoothing
ParameterValue
alpha1
beta0
gammaFALSE

\begin{tabular}{lllllllll}
\hline
Estimated Parameters of Exponential Smoothing \tabularnewline
Parameter & Value \tabularnewline
alpha & 1 \tabularnewline
beta & 0 \tabularnewline
gamma & FALSE \tabularnewline
\hline
\end{tabular}
%Source: https://freestatistics.org/blog/index.php?pk=298853&T=1

[TABLE]
[ROW][C]Estimated Parameters of Exponential Smoothing[/C][/ROW]
[ROW][C]Parameter[/C][C]Value[/C][/ROW]
[ROW][C]alpha[/C][C]1[/C][/ROW]
[ROW][C]beta[/C][C]0[/C][/ROW]
[ROW][C]gamma[/C][C]FALSE[/C][/ROW]
[/TABLE]
Source: https://freestatistics.org/blog/index.php?pk=298853&T=1

Globally Unique Identifier (entire table): ba.freestatistics.org/blog/index.php?pk=298853&T=1

As an alternative you can also use a QR Code:  

The GUIDs for individual cells are displayed in the table below:

Estimated Parameters of Exponential Smoothing
ParameterValue
alpha1
beta0
gammaFALSE


Interpolation Forecasts of Exponential Smoothing
tObservedFittedResiduals
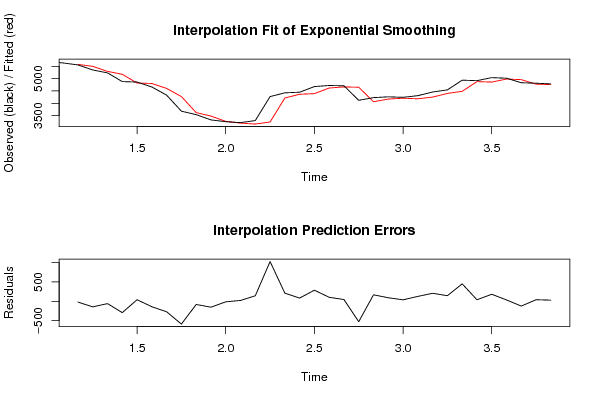
35555.385576.5-21.1199999999999
45352.265497.43-145.17
55233.075294.31-61.2400000000007
64880.165175.12-294.96
74861.884822.2139.6700000000001
84661.934803.93-142
94330.684603.98-273.3
103681.564272.73-591.170000000001
113540.083623.61-83.5300000000002
123328.033482.13-154.1
133254.923270.08-15.1600000000003
143217.273196.9720.2999999999997
153301.293159.32141.97
164272.33243.341028.96
174424.84214.35210.45
184449.84366.8582.9499999999998
1946784391.85286.15
204722.24620.05102.15
214708.94664.2544.6499999999996
224121.44650.95-529.55
234230.64063.45167.150000000001
2442634172.6590.3499999999995
254241.94205.0536.8499999999995
264309.84183.95125.85
274457.94251.85206.049999999999
284543.94399.95143.95
2949374485.95451.05
304917.94879.0538.8499999999995
315041.14859.95181.150000000001
325017.24983.1534.0499999999993
334833.94959.25-125.35
344815.44775.9539.4499999999998
354785.94757.4528.4499999999998

\begin{tabular}{lllllllll}
\hline
Interpolation Forecasts of Exponential Smoothing \tabularnewline
t & Observed & Fitted & Residuals \tabularnewline
3 & 5555.38 & 5576.5 & -21.1199999999999 \tabularnewline
4 & 5352.26 & 5497.43 & -145.17 \tabularnewline
5 & 5233.07 & 5294.31 & -61.2400000000007 \tabularnewline
6 & 4880.16 & 5175.12 & -294.96 \tabularnewline
7 & 4861.88 & 4822.21 & 39.6700000000001 \tabularnewline
8 & 4661.93 & 4803.93 & -142 \tabularnewline
9 & 4330.68 & 4603.98 & -273.3 \tabularnewline
10 & 3681.56 & 4272.73 & -591.170000000001 \tabularnewline
11 & 3540.08 & 3623.61 & -83.5300000000002 \tabularnewline
12 & 3328.03 & 3482.13 & -154.1 \tabularnewline
13 & 3254.92 & 3270.08 & -15.1600000000003 \tabularnewline
14 & 3217.27 & 3196.97 & 20.2999999999997 \tabularnewline
15 & 3301.29 & 3159.32 & 141.97 \tabularnewline
16 & 4272.3 & 3243.34 & 1028.96 \tabularnewline
17 & 4424.8 & 4214.35 & 210.45 \tabularnewline
18 & 4449.8 & 4366.85 & 82.9499999999998 \tabularnewline
19 & 4678 & 4391.85 & 286.15 \tabularnewline
20 & 4722.2 & 4620.05 & 102.15 \tabularnewline
21 & 4708.9 & 4664.25 & 44.6499999999996 \tabularnewline
22 & 4121.4 & 4650.95 & -529.55 \tabularnewline
23 & 4230.6 & 4063.45 & 167.150000000001 \tabularnewline
24 & 4263 & 4172.65 & 90.3499999999995 \tabularnewline
25 & 4241.9 & 4205.05 & 36.8499999999995 \tabularnewline
26 & 4309.8 & 4183.95 & 125.85 \tabularnewline
27 & 4457.9 & 4251.85 & 206.049999999999 \tabularnewline
28 & 4543.9 & 4399.95 & 143.95 \tabularnewline
29 & 4937 & 4485.95 & 451.05 \tabularnewline
30 & 4917.9 & 4879.05 & 38.8499999999995 \tabularnewline
31 & 5041.1 & 4859.95 & 181.150000000001 \tabularnewline
32 & 5017.2 & 4983.15 & 34.0499999999993 \tabularnewline
33 & 4833.9 & 4959.25 & -125.35 \tabularnewline
34 & 4815.4 & 4775.95 & 39.4499999999998 \tabularnewline
35 & 4785.9 & 4757.45 & 28.4499999999998 \tabularnewline
\hline
\end{tabular}
%Source: https://freestatistics.org/blog/index.php?pk=298853&T=2

[TABLE]
[ROW][C]Interpolation Forecasts of Exponential Smoothing[/C][/ROW]
[ROW][C]t[/C][C]Observed[/C][C]Fitted[/C][C]Residuals[/C][/ROW]
[ROW][C]3[/C][C]5555.38[/C][C]5576.5[/C][C]-21.1199999999999[/C][/ROW]
[ROW][C]4[/C][C]5352.26[/C][C]5497.43[/C][C]-145.17[/C][/ROW]
[ROW][C]5[/C][C]5233.07[/C][C]5294.31[/C][C]-61.2400000000007[/C][/ROW]
[ROW][C]6[/C][C]4880.16[/C][C]5175.12[/C][C]-294.96[/C][/ROW]
[ROW][C]7[/C][C]4861.88[/C][C]4822.21[/C][C]39.6700000000001[/C][/ROW]
[ROW][C]8[/C][C]4661.93[/C][C]4803.93[/C][C]-142[/C][/ROW]
[ROW][C]9[/C][C]4330.68[/C][C]4603.98[/C][C]-273.3[/C][/ROW]
[ROW][C]10[/C][C]3681.56[/C][C]4272.73[/C][C]-591.170000000001[/C][/ROW]
[ROW][C]11[/C][C]3540.08[/C][C]3623.61[/C][C]-83.5300000000002[/C][/ROW]
[ROW][C]12[/C][C]3328.03[/C][C]3482.13[/C][C]-154.1[/C][/ROW]
[ROW][C]13[/C][C]3254.92[/C][C]3270.08[/C][C]-15.1600000000003[/C][/ROW]
[ROW][C]14[/C][C]3217.27[/C][C]3196.97[/C][C]20.2999999999997[/C][/ROW]
[ROW][C]15[/C][C]3301.29[/C][C]3159.32[/C][C]141.97[/C][/ROW]
[ROW][C]16[/C][C]4272.3[/C][C]3243.34[/C][C]1028.96[/C][/ROW]
[ROW][C]17[/C][C]4424.8[/C][C]4214.35[/C][C]210.45[/C][/ROW]
[ROW][C]18[/C][C]4449.8[/C][C]4366.85[/C][C]82.9499999999998[/C][/ROW]
[ROW][C]19[/C][C]4678[/C][C]4391.85[/C][C]286.15[/C][/ROW]
[ROW][C]20[/C][C]4722.2[/C][C]4620.05[/C][C]102.15[/C][/ROW]
[ROW][C]21[/C][C]4708.9[/C][C]4664.25[/C][C]44.6499999999996[/C][/ROW]
[ROW][C]22[/C][C]4121.4[/C][C]4650.95[/C][C]-529.55[/C][/ROW]
[ROW][C]23[/C][C]4230.6[/C][C]4063.45[/C][C]167.150000000001[/C][/ROW]
[ROW][C]24[/C][C]4263[/C][C]4172.65[/C][C]90.3499999999995[/C][/ROW]
[ROW][C]25[/C][C]4241.9[/C][C]4205.05[/C][C]36.8499999999995[/C][/ROW]
[ROW][C]26[/C][C]4309.8[/C][C]4183.95[/C][C]125.85[/C][/ROW]
[ROW][C]27[/C][C]4457.9[/C][C]4251.85[/C][C]206.049999999999[/C][/ROW]
[ROW][C]28[/C][C]4543.9[/C][C]4399.95[/C][C]143.95[/C][/ROW]
[ROW][C]29[/C][C]4937[/C][C]4485.95[/C][C]451.05[/C][/ROW]
[ROW][C]30[/C][C]4917.9[/C][C]4879.05[/C][C]38.8499999999995[/C][/ROW]
[ROW][C]31[/C][C]5041.1[/C][C]4859.95[/C][C]181.150000000001[/C][/ROW]
[ROW][C]32[/C][C]5017.2[/C][C]4983.15[/C][C]34.0499999999993[/C][/ROW]
[ROW][C]33[/C][C]4833.9[/C][C]4959.25[/C][C]-125.35[/C][/ROW]
[ROW][C]34[/C][C]4815.4[/C][C]4775.95[/C][C]39.4499999999998[/C][/ROW]
[ROW][C]35[/C][C]4785.9[/C][C]4757.45[/C][C]28.4499999999998[/C][/ROW]
[/TABLE]
Source: https://freestatistics.org/blog/index.php?pk=298853&T=2

Globally Unique Identifier (entire table): ba.freestatistics.org/blog/index.php?pk=298853&T=2

As an alternative you can also use a QR Code:  

The GUIDs for individual cells are displayed in the table below:

Interpolation Forecasts of Exponential Smoothing
tObservedFittedResiduals
35555.385576.5-21.1199999999999
45352.265497.43-145.17
55233.075294.31-61.2400000000007
64880.165175.12-294.96
74861.884822.2139.6700000000001
84661.934803.93-142
94330.684603.98-273.3
103681.564272.73-591.170000000001
113540.083623.61-83.5300000000002
123328.033482.13-154.1
133254.923270.08-15.1600000000003
143217.273196.9720.2999999999997
153301.293159.32141.97
164272.33243.341028.96
174424.84214.35210.45
184449.84366.8582.9499999999998
1946784391.85286.15
204722.24620.05102.15
214708.94664.2544.6499999999996
224121.44650.95-529.55
234230.64063.45167.150000000001
2442634172.6590.3499999999995
254241.94205.0536.8499999999995
264309.84183.95125.85
274457.94251.85206.049999999999
284543.94399.95143.95
2949374485.95451.05
304917.94879.0538.8499999999995
315041.14859.95181.150000000001
325017.24983.1534.0499999999993
334833.94959.25-125.35
344815.44775.9539.4499999999998
354785.94757.4528.4499999999998


Extrapolation Forecasts of Exponential Smoothing
tForecast95% Lower Bound95% Upper Bound
364727.954187.451945727955268.44805427204
3746703905.62032121225434.3796787878
384612.053675.87990860875548.2200913913
394554.13473.103891455915635.09610854409
404496.153287.559608941345704.74039105866
414438.23114.255560066365762.14443993364
424380.252950.226564281885810.27343571812
434322.32793.540642424415851.05935757559
444264.352642.855837183875885.84416281614
454206.42497.195077611045915.60492238897
464148.452355.820754062485941.07924593752
474090.52218.15981721745962.84018278261
484032.552083.756551033635981.34344896638
493974.61952.241462696065996.95853730394
503916.651823.310037146866009.98996285315
513858.71696.707782911826020.69221708818
523800.751572.219431795536029.28056820447
533742.81449.660963636626035.93903636339

\begin{tabular}{lllllllll}
\hline
Extrapolation Forecasts of Exponential Smoothing \tabularnewline
t & Forecast & 95% Lower Bound & 95% Upper Bound \tabularnewline
36 & 4727.95 & 4187.45194572795 & 5268.44805427204 \tabularnewline
37 & 4670 & 3905.6203212122 & 5434.3796787878 \tabularnewline
38 & 4612.05 & 3675.8799086087 & 5548.2200913913 \tabularnewline
39 & 4554.1 & 3473.10389145591 & 5635.09610854409 \tabularnewline
40 & 4496.15 & 3287.55960894134 & 5704.74039105866 \tabularnewline
41 & 4438.2 & 3114.25556006636 & 5762.14443993364 \tabularnewline
42 & 4380.25 & 2950.22656428188 & 5810.27343571812 \tabularnewline
43 & 4322.3 & 2793.54064242441 & 5851.05935757559 \tabularnewline
44 & 4264.35 & 2642.85583718387 & 5885.84416281614 \tabularnewline
45 & 4206.4 & 2497.19507761104 & 5915.60492238897 \tabularnewline
46 & 4148.45 & 2355.82075406248 & 5941.07924593752 \tabularnewline
47 & 4090.5 & 2218.1598172174 & 5962.84018278261 \tabularnewline
48 & 4032.55 & 2083.75655103363 & 5981.34344896638 \tabularnewline
49 & 3974.6 & 1952.24146269606 & 5996.95853730394 \tabularnewline
50 & 3916.65 & 1823.31003714686 & 6009.98996285315 \tabularnewline
51 & 3858.7 & 1696.70778291182 & 6020.69221708818 \tabularnewline
52 & 3800.75 & 1572.21943179553 & 6029.28056820447 \tabularnewline
53 & 3742.8 & 1449.66096363662 & 6035.93903636339 \tabularnewline
\hline
\end{tabular}
%Source: https://freestatistics.org/blog/index.php?pk=298853&T=3

[TABLE]
[ROW][C]Extrapolation Forecasts of Exponential Smoothing[/C][/ROW]
[ROW][C]t[/C][C]Forecast[/C][C]95% Lower Bound[/C][C]95% Upper Bound[/C][/ROW]
[ROW][C]36[/C][C]4727.95[/C][C]4187.45194572795[/C][C]5268.44805427204[/C][/ROW]
[ROW][C]37[/C][C]4670[/C][C]3905.6203212122[/C][C]5434.3796787878[/C][/ROW]
[ROW][C]38[/C][C]4612.05[/C][C]3675.8799086087[/C][C]5548.2200913913[/C][/ROW]
[ROW][C]39[/C][C]4554.1[/C][C]3473.10389145591[/C][C]5635.09610854409[/C][/ROW]
[ROW][C]40[/C][C]4496.15[/C][C]3287.55960894134[/C][C]5704.74039105866[/C][/ROW]
[ROW][C]41[/C][C]4438.2[/C][C]3114.25556006636[/C][C]5762.14443993364[/C][/ROW]
[ROW][C]42[/C][C]4380.25[/C][C]2950.22656428188[/C][C]5810.27343571812[/C][/ROW]
[ROW][C]43[/C][C]4322.3[/C][C]2793.54064242441[/C][C]5851.05935757559[/C][/ROW]
[ROW][C]44[/C][C]4264.35[/C][C]2642.85583718387[/C][C]5885.84416281614[/C][/ROW]
[ROW][C]45[/C][C]4206.4[/C][C]2497.19507761104[/C][C]5915.60492238897[/C][/ROW]
[ROW][C]46[/C][C]4148.45[/C][C]2355.82075406248[/C][C]5941.07924593752[/C][/ROW]
[ROW][C]47[/C][C]4090.5[/C][C]2218.1598172174[/C][C]5962.84018278261[/C][/ROW]
[ROW][C]48[/C][C]4032.55[/C][C]2083.75655103363[/C][C]5981.34344896638[/C][/ROW]
[ROW][C]49[/C][C]3974.6[/C][C]1952.24146269606[/C][C]5996.95853730394[/C][/ROW]
[ROW][C]50[/C][C]3916.65[/C][C]1823.31003714686[/C][C]6009.98996285315[/C][/ROW]
[ROW][C]51[/C][C]3858.7[/C][C]1696.70778291182[/C][C]6020.69221708818[/C][/ROW]
[ROW][C]52[/C][C]3800.75[/C][C]1572.21943179553[/C][C]6029.28056820447[/C][/ROW]
[ROW][C]53[/C][C]3742.8[/C][C]1449.66096363662[/C][C]6035.93903636339[/C][/ROW]
[/TABLE]
Source: https://freestatistics.org/blog/index.php?pk=298853&T=3

Globally Unique Identifier (entire table): ba.freestatistics.org/blog/index.php?pk=298853&T=3

As an alternative you can also use a QR Code:  

The GUIDs for individual cells are displayed in the table below:

Extrapolation Forecasts of Exponential Smoothing
tForecast95% Lower Bound95% Upper Bound
364727.954187.451945727955268.44805427204
3746703905.62032121225434.3796787878
384612.053675.87990860875548.2200913913
394554.13473.103891455915635.09610854409
404496.153287.559608941345704.74039105866
414438.23114.255560066365762.14443993364
424380.252950.226564281885810.27343571812
434322.32793.540642424415851.05935757559
444264.352642.855837183875885.84416281614
454206.42497.195077611045915.60492238897
464148.452355.820754062485941.07924593752
474090.52218.15981721745962.84018278261
484032.552083.756551033635981.34344896638
493974.61952.241462696065996.95853730394
503916.651823.310037146866009.98996285315
513858.71696.707782911826020.69221708818
523800.751572.219431795536029.28056820447
533742.81449.660963636626035.93903636339


Parameters (Session):
par1 = 12 ; par2 = Double ; par3 = additive ; par4 = 18 ;
Parameters (R input):
par1 = 12 ; par2 = Double ; par3 = additive ; par4 = 18 ;
R code (references can be found in the software module):
par1 <- as.numeric(par1)
par4 <- as.numeric(par4)
if (par2 == 'Single') K <- 1
if (par2 == 'Double') K <- 2
if (par2 == 'Triple') K <- par1
nx <- length(x)
nxmK <- nx - K
x <- ts(x, frequency = par1)
if (par2 == 'Single') fit <- HoltWinters(x, gamma=F, beta=F)
if (par2 == 'Double') fit <- HoltWinters(x, gamma=F)
if (par2 == 'Triple') fit <- HoltWinters(x, seasonal=par3)
fit
myresid <- x - fit$fitted[,'xhat']
bitmap(file='test1.png')
op <- par(mfrow=c(2,1))
plot(fit,ylab='Observed (black) / Fitted (red)',main='Interpolation Fit of Exponential Smoothing')
plot(myresid,ylab='Residuals',main='Interpolation Prediction Errors')
par(op)
dev.off()
bitmap(file='test2.png')
p <- predict(fit, par4, prediction.interval=TRUE)
np <- length(p[,1])
plot(fit,p,ylab='Observed (black) / Fitted (red)',main='Extrapolation Fit of Exponential Smoothing')
dev.off()
bitmap(file='test3.png')
op <- par(mfrow = c(2,2))
acf(as.numeric(myresid),lag.max = nx/2,main='Residual ACF')
spectrum(myresid,main='Residals Periodogram')
cpgram(myresid,main='Residal Cumulative Periodogram')
qqnorm(myresid,main='Residual Normal QQ Plot')
qqline(myresid)
par(op)
dev.off()
load(file='createtable')
a<-table.start()
a<-table.row.start(a)
a<-table.element(a,'Estimated Parameters of Exponential Smoothing',2,TRUE)
a<-table.row.end(a)
a<-table.row.start(a)
a<-table.element(a,'Parameter',header=TRUE)
a<-table.element(a,'Value',header=TRUE)
a<-table.row.end(a)
a<-table.row.start(a)
a<-table.element(a,'alpha',header=TRUE)
a<-table.element(a,fit$alpha)
a<-table.row.end(a)
a<-table.row.start(a)
a<-table.element(a,'beta',header=TRUE)
a<-table.element(a,fit$beta)
a<-table.row.end(a)
a<-table.row.start(a)
a<-table.element(a,'gamma',header=TRUE)
a<-table.element(a,fit$gamma)
a<-table.row.end(a)
a<-table.end(a)
table.save(a,file='mytable.tab')
a<-table.start()
a<-table.row.start(a)
a<-table.element(a,'Interpolation Forecasts of Exponential Smoothing',4,TRUE)
a<-table.row.end(a)
a<-table.row.start(a)
a<-table.element(a,'t',header=TRUE)
a<-table.element(a,'Observed',header=TRUE)
a<-table.element(a,'Fitted',header=TRUE)
a<-table.element(a,'Residuals',header=TRUE)
a<-table.row.end(a)
for (i in 1:nxmK) {
a<-table.row.start(a)
a<-table.element(a,i+K,header=TRUE)
a<-table.element(a,x[i+K])
a<-table.element(a,fit$fitted[i,'xhat'])
a<-table.element(a,myresid[i])
a<-table.row.end(a)
}
a<-table.end(a)
table.save(a,file='mytable1.tab')
a<-table.start()
a<-table.row.start(a)
a<-table.element(a,'Extrapolation Forecasts of Exponential Smoothing',4,TRUE)
a<-table.row.end(a)
a<-table.row.start(a)
a<-table.element(a,'t',header=TRUE)
a<-table.element(a,'Forecast',header=TRUE)
a<-table.element(a,'95% Lower Bound',header=TRUE)
a<-table.element(a,'95% Upper Bound',header=TRUE)
a<-table.row.end(a)
for (i in 1:np) {
a<-table.row.start(a)
a<-table.element(a,nx+i,header=TRUE)
a<-table.element(a,p[i,'fit'])
a<-table.element(a,p[i,'lwr'])
a<-table.element(a,p[i,'upr'])
a<-table.row.end(a)
}
a<-table.end(a)
table.save(a,file='mytable2.tab')