Free Statistics

of Irreproducible Research!

Author's title

Author*The author of this computation has been verified*
R Software Modulerwasp_decompose.wasp
Title produced by softwareClassical Decomposition
Date of computationMon, 12 Dec 2016 19:27:09 +0100
Cite this page as followsStatistical Computations at FreeStatistics.org, Office for Research Development and Education, URL https://freestatistics.org/blog/index.php?v=date/2016/Dec/12/t1481567313u6swhaqwukj27ij.htm/, Retrieved Fri, 03 May 2024 22:52:33 +0000
Statistical Computations at FreeStatistics.org, Office for Research Development and Education, URL https://freestatistics.org/blog/index.php?pk=298954, Retrieved Fri, 03 May 2024 22:52:33 +0000
QR Codes:

Original text written by user:
IsPrivate?No (this computation is public)
User-defined keywords
Estimated Impact51
Family? (F = Feedback message, R = changed R code, M = changed R Module, P = changed Parameters, D = changed Data)
-       [Classical Decomposition] [classical decompo...] [2016-12-12 18:27:09] [130d73899007e5ff8a4f636b9bcfb397] [Current]
Feedback Forum

Post a new message
Dataseries X:
4786.55
5403.6
6042.4
5824.45
5349.4
5428.2
4906.65
4965.9
4842.3
4638.55
4542.2
4335.15
4445
4750.5
5081.2
5476.35
5359
5358.5
5646.5
5878
6270
6601.5
6792
6871.5
6726.5
6770.5
6611
6711
6089.5
5858.5
5673.5
5531.5
5081.5
5057.5
4979
5003.5


Summary of computational transaction
Raw Input view raw input (R code)
Raw Outputview raw output of R engine
Computing time2 seconds
R ServerBig Analytics Cloud Computing Center

\begin{tabular}{lllllllll}
\hline
Summary of computational transaction \tabularnewline
Raw Input view raw input (R code)  \tabularnewline
Raw Outputview raw output of R engine  \tabularnewline
Computing time2 seconds \tabularnewline
R ServerBig Analytics Cloud Computing Center \tabularnewline
\hline
\end{tabular}
%Source: https://freestatistics.org/blog/index.php?pk=298954&T=0

[TABLE]
[ROW]
Summary of computational transaction[/C][/ROW] [ROW]Raw Input[/C] view raw input (R code) [/C][/ROW] [ROW]Raw Output[/C]view raw output of R engine [/C][/ROW] [ROW]Computing time[/C]2 seconds[/C][/ROW] [ROW]R Server[/C]Big Analytics Cloud Computing Center[/C][/ROW] [/TABLE] Source: https://freestatistics.org/blog/index.php?pk=298954&T=0

Globally Unique Identifier (entire table): ba.freestatistics.org/blog/index.php?pk=298954&T=0

As an alternative you can also use a QR Code:  

The GUIDs for individual cells are displayed in the table below:

Summary of computational transaction
Raw Input view raw input (R code)
Raw Outputview raw output of R engine
Computing time2 seconds
R ServerBig Analytics Cloud Computing Center


Classical Decomposition by Moving Averages
tObservationsFitTrendSeasonalRandom
14786.55NANA-89.7352NA
25403.6NANA57.2555NA
36042.4NANA126.089NA
45824.45NANA359.952NA
55349.4NANA-27.3008NA
65428.2NANA-166.075NA
74906.654898.385074.55-176.1668.26849
84965.94933.425033.1-99.684132.4799
94842.34960.034965.84-5.80703-117.735
104638.554939.044911.2927.7523-300.49
114542.24938.124897.1840.9388-395.922
124335.154847.464894.68-47.2195-512.31
1344454832.874922.6-89.7352-387.867
144750.55048.694991.4357.2555-298.189
155081.25215.015088.92126.089-133.814
165476.355590.155230.2359.952-113.804
1753595378.435405.73-27.3008-19.4326
185358.55439.085605.16-166.075-80.5815
195646.55629.735805.9-176.16616.7664
2058785885.455985.13-99.6841-7.44505
2162706127.236133.04-5.80703142.77
226601.56275.986248.2227.7523325.525
2367926371.046330.140.9388420.957
246871.56334.166381.37-47.2195537.345
256726.56313.66403.33-89.7352412.902
266770.56447.286390.0257.2555323.224
2766116452.156326.06126.089158.849
2867116572.166212.21359.952138.839
296089.56045.036072.33-27.300844.4674
305858.55752.885918.96-166.075105.616
315673.5NANA-176.166NA
325531.5NANA-99.6841NA
335081.5NANA-5.80703NA
345057.5NANA27.7523NA
354979NANA40.9388NA
365003.5NANA-47.2195NA

\begin{tabular}{lllllllll}
\hline
Classical Decomposition by Moving Averages \tabularnewline
t & Observations & Fit & Trend & Seasonal & Random \tabularnewline
1 & 4786.55 & NA & NA & -89.7352 & NA \tabularnewline
2 & 5403.6 & NA & NA & 57.2555 & NA \tabularnewline
3 & 6042.4 & NA & NA & 126.089 & NA \tabularnewline
4 & 5824.45 & NA & NA & 359.952 & NA \tabularnewline
5 & 5349.4 & NA & NA & -27.3008 & NA \tabularnewline
6 & 5428.2 & NA & NA & -166.075 & NA \tabularnewline
7 & 4906.65 & 4898.38 & 5074.55 & -176.166 & 8.26849 \tabularnewline
8 & 4965.9 & 4933.42 & 5033.1 & -99.6841 & 32.4799 \tabularnewline
9 & 4842.3 & 4960.03 & 4965.84 & -5.80703 & -117.735 \tabularnewline
10 & 4638.55 & 4939.04 & 4911.29 & 27.7523 & -300.49 \tabularnewline
11 & 4542.2 & 4938.12 & 4897.18 & 40.9388 & -395.922 \tabularnewline
12 & 4335.15 & 4847.46 & 4894.68 & -47.2195 & -512.31 \tabularnewline
13 & 4445 & 4832.87 & 4922.6 & -89.7352 & -387.867 \tabularnewline
14 & 4750.5 & 5048.69 & 4991.43 & 57.2555 & -298.189 \tabularnewline
15 & 5081.2 & 5215.01 & 5088.92 & 126.089 & -133.814 \tabularnewline
16 & 5476.35 & 5590.15 & 5230.2 & 359.952 & -113.804 \tabularnewline
17 & 5359 & 5378.43 & 5405.73 & -27.3008 & -19.4326 \tabularnewline
18 & 5358.5 & 5439.08 & 5605.16 & -166.075 & -80.5815 \tabularnewline
19 & 5646.5 & 5629.73 & 5805.9 & -176.166 & 16.7664 \tabularnewline
20 & 5878 & 5885.45 & 5985.13 & -99.6841 & -7.44505 \tabularnewline
21 & 6270 & 6127.23 & 6133.04 & -5.80703 & 142.77 \tabularnewline
22 & 6601.5 & 6275.98 & 6248.22 & 27.7523 & 325.525 \tabularnewline
23 & 6792 & 6371.04 & 6330.1 & 40.9388 & 420.957 \tabularnewline
24 & 6871.5 & 6334.16 & 6381.37 & -47.2195 & 537.345 \tabularnewline
25 & 6726.5 & 6313.6 & 6403.33 & -89.7352 & 412.902 \tabularnewline
26 & 6770.5 & 6447.28 & 6390.02 & 57.2555 & 323.224 \tabularnewline
27 & 6611 & 6452.15 & 6326.06 & 126.089 & 158.849 \tabularnewline
28 & 6711 & 6572.16 & 6212.21 & 359.952 & 138.839 \tabularnewline
29 & 6089.5 & 6045.03 & 6072.33 & -27.3008 & 44.4674 \tabularnewline
30 & 5858.5 & 5752.88 & 5918.96 & -166.075 & 105.616 \tabularnewline
31 & 5673.5 & NA & NA & -176.166 & NA \tabularnewline
32 & 5531.5 & NA & NA & -99.6841 & NA \tabularnewline
33 & 5081.5 & NA & NA & -5.80703 & NA \tabularnewline
34 & 5057.5 & NA & NA & 27.7523 & NA \tabularnewline
35 & 4979 & NA & NA & 40.9388 & NA \tabularnewline
36 & 5003.5 & NA & NA & -47.2195 & NA \tabularnewline
\hline
\end{tabular}
%Source: https://freestatistics.org/blog/index.php?pk=298954&T=1

[TABLE]
[ROW][C]Classical Decomposition by Moving Averages[/C][/ROW]
[ROW][C]t[/C][C]Observations[/C][C]Fit[/C][C]Trend[/C][C]Seasonal[/C][C]Random[/C][/ROW]
[ROW][C]1[/C][C]4786.55[/C][C]NA[/C][C]NA[/C][C]-89.7352[/C][C]NA[/C][/ROW]
[ROW][C]2[/C][C]5403.6[/C][C]NA[/C][C]NA[/C][C]57.2555[/C][C]NA[/C][/ROW]
[ROW][C]3[/C][C]6042.4[/C][C]NA[/C][C]NA[/C][C]126.089[/C][C]NA[/C][/ROW]
[ROW][C]4[/C][C]5824.45[/C][C]NA[/C][C]NA[/C][C]359.952[/C][C]NA[/C][/ROW]
[ROW][C]5[/C][C]5349.4[/C][C]NA[/C][C]NA[/C][C]-27.3008[/C][C]NA[/C][/ROW]
[ROW][C]6[/C][C]5428.2[/C][C]NA[/C][C]NA[/C][C]-166.075[/C][C]NA[/C][/ROW]
[ROW][C]7[/C][C]4906.65[/C][C]4898.38[/C][C]5074.55[/C][C]-176.166[/C][C]8.26849[/C][/ROW]
[ROW][C]8[/C][C]4965.9[/C][C]4933.42[/C][C]5033.1[/C][C]-99.6841[/C][C]32.4799[/C][/ROW]
[ROW][C]9[/C][C]4842.3[/C][C]4960.03[/C][C]4965.84[/C][C]-5.80703[/C][C]-117.735[/C][/ROW]
[ROW][C]10[/C][C]4638.55[/C][C]4939.04[/C][C]4911.29[/C][C]27.7523[/C][C]-300.49[/C][/ROW]
[ROW][C]11[/C][C]4542.2[/C][C]4938.12[/C][C]4897.18[/C][C]40.9388[/C][C]-395.922[/C][/ROW]
[ROW][C]12[/C][C]4335.15[/C][C]4847.46[/C][C]4894.68[/C][C]-47.2195[/C][C]-512.31[/C][/ROW]
[ROW][C]13[/C][C]4445[/C][C]4832.87[/C][C]4922.6[/C][C]-89.7352[/C][C]-387.867[/C][/ROW]
[ROW][C]14[/C][C]4750.5[/C][C]5048.69[/C][C]4991.43[/C][C]57.2555[/C][C]-298.189[/C][/ROW]
[ROW][C]15[/C][C]5081.2[/C][C]5215.01[/C][C]5088.92[/C][C]126.089[/C][C]-133.814[/C][/ROW]
[ROW][C]16[/C][C]5476.35[/C][C]5590.15[/C][C]5230.2[/C][C]359.952[/C][C]-113.804[/C][/ROW]
[ROW][C]17[/C][C]5359[/C][C]5378.43[/C][C]5405.73[/C][C]-27.3008[/C][C]-19.4326[/C][/ROW]
[ROW][C]18[/C][C]5358.5[/C][C]5439.08[/C][C]5605.16[/C][C]-166.075[/C][C]-80.5815[/C][/ROW]
[ROW][C]19[/C][C]5646.5[/C][C]5629.73[/C][C]5805.9[/C][C]-176.166[/C][C]16.7664[/C][/ROW]
[ROW][C]20[/C][C]5878[/C][C]5885.45[/C][C]5985.13[/C][C]-99.6841[/C][C]-7.44505[/C][/ROW]
[ROW][C]21[/C][C]6270[/C][C]6127.23[/C][C]6133.04[/C][C]-5.80703[/C][C]142.77[/C][/ROW]
[ROW][C]22[/C][C]6601.5[/C][C]6275.98[/C][C]6248.22[/C][C]27.7523[/C][C]325.525[/C][/ROW]
[ROW][C]23[/C][C]6792[/C][C]6371.04[/C][C]6330.1[/C][C]40.9388[/C][C]420.957[/C][/ROW]
[ROW][C]24[/C][C]6871.5[/C][C]6334.16[/C][C]6381.37[/C][C]-47.2195[/C][C]537.345[/C][/ROW]
[ROW][C]25[/C][C]6726.5[/C][C]6313.6[/C][C]6403.33[/C][C]-89.7352[/C][C]412.902[/C][/ROW]
[ROW][C]26[/C][C]6770.5[/C][C]6447.28[/C][C]6390.02[/C][C]57.2555[/C][C]323.224[/C][/ROW]
[ROW][C]27[/C][C]6611[/C][C]6452.15[/C][C]6326.06[/C][C]126.089[/C][C]158.849[/C][/ROW]
[ROW][C]28[/C][C]6711[/C][C]6572.16[/C][C]6212.21[/C][C]359.952[/C][C]138.839[/C][/ROW]
[ROW][C]29[/C][C]6089.5[/C][C]6045.03[/C][C]6072.33[/C][C]-27.3008[/C][C]44.4674[/C][/ROW]
[ROW][C]30[/C][C]5858.5[/C][C]5752.88[/C][C]5918.96[/C][C]-166.075[/C][C]105.616[/C][/ROW]
[ROW][C]31[/C][C]5673.5[/C][C]NA[/C][C]NA[/C][C]-176.166[/C][C]NA[/C][/ROW]
[ROW][C]32[/C][C]5531.5[/C][C]NA[/C][C]NA[/C][C]-99.6841[/C][C]NA[/C][/ROW]
[ROW][C]33[/C][C]5081.5[/C][C]NA[/C][C]NA[/C][C]-5.80703[/C][C]NA[/C][/ROW]
[ROW][C]34[/C][C]5057.5[/C][C]NA[/C][C]NA[/C][C]27.7523[/C][C]NA[/C][/ROW]
[ROW][C]35[/C][C]4979[/C][C]NA[/C][C]NA[/C][C]40.9388[/C][C]NA[/C][/ROW]
[ROW][C]36[/C][C]5003.5[/C][C]NA[/C][C]NA[/C][C]-47.2195[/C][C]NA[/C][/ROW]
[/TABLE]
Source: https://freestatistics.org/blog/index.php?pk=298954&T=1

Globally Unique Identifier (entire table): ba.freestatistics.org/blog/index.php?pk=298954&T=1

As an alternative you can also use a QR Code:  

The GUIDs for individual cells are displayed in the table below:

Classical Decomposition by Moving Averages
tObservationsFitTrendSeasonalRandom
14786.55NANA-89.7352NA
25403.6NANA57.2555NA
36042.4NANA126.089NA
45824.45NANA359.952NA
55349.4NANA-27.3008NA
65428.2NANA-166.075NA
74906.654898.385074.55-176.1668.26849
84965.94933.425033.1-99.684132.4799
94842.34960.034965.84-5.80703-117.735
104638.554939.044911.2927.7523-300.49
114542.24938.124897.1840.9388-395.922
124335.154847.464894.68-47.2195-512.31
1344454832.874922.6-89.7352-387.867
144750.55048.694991.4357.2555-298.189
155081.25215.015088.92126.089-133.814
165476.355590.155230.2359.952-113.804
1753595378.435405.73-27.3008-19.4326
185358.55439.085605.16-166.075-80.5815
195646.55629.735805.9-176.16616.7664
2058785885.455985.13-99.6841-7.44505
2162706127.236133.04-5.80703142.77
226601.56275.986248.2227.7523325.525
2367926371.046330.140.9388420.957
246871.56334.166381.37-47.2195537.345
256726.56313.66403.33-89.7352412.902
266770.56447.286390.0257.2555323.224
2766116452.156326.06126.089158.849
2867116572.166212.21359.952138.839
296089.56045.036072.33-27.300844.4674
305858.55752.885918.96-166.075105.616
315673.5NANA-176.166NA
325531.5NANA-99.6841NA
335081.5NANA-5.80703NA
345057.5NANA27.7523NA
354979NANA40.9388NA
365003.5NANA-47.2195NA


Parameters (Session):
par1 = additive ; par2 = 12 ;
Parameters (R input):
par1 = additive ; par2 = 12 ;
R code (references can be found in the software module):
par2 <- as.numeric(par2)
x <- ts(x,freq=par2)
m <- decompose(x,type=par1)
m$figure
bitmap(file='test1.png')
plot(m)
dev.off()
mylagmax <- length(x)/2
bitmap(file='test2.png')
op <- par(mfrow = c(2,2))
acf(as.numeric(x),lag.max = mylagmax,main='Observed')
acf(as.numeric(m$trend),na.action=na.pass,lag.max = mylagmax,main='Trend')
acf(as.numeric(m$seasonal),na.action=na.pass,lag.max = mylagmax,main='Seasonal')
acf(as.numeric(m$random),na.action=na.pass,lag.max = mylagmax,main='Random')
par(op)
dev.off()
bitmap(file='test3.png')
op <- par(mfrow = c(2,2))
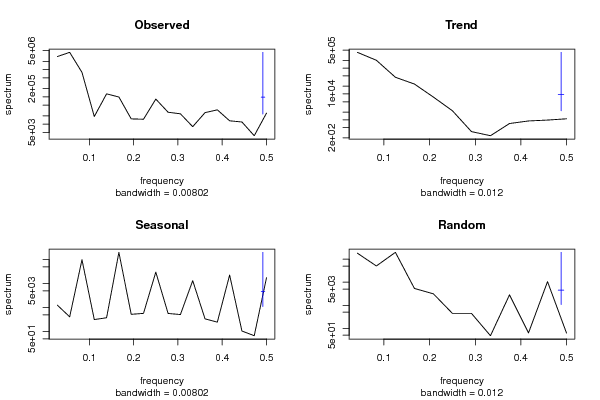
spectrum(as.numeric(x),main='Observed')
spectrum(as.numeric(m$trend[!is.na(m$trend)]),main='Trend')
spectrum(as.numeric(m$seasonal[!is.na(m$seasonal)]),main='Seasonal')
spectrum(as.numeric(m$random[!is.na(m$random)]),main='Random')
par(op)
dev.off()
bitmap(file='test4.png')
op <- par(mfrow = c(2,2))
cpgram(as.numeric(x),main='Observed')
cpgram(as.numeric(m$trend[!is.na(m$trend)]),main='Trend')
cpgram(as.numeric(m$seasonal[!is.na(m$seasonal)]),main='Seasonal')
cpgram(as.numeric(m$random[!is.na(m$random)]),main='Random')
par(op)
dev.off()
load(file='createtable')
a<-table.start()
a<-table.row.start(a)
a<-table.element(a,'Classical Decomposition by Moving Averages',6,TRUE)
a<-table.row.end(a)
a<-table.row.start(a)
a<-table.element(a,'t',header=TRUE)
a<-table.element(a,'Observations',header=TRUE)
a<-table.element(a,'Fit',header=TRUE)
a<-table.element(a,'Trend',header=TRUE)
a<-table.element(a,'Seasonal',header=TRUE)
a<-table.element(a,'Random',header=TRUE)
a<-table.row.end(a)
for (i in 1:length(m$trend)) {
a<-table.row.start(a)
a<-table.element(a,i,header=TRUE)
a<-table.element(a,x[i])
if (par1 == 'additive') a<-table.element(a,signif(m$trend[i]+m$seasonal[i],6)) else a<-table.element(a,signif(m$trend[i]*m$seasonal[i],6))
a<-table.element(a,signif(m$trend[i],6))
a<-table.element(a,signif(m$seasonal[i],6))
a<-table.element(a,signif(m$random[i],6))
a<-table.row.end(a)
}
a<-table.end(a)
table.save(a,file='mytable.tab')