Free Statistics

of Irreproducible Research!

Author's title

Author*The author of this computation has been verified*
R Software Modulerwasp_decompose.wasp
Title produced by softwareClassical Decomposition
Date of computationMon, 12 Dec 2016 19:41:43 +0100
Cite this page as followsStatistical Computations at FreeStatistics.org, Office for Research Development and Education, URL https://freestatistics.org/blog/index.php?v=date/2016/Dec/12/t1481568116fgtecedjqs7rif2.htm/, Retrieved Fri, 03 May 2024 15:05:55 +0000
Statistical Computations at FreeStatistics.org, Office for Research Development and Education, URL https://freestatistics.org/blog/index.php?pk=298961, Retrieved Fri, 03 May 2024 15:05:55 +0000
QR Codes:

Original text written by user:
IsPrivate?No (this computation is public)
User-defined keywords
Estimated Impact66
Family? (F = Feedback message, R = changed R code, M = changed R Module, P = changed Parameters, D = changed Data)
-       [Classical Decomposition] [classical decompo...] [2016-12-12 18:41:43] [130d73899007e5ff8a4f636b9bcfb397] [Current]
Feedback Forum

Post a new message
Dataseries X:
2176.85
1899.95
2604
2561.65
2382.5
2155.35
2738.6
2704.25
2540
2251
2982.25
3074.85
2951.25
1105.75
2595.05
2667
2475.2
2015.55
2988.2
3361.25
2861.2
2427.35
3411.9
3404.5
3406.2
2679.3
3677.2
3815.35
3422.85
2925.85
3827.5
4319.65
4004.85
3109.2
4137.35
4847.6


Summary of computational transaction
Raw Input view raw input (R code)
Raw Outputview raw output of R engine
Computing time2 seconds
R ServerBig Analytics Cloud Computing Center

\begin{tabular}{lllllllll}
\hline
Summary of computational transaction \tabularnewline
Raw Input view raw input (R code)  \tabularnewline
Raw Outputview raw output of R engine  \tabularnewline
Computing time2 seconds \tabularnewline
R ServerBig Analytics Cloud Computing Center \tabularnewline
\hline
\end{tabular}
%Source: https://freestatistics.org/blog/index.php?pk=298961&T=0

[TABLE]
[ROW]
Summary of computational transaction[/C][/ROW] [ROW]Raw Input[/C] view raw input (R code) [/C][/ROW] [ROW]Raw Output[/C]view raw output of R engine [/C][/ROW] [ROW]Computing time[/C]2 seconds[/C][/ROW] [ROW]R Server[/C]Big Analytics Cloud Computing Center[/C][/ROW] [/TABLE] Source: https://freestatistics.org/blog/index.php?pk=298961&T=0

Globally Unique Identifier (entire table): ba.freestatistics.org/blog/index.php?pk=298961&T=0

As an alternative you can also use a QR Code:  

The GUIDs for individual cells are displayed in the table below:

Summary of computational transaction
Raw Input view raw input (R code)
Raw Outputview raw output of R engine
Computing time2 seconds
R ServerBig Analytics Cloud Computing Center


Classical Decomposition by Moving Averages
tObservationsFitTrendSeasonalRandom
12176.85NANA321.293NA
21899.95NANA-1021.25NA
32604NANA158.182NA
42561.65NANA214.835NA
52382.5NANA-119.259NA
62155.35NANA-658.581NA
72738.62797.352538.2259.144-58.7482
82704.252924.032537.38386.646-219.775
925402519.822503.9115.901320.1841
1022512113.932507.93-394.001137.07
112982.252932.292516.18416.10749.9602
123074.852935.22514.22420.98139.649
132951.252840.092518.8321.293111.161
141105.751535.322556.57-1021.25-429.574
152595.052755.512597.33158.182-160.461
1626672832.92618.06214.835-165.895
172475.22524.052643.31-119.259-48.8513
182015.552016.372674.95-658.581-0.816927
192988.22966.782707.64259.14421.4164
203361.253178.812792.16386.646182.443
212861.22918.722902.8115.9013-57.5159
222427.352601.752995.75-394.001-174.401
233411.93499.193083.09416.107-87.2919
243404.53581.483160.5420.98-176.98
253406.23554.693233.4321.293-148.493
262679.32287.063308.3-1021.25392.242
273677.23554.073395.89158.182123.129
283815.353686.793471.95214.835128.563
293422.853411.333530.59-119.25911.5195
302925.852962.363620.95-658.581-36.5148
313827.5NANA259.144NA
324319.65NANA386.646NA
334004.85NANA15.9013NA
343109.2NANA-394.001NA
354137.35NANA416.107NA
364847.6NANA420.98NA

\begin{tabular}{lllllllll}
\hline
Classical Decomposition by Moving Averages \tabularnewline
t & Observations & Fit & Trend & Seasonal & Random \tabularnewline
1 & 2176.85 & NA & NA & 321.293 & NA \tabularnewline
2 & 1899.95 & NA & NA & -1021.25 & NA \tabularnewline
3 & 2604 & NA & NA & 158.182 & NA \tabularnewline
4 & 2561.65 & NA & NA & 214.835 & NA \tabularnewline
5 & 2382.5 & NA & NA & -119.259 & NA \tabularnewline
6 & 2155.35 & NA & NA & -658.581 & NA \tabularnewline
7 & 2738.6 & 2797.35 & 2538.2 & 259.144 & -58.7482 \tabularnewline
8 & 2704.25 & 2924.03 & 2537.38 & 386.646 & -219.775 \tabularnewline
9 & 2540 & 2519.82 & 2503.91 & 15.9013 & 20.1841 \tabularnewline
10 & 2251 & 2113.93 & 2507.93 & -394.001 & 137.07 \tabularnewline
11 & 2982.25 & 2932.29 & 2516.18 & 416.107 & 49.9602 \tabularnewline
12 & 3074.85 & 2935.2 & 2514.22 & 420.98 & 139.649 \tabularnewline
13 & 2951.25 & 2840.09 & 2518.8 & 321.293 & 111.161 \tabularnewline
14 & 1105.75 & 1535.32 & 2556.57 & -1021.25 & -429.574 \tabularnewline
15 & 2595.05 & 2755.51 & 2597.33 & 158.182 & -160.461 \tabularnewline
16 & 2667 & 2832.9 & 2618.06 & 214.835 & -165.895 \tabularnewline
17 & 2475.2 & 2524.05 & 2643.31 & -119.259 & -48.8513 \tabularnewline
18 & 2015.55 & 2016.37 & 2674.95 & -658.581 & -0.816927 \tabularnewline
19 & 2988.2 & 2966.78 & 2707.64 & 259.144 & 21.4164 \tabularnewline
20 & 3361.25 & 3178.81 & 2792.16 & 386.646 & 182.443 \tabularnewline
21 & 2861.2 & 2918.72 & 2902.81 & 15.9013 & -57.5159 \tabularnewline
22 & 2427.35 & 2601.75 & 2995.75 & -394.001 & -174.401 \tabularnewline
23 & 3411.9 & 3499.19 & 3083.09 & 416.107 & -87.2919 \tabularnewline
24 & 3404.5 & 3581.48 & 3160.5 & 420.98 & -176.98 \tabularnewline
25 & 3406.2 & 3554.69 & 3233.4 & 321.293 & -148.493 \tabularnewline
26 & 2679.3 & 2287.06 & 3308.3 & -1021.25 & 392.242 \tabularnewline
27 & 3677.2 & 3554.07 & 3395.89 & 158.182 & 123.129 \tabularnewline
28 & 3815.35 & 3686.79 & 3471.95 & 214.835 & 128.563 \tabularnewline
29 & 3422.85 & 3411.33 & 3530.59 & -119.259 & 11.5195 \tabularnewline
30 & 2925.85 & 2962.36 & 3620.95 & -658.581 & -36.5148 \tabularnewline
31 & 3827.5 & NA & NA & 259.144 & NA \tabularnewline
32 & 4319.65 & NA & NA & 386.646 & NA \tabularnewline
33 & 4004.85 & NA & NA & 15.9013 & NA \tabularnewline
34 & 3109.2 & NA & NA & -394.001 & NA \tabularnewline
35 & 4137.35 & NA & NA & 416.107 & NA \tabularnewline
36 & 4847.6 & NA & NA & 420.98 & NA \tabularnewline
\hline
\end{tabular}
%Source: https://freestatistics.org/blog/index.php?pk=298961&T=1

[TABLE]
[ROW][C]Classical Decomposition by Moving Averages[/C][/ROW]
[ROW][C]t[/C][C]Observations[/C][C]Fit[/C][C]Trend[/C][C]Seasonal[/C][C]Random[/C][/ROW]
[ROW][C]1[/C][C]2176.85[/C][C]NA[/C][C]NA[/C][C]321.293[/C][C]NA[/C][/ROW]
[ROW][C]2[/C][C]1899.95[/C][C]NA[/C][C]NA[/C][C]-1021.25[/C][C]NA[/C][/ROW]
[ROW][C]3[/C][C]2604[/C][C]NA[/C][C]NA[/C][C]158.182[/C][C]NA[/C][/ROW]
[ROW][C]4[/C][C]2561.65[/C][C]NA[/C][C]NA[/C][C]214.835[/C][C]NA[/C][/ROW]
[ROW][C]5[/C][C]2382.5[/C][C]NA[/C][C]NA[/C][C]-119.259[/C][C]NA[/C][/ROW]
[ROW][C]6[/C][C]2155.35[/C][C]NA[/C][C]NA[/C][C]-658.581[/C][C]NA[/C][/ROW]
[ROW][C]7[/C][C]2738.6[/C][C]2797.35[/C][C]2538.2[/C][C]259.144[/C][C]-58.7482[/C][/ROW]
[ROW][C]8[/C][C]2704.25[/C][C]2924.03[/C][C]2537.38[/C][C]386.646[/C][C]-219.775[/C][/ROW]
[ROW][C]9[/C][C]2540[/C][C]2519.82[/C][C]2503.91[/C][C]15.9013[/C][C]20.1841[/C][/ROW]
[ROW][C]10[/C][C]2251[/C][C]2113.93[/C][C]2507.93[/C][C]-394.001[/C][C]137.07[/C][/ROW]
[ROW][C]11[/C][C]2982.25[/C][C]2932.29[/C][C]2516.18[/C][C]416.107[/C][C]49.9602[/C][/ROW]
[ROW][C]12[/C][C]3074.85[/C][C]2935.2[/C][C]2514.22[/C][C]420.98[/C][C]139.649[/C][/ROW]
[ROW][C]13[/C][C]2951.25[/C][C]2840.09[/C][C]2518.8[/C][C]321.293[/C][C]111.161[/C][/ROW]
[ROW][C]14[/C][C]1105.75[/C][C]1535.32[/C][C]2556.57[/C][C]-1021.25[/C][C]-429.574[/C][/ROW]
[ROW][C]15[/C][C]2595.05[/C][C]2755.51[/C][C]2597.33[/C][C]158.182[/C][C]-160.461[/C][/ROW]
[ROW][C]16[/C][C]2667[/C][C]2832.9[/C][C]2618.06[/C][C]214.835[/C][C]-165.895[/C][/ROW]
[ROW][C]17[/C][C]2475.2[/C][C]2524.05[/C][C]2643.31[/C][C]-119.259[/C][C]-48.8513[/C][/ROW]
[ROW][C]18[/C][C]2015.55[/C][C]2016.37[/C][C]2674.95[/C][C]-658.581[/C][C]-0.816927[/C][/ROW]
[ROW][C]19[/C][C]2988.2[/C][C]2966.78[/C][C]2707.64[/C][C]259.144[/C][C]21.4164[/C][/ROW]
[ROW][C]20[/C][C]3361.25[/C][C]3178.81[/C][C]2792.16[/C][C]386.646[/C][C]182.443[/C][/ROW]
[ROW][C]21[/C][C]2861.2[/C][C]2918.72[/C][C]2902.81[/C][C]15.9013[/C][C]-57.5159[/C][/ROW]
[ROW][C]22[/C][C]2427.35[/C][C]2601.75[/C][C]2995.75[/C][C]-394.001[/C][C]-174.401[/C][/ROW]
[ROW][C]23[/C][C]3411.9[/C][C]3499.19[/C][C]3083.09[/C][C]416.107[/C][C]-87.2919[/C][/ROW]
[ROW][C]24[/C][C]3404.5[/C][C]3581.48[/C][C]3160.5[/C][C]420.98[/C][C]-176.98[/C][/ROW]
[ROW][C]25[/C][C]3406.2[/C][C]3554.69[/C][C]3233.4[/C][C]321.293[/C][C]-148.493[/C][/ROW]
[ROW][C]26[/C][C]2679.3[/C][C]2287.06[/C][C]3308.3[/C][C]-1021.25[/C][C]392.242[/C][/ROW]
[ROW][C]27[/C][C]3677.2[/C][C]3554.07[/C][C]3395.89[/C][C]158.182[/C][C]123.129[/C][/ROW]
[ROW][C]28[/C][C]3815.35[/C][C]3686.79[/C][C]3471.95[/C][C]214.835[/C][C]128.563[/C][/ROW]
[ROW][C]29[/C][C]3422.85[/C][C]3411.33[/C][C]3530.59[/C][C]-119.259[/C][C]11.5195[/C][/ROW]
[ROW][C]30[/C][C]2925.85[/C][C]2962.36[/C][C]3620.95[/C][C]-658.581[/C][C]-36.5148[/C][/ROW]
[ROW][C]31[/C][C]3827.5[/C][C]NA[/C][C]NA[/C][C]259.144[/C][C]NA[/C][/ROW]
[ROW][C]32[/C][C]4319.65[/C][C]NA[/C][C]NA[/C][C]386.646[/C][C]NA[/C][/ROW]
[ROW][C]33[/C][C]4004.85[/C][C]NA[/C][C]NA[/C][C]15.9013[/C][C]NA[/C][/ROW]
[ROW][C]34[/C][C]3109.2[/C][C]NA[/C][C]NA[/C][C]-394.001[/C][C]NA[/C][/ROW]
[ROW][C]35[/C][C]4137.35[/C][C]NA[/C][C]NA[/C][C]416.107[/C][C]NA[/C][/ROW]
[ROW][C]36[/C][C]4847.6[/C][C]NA[/C][C]NA[/C][C]420.98[/C][C]NA[/C][/ROW]
[/TABLE]
Source: https://freestatistics.org/blog/index.php?pk=298961&T=1

Globally Unique Identifier (entire table): ba.freestatistics.org/blog/index.php?pk=298961&T=1

As an alternative you can also use a QR Code:  

The GUIDs for individual cells are displayed in the table below:

Classical Decomposition by Moving Averages
tObservationsFitTrendSeasonalRandom
12176.85NANA321.293NA
21899.95NANA-1021.25NA
32604NANA158.182NA
42561.65NANA214.835NA
52382.5NANA-119.259NA
62155.35NANA-658.581NA
72738.62797.352538.2259.144-58.7482
82704.252924.032537.38386.646-219.775
925402519.822503.9115.901320.1841
1022512113.932507.93-394.001137.07
112982.252932.292516.18416.10749.9602
123074.852935.22514.22420.98139.649
132951.252840.092518.8321.293111.161
141105.751535.322556.57-1021.25-429.574
152595.052755.512597.33158.182-160.461
1626672832.92618.06214.835-165.895
172475.22524.052643.31-119.259-48.8513
182015.552016.372674.95-658.581-0.816927
192988.22966.782707.64259.14421.4164
203361.253178.812792.16386.646182.443
212861.22918.722902.8115.9013-57.5159
222427.352601.752995.75-394.001-174.401
233411.93499.193083.09416.107-87.2919
243404.53581.483160.5420.98-176.98
253406.23554.693233.4321.293-148.493
262679.32287.063308.3-1021.25392.242
273677.23554.073395.89158.182123.129
283815.353686.793471.95214.835128.563
293422.853411.333530.59-119.25911.5195
302925.852962.363620.95-658.581-36.5148
313827.5NANA259.144NA
324319.65NANA386.646NA
334004.85NANA15.9013NA
343109.2NANA-394.001NA
354137.35NANA416.107NA
364847.6NANA420.98NA


Parameters (Session):
par1 = additive ; par2 = 12 ;
Parameters (R input):
par1 = additive ; par2 = 12 ;
R code (references can be found in the software module):
par2 <- as.numeric(par2)
x <- ts(x,freq=par2)
m <- decompose(x,type=par1)
m$figure
bitmap(file='test1.png')
plot(m)
dev.off()
mylagmax <- length(x)/2
bitmap(file='test2.png')
op <- par(mfrow = c(2,2))
acf(as.numeric(x),lag.max = mylagmax,main='Observed')
acf(as.numeric(m$trend),na.action=na.pass,lag.max = mylagmax,main='Trend')
acf(as.numeric(m$seasonal),na.action=na.pass,lag.max = mylagmax,main='Seasonal')
acf(as.numeric(m$random),na.action=na.pass,lag.max = mylagmax,main='Random')
par(op)
dev.off()
bitmap(file='test3.png')
op <- par(mfrow = c(2,2))
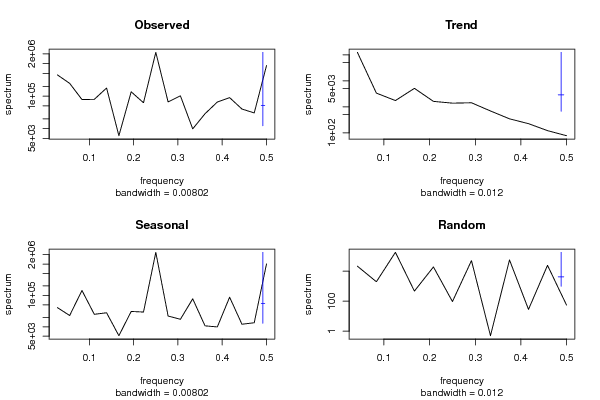
spectrum(as.numeric(x),main='Observed')
spectrum(as.numeric(m$trend[!is.na(m$trend)]),main='Trend')
spectrum(as.numeric(m$seasonal[!is.na(m$seasonal)]),main='Seasonal')
spectrum(as.numeric(m$random[!is.na(m$random)]),main='Random')
par(op)
dev.off()
bitmap(file='test4.png')
op <- par(mfrow = c(2,2))
cpgram(as.numeric(x),main='Observed')
cpgram(as.numeric(m$trend[!is.na(m$trend)]),main='Trend')
cpgram(as.numeric(m$seasonal[!is.na(m$seasonal)]),main='Seasonal')
cpgram(as.numeric(m$random[!is.na(m$random)]),main='Random')
par(op)
dev.off()
load(file='createtable')
a<-table.start()
a<-table.row.start(a)
a<-table.element(a,'Classical Decomposition by Moving Averages',6,TRUE)
a<-table.row.end(a)
a<-table.row.start(a)
a<-table.element(a,'t',header=TRUE)
a<-table.element(a,'Observations',header=TRUE)
a<-table.element(a,'Fit',header=TRUE)
a<-table.element(a,'Trend',header=TRUE)
a<-table.element(a,'Seasonal',header=TRUE)
a<-table.element(a,'Random',header=TRUE)
a<-table.row.end(a)
for (i in 1:length(m$trend)) {
a<-table.row.start(a)
a<-table.element(a,i,header=TRUE)
a<-table.element(a,x[i])
if (par1 == 'additive') a<-table.element(a,signif(m$trend[i]+m$seasonal[i],6)) else a<-table.element(a,signif(m$trend[i]*m$seasonal[i],6))
a<-table.element(a,signif(m$trend[i],6))
a<-table.element(a,signif(m$seasonal[i],6))
a<-table.element(a,signif(m$random[i],6))
a<-table.row.end(a)
}
a<-table.end(a)
table.save(a,file='mytable.tab')