Free Statistics

of Irreproducible Research!

Author's title

Author*The author of this computation has been verified*
R Software Modulerwasp_exponentialsmoothing.wasp
Title produced by softwareExponential Smoothing
Date of computationTue, 13 Dec 2016 16:16:25 +0100
Cite this page as followsStatistical Computations at FreeStatistics.org, Office for Research Development and Education, URL https://freestatistics.org/blog/index.php?v=date/2016/Dec/13/t1481642234qpmw3qj03xua9e2.htm/, Retrieved Sun, 05 May 2024 00:12:56 +0000
Statistical Computations at FreeStatistics.org, Office for Research Development and Education, URL https://freestatistics.org/blog/index.php?pk=299145, Retrieved Sun, 05 May 2024 00:12:56 +0000
QR Codes:

Original text written by user:
IsPrivate?No (this computation is public)
User-defined keywordsF1 smoothing
Estimated Impact47
Family? (F = Feedback message, R = changed R code, M = changed R Module, P = changed Parameters, D = changed Data)
-       [Exponential Smoothing] [N 1059] [2016-12-13 15:16:25] [86c7fb9c8a0af864c0a27e2f433e80d7] [Current]
Feedback Forum

Post a new message
Dataseries X:
2834.4
2860.2
3062.4
3070.6
3166.2
3267.2
3349.4
3449
3400.4
3317.8
3152.8
2998.8
2830.8
2860
2872.4
2999.6
3077
3180.2
3193.4
3244.8
3391
3432.6
3647.8
3459.4
3422
3254.6
3297.6
3412.4
3336.6
3460.2
3437.6
3601.8
3719
3747.8
3791.4
4114.6
4235.8
4317.4
4307.4
4032.8
4073.6
3843.4
3829
3738.8


Summary of computational transaction
Raw Input view raw input (R code)
Raw Outputview raw output of R engine
Computing time2 seconds
R ServerBig Analytics Cloud Computing Center
R Framework error message
Warning: there are blank lines in the 'Data' field.
Please, use NA for missing data - blank lines are simply
 deleted and are NOT treated as missing values.

\begin{tabular}{lllllllll}
\hline
Summary of computational transaction \tabularnewline
Raw Input view raw input (R code)  \tabularnewline
Raw Outputview raw output of R engine  \tabularnewline
Computing time2 seconds \tabularnewline
R ServerBig Analytics Cloud Computing Center \tabularnewline
R Framework error message & 
Warning: there are blank lines in the 'Data' field.
Please, use NA for missing data - blank lines are simply
 deleted and are NOT treated as missing values.
\tabularnewline \hline \end{tabular} %Source: https://freestatistics.org/blog/index.php?pk=299145&T=0

[TABLE]
[ROW]
Summary of computational transaction[/C][/ROW] [ROW]Raw Input[/C] view raw input (R code) [/C][/ROW] [ROW]Raw Output[/C]view raw output of R engine [/C][/ROW] [ROW]Computing time[/C]2 seconds[/C][/ROW] [ROW]R Server[/C]Big Analytics Cloud Computing Center[/C][/ROW] [ROW]R Framework error message[/C][C]
Warning: there are blank lines in the 'Data' field.
Please, use NA for missing data - blank lines are simply
 deleted and are NOT treated as missing values.
[/C][/ROW] [/TABLE] Source: https://freestatistics.org/blog/index.php?pk=299145&T=0

Globally Unique Identifier (entire table): ba.freestatistics.org/blog/index.php?pk=299145&T=0

As an alternative you can also use a QR Code:  

The GUIDs for individual cells are displayed in the table below:

Summary of computational transaction
Raw Input view raw input (R code)
Raw Outputview raw output of R engine
Computing time2 seconds
R ServerBig Analytics Cloud Computing Center
R Framework error message
Warning: there are blank lines in the 'Data' field.
Please, use NA for missing data - blank lines are simply
 deleted and are NOT treated as missing values.


Estimated Parameters of Exponential Smoothing
ParameterValue
alpha1
beta0
gammaFALSE

\begin{tabular}{lllllllll}
\hline
Estimated Parameters of Exponential Smoothing \tabularnewline
Parameter & Value \tabularnewline
alpha & 1 \tabularnewline
beta & 0 \tabularnewline
gamma & FALSE \tabularnewline
\hline
\end{tabular}
%Source: https://freestatistics.org/blog/index.php?pk=299145&T=1

[TABLE]
[ROW][C]Estimated Parameters of Exponential Smoothing[/C][/ROW]
[ROW][C]Parameter[/C][C]Value[/C][/ROW]
[ROW][C]alpha[/C][C]1[/C][/ROW]
[ROW][C]beta[/C][C]0[/C][/ROW]
[ROW][C]gamma[/C][C]FALSE[/C][/ROW]
[/TABLE]
Source: https://freestatistics.org/blog/index.php?pk=299145&T=1

Globally Unique Identifier (entire table): ba.freestatistics.org/blog/index.php?pk=299145&T=1

As an alternative you can also use a QR Code:  

The GUIDs for individual cells are displayed in the table below:

Estimated Parameters of Exponential Smoothing
ParameterValue
alpha1
beta0
gammaFALSE


Interpolation Forecasts of Exponential Smoothing
tObservedFittedResiduals
33062.42886176.400000000001
43070.63088.2-17.5999999999999
53166.23096.469.8000000000002
63267.2319275.2000000000003
73349.4329356.4000000000005
834493375.273.8000000000002
93400.43474.8-74.3999999999996
103317.83426.2-108.4
113152.83343.6-190.8
122998.83178.6-179.8
132830.83024.6-193.8
1428602856.63.40000000000009
152872.42885.8-13.3999999999996
162999.62898.2101.4
1730773025.451.6000000000004
183180.23102.877.4000000000001
193193.43206-12.5999999999995
203244.83219.225.6000000000004
2133913270.6120.4
223432.63416.815.8000000000002
233647.83458.4189.400000000001
243459.43673.6-214.2
2534223485.2-63.1999999999998
263254.63447.8-193.2
273297.63280.417.2000000000003
283412.43323.489.0000000000005
293336.63438.2-101.6
303460.23362.497.8000000000002
313437.63486-48.3999999999996
323601.83463.4138.400000000001
3337193627.691.4000000000001
343747.83744.83.00000000000045
353791.43773.617.8000000000002
364114.63817.2297.400000000001
374235.84140.495.4000000000005
384317.44261.655.7999999999993
394307.44343.2-35.7999999999993
404032.84333.2-300.399999999999
414073.64058.615
423843.44099.4-256
4338293869.2-40.1999999999998
443738.83854.8-116

\begin{tabular}{lllllllll}
\hline
Interpolation Forecasts of Exponential Smoothing \tabularnewline
t & Observed & Fitted & Residuals \tabularnewline
3 & 3062.4 & 2886 & 176.400000000001 \tabularnewline
4 & 3070.6 & 3088.2 & -17.5999999999999 \tabularnewline
5 & 3166.2 & 3096.4 & 69.8000000000002 \tabularnewline
6 & 3267.2 & 3192 & 75.2000000000003 \tabularnewline
7 & 3349.4 & 3293 & 56.4000000000005 \tabularnewline
8 & 3449 & 3375.2 & 73.8000000000002 \tabularnewline
9 & 3400.4 & 3474.8 & -74.3999999999996 \tabularnewline
10 & 3317.8 & 3426.2 & -108.4 \tabularnewline
11 & 3152.8 & 3343.6 & -190.8 \tabularnewline
12 & 2998.8 & 3178.6 & -179.8 \tabularnewline
13 & 2830.8 & 3024.6 & -193.8 \tabularnewline
14 & 2860 & 2856.6 & 3.40000000000009 \tabularnewline
15 & 2872.4 & 2885.8 & -13.3999999999996 \tabularnewline
16 & 2999.6 & 2898.2 & 101.4 \tabularnewline
17 & 3077 & 3025.4 & 51.6000000000004 \tabularnewline
18 & 3180.2 & 3102.8 & 77.4000000000001 \tabularnewline
19 & 3193.4 & 3206 & -12.5999999999995 \tabularnewline
20 & 3244.8 & 3219.2 & 25.6000000000004 \tabularnewline
21 & 3391 & 3270.6 & 120.4 \tabularnewline
22 & 3432.6 & 3416.8 & 15.8000000000002 \tabularnewline
23 & 3647.8 & 3458.4 & 189.400000000001 \tabularnewline
24 & 3459.4 & 3673.6 & -214.2 \tabularnewline
25 & 3422 & 3485.2 & -63.1999999999998 \tabularnewline
26 & 3254.6 & 3447.8 & -193.2 \tabularnewline
27 & 3297.6 & 3280.4 & 17.2000000000003 \tabularnewline
28 & 3412.4 & 3323.4 & 89.0000000000005 \tabularnewline
29 & 3336.6 & 3438.2 & -101.6 \tabularnewline
30 & 3460.2 & 3362.4 & 97.8000000000002 \tabularnewline
31 & 3437.6 & 3486 & -48.3999999999996 \tabularnewline
32 & 3601.8 & 3463.4 & 138.400000000001 \tabularnewline
33 & 3719 & 3627.6 & 91.4000000000001 \tabularnewline
34 & 3747.8 & 3744.8 & 3.00000000000045 \tabularnewline
35 & 3791.4 & 3773.6 & 17.8000000000002 \tabularnewline
36 & 4114.6 & 3817.2 & 297.400000000001 \tabularnewline
37 & 4235.8 & 4140.4 & 95.4000000000005 \tabularnewline
38 & 4317.4 & 4261.6 & 55.7999999999993 \tabularnewline
39 & 4307.4 & 4343.2 & -35.7999999999993 \tabularnewline
40 & 4032.8 & 4333.2 & -300.399999999999 \tabularnewline
41 & 4073.6 & 4058.6 & 15 \tabularnewline
42 & 3843.4 & 4099.4 & -256 \tabularnewline
43 & 3829 & 3869.2 & -40.1999999999998 \tabularnewline
44 & 3738.8 & 3854.8 & -116 \tabularnewline
\hline
\end{tabular}
%Source: https://freestatistics.org/blog/index.php?pk=299145&T=2

[TABLE]
[ROW][C]Interpolation Forecasts of Exponential Smoothing[/C][/ROW]
[ROW][C]t[/C][C]Observed[/C][C]Fitted[/C][C]Residuals[/C][/ROW]
[ROW][C]3[/C][C]3062.4[/C][C]2886[/C][C]176.400000000001[/C][/ROW]
[ROW][C]4[/C][C]3070.6[/C][C]3088.2[/C][C]-17.5999999999999[/C][/ROW]
[ROW][C]5[/C][C]3166.2[/C][C]3096.4[/C][C]69.8000000000002[/C][/ROW]
[ROW][C]6[/C][C]3267.2[/C][C]3192[/C][C]75.2000000000003[/C][/ROW]
[ROW][C]7[/C][C]3349.4[/C][C]3293[/C][C]56.4000000000005[/C][/ROW]
[ROW][C]8[/C][C]3449[/C][C]3375.2[/C][C]73.8000000000002[/C][/ROW]
[ROW][C]9[/C][C]3400.4[/C][C]3474.8[/C][C]-74.3999999999996[/C][/ROW]
[ROW][C]10[/C][C]3317.8[/C][C]3426.2[/C][C]-108.4[/C][/ROW]
[ROW][C]11[/C][C]3152.8[/C][C]3343.6[/C][C]-190.8[/C][/ROW]
[ROW][C]12[/C][C]2998.8[/C][C]3178.6[/C][C]-179.8[/C][/ROW]
[ROW][C]13[/C][C]2830.8[/C][C]3024.6[/C][C]-193.8[/C][/ROW]
[ROW][C]14[/C][C]2860[/C][C]2856.6[/C][C]3.40000000000009[/C][/ROW]
[ROW][C]15[/C][C]2872.4[/C][C]2885.8[/C][C]-13.3999999999996[/C][/ROW]
[ROW][C]16[/C][C]2999.6[/C][C]2898.2[/C][C]101.4[/C][/ROW]
[ROW][C]17[/C][C]3077[/C][C]3025.4[/C][C]51.6000000000004[/C][/ROW]
[ROW][C]18[/C][C]3180.2[/C][C]3102.8[/C][C]77.4000000000001[/C][/ROW]
[ROW][C]19[/C][C]3193.4[/C][C]3206[/C][C]-12.5999999999995[/C][/ROW]
[ROW][C]20[/C][C]3244.8[/C][C]3219.2[/C][C]25.6000000000004[/C][/ROW]
[ROW][C]21[/C][C]3391[/C][C]3270.6[/C][C]120.4[/C][/ROW]
[ROW][C]22[/C][C]3432.6[/C][C]3416.8[/C][C]15.8000000000002[/C][/ROW]
[ROW][C]23[/C][C]3647.8[/C][C]3458.4[/C][C]189.400000000001[/C][/ROW]
[ROW][C]24[/C][C]3459.4[/C][C]3673.6[/C][C]-214.2[/C][/ROW]
[ROW][C]25[/C][C]3422[/C][C]3485.2[/C][C]-63.1999999999998[/C][/ROW]
[ROW][C]26[/C][C]3254.6[/C][C]3447.8[/C][C]-193.2[/C][/ROW]
[ROW][C]27[/C][C]3297.6[/C][C]3280.4[/C][C]17.2000000000003[/C][/ROW]
[ROW][C]28[/C][C]3412.4[/C][C]3323.4[/C][C]89.0000000000005[/C][/ROW]
[ROW][C]29[/C][C]3336.6[/C][C]3438.2[/C][C]-101.6[/C][/ROW]
[ROW][C]30[/C][C]3460.2[/C][C]3362.4[/C][C]97.8000000000002[/C][/ROW]
[ROW][C]31[/C][C]3437.6[/C][C]3486[/C][C]-48.3999999999996[/C][/ROW]
[ROW][C]32[/C][C]3601.8[/C][C]3463.4[/C][C]138.400000000001[/C][/ROW]
[ROW][C]33[/C][C]3719[/C][C]3627.6[/C][C]91.4000000000001[/C][/ROW]
[ROW][C]34[/C][C]3747.8[/C][C]3744.8[/C][C]3.00000000000045[/C][/ROW]
[ROW][C]35[/C][C]3791.4[/C][C]3773.6[/C][C]17.8000000000002[/C][/ROW]
[ROW][C]36[/C][C]4114.6[/C][C]3817.2[/C][C]297.400000000001[/C][/ROW]
[ROW][C]37[/C][C]4235.8[/C][C]4140.4[/C][C]95.4000000000005[/C][/ROW]
[ROW][C]38[/C][C]4317.4[/C][C]4261.6[/C][C]55.7999999999993[/C][/ROW]
[ROW][C]39[/C][C]4307.4[/C][C]4343.2[/C][C]-35.7999999999993[/C][/ROW]
[ROW][C]40[/C][C]4032.8[/C][C]4333.2[/C][C]-300.399999999999[/C][/ROW]
[ROW][C]41[/C][C]4073.6[/C][C]4058.6[/C][C]15[/C][/ROW]
[ROW][C]42[/C][C]3843.4[/C][C]4099.4[/C][C]-256[/C][/ROW]
[ROW][C]43[/C][C]3829[/C][C]3869.2[/C][C]-40.1999999999998[/C][/ROW]
[ROW][C]44[/C][C]3738.8[/C][C]3854.8[/C][C]-116[/C][/ROW]
[/TABLE]
Source: https://freestatistics.org/blog/index.php?pk=299145&T=2

Globally Unique Identifier (entire table): ba.freestatistics.org/blog/index.php?pk=299145&T=2

As an alternative you can also use a QR Code:  

The GUIDs for individual cells are displayed in the table below:

Interpolation Forecasts of Exponential Smoothing
tObservedFittedResiduals
33062.42886176.400000000001
43070.63088.2-17.5999999999999
53166.23096.469.8000000000002
63267.2319275.2000000000003
73349.4329356.4000000000005
834493375.273.8000000000002
93400.43474.8-74.3999999999996
103317.83426.2-108.4
113152.83343.6-190.8
122998.83178.6-179.8
132830.83024.6-193.8
1428602856.63.40000000000009
152872.42885.8-13.3999999999996
162999.62898.2101.4
1730773025.451.6000000000004
183180.23102.877.4000000000001
193193.43206-12.5999999999995
203244.83219.225.6000000000004
2133913270.6120.4
223432.63416.815.8000000000002
233647.83458.4189.400000000001
243459.43673.6-214.2
2534223485.2-63.1999999999998
263254.63447.8-193.2
273297.63280.417.2000000000003
283412.43323.489.0000000000005
293336.63438.2-101.6
303460.23362.497.8000000000002
313437.63486-48.3999999999996
323601.83463.4138.400000000001
3337193627.691.4000000000001
343747.83744.83.00000000000045
353791.43773.617.8000000000002
364114.63817.2297.400000000001
374235.84140.495.4000000000005
384317.44261.655.7999999999993
394307.44343.2-35.7999999999993
404032.84333.2-300.399999999999
414073.64058.615
423843.44099.4-256
4338293869.2-40.1999999999998
443738.83854.8-116


Extrapolation Forecasts of Exponential Smoothing
tForecast95% Lower Bound95% Upper Bound
453764.63515.510168388734013.68983161127
463790.43438.133781886114142.66621811389
473816.23384.76375600054247.6362439995
4838423343.820336777454340.17966322255
493867.83310.818204013224424.78179598678
503893.63283.457012436594503.7429875634
513919.43260.370251441614578.42974855838
523945.23240.667563772214649.73243622779
5339713223.730505166184718.26949483382
543996.83209.108790120564784.49120987943
554022.63196.46248945264848.7375105474
564048.43185.527512000994911.272487999

\begin{tabular}{lllllllll}
\hline
Extrapolation Forecasts of Exponential Smoothing \tabularnewline
t & Forecast & 95% Lower Bound & 95% Upper Bound \tabularnewline
45 & 3764.6 & 3515.51016838873 & 4013.68983161127 \tabularnewline
46 & 3790.4 & 3438.13378188611 & 4142.66621811389 \tabularnewline
47 & 3816.2 & 3384.7637560005 & 4247.6362439995 \tabularnewline
48 & 3842 & 3343.82033677745 & 4340.17966322255 \tabularnewline
49 & 3867.8 & 3310.81820401322 & 4424.78179598678 \tabularnewline
50 & 3893.6 & 3283.45701243659 & 4503.7429875634 \tabularnewline
51 & 3919.4 & 3260.37025144161 & 4578.42974855838 \tabularnewline
52 & 3945.2 & 3240.66756377221 & 4649.73243622779 \tabularnewline
53 & 3971 & 3223.73050516618 & 4718.26949483382 \tabularnewline
54 & 3996.8 & 3209.10879012056 & 4784.49120987943 \tabularnewline
55 & 4022.6 & 3196.4624894526 & 4848.7375105474 \tabularnewline
56 & 4048.4 & 3185.52751200099 & 4911.272487999 \tabularnewline
\hline
\end{tabular}
%Source: https://freestatistics.org/blog/index.php?pk=299145&T=3

[TABLE]
[ROW][C]Extrapolation Forecasts of Exponential Smoothing[/C][/ROW]
[ROW][C]t[/C][C]Forecast[/C][C]95% Lower Bound[/C][C]95% Upper Bound[/C][/ROW]
[ROW][C]45[/C][C]3764.6[/C][C]3515.51016838873[/C][C]4013.68983161127[/C][/ROW]
[ROW][C]46[/C][C]3790.4[/C][C]3438.13378188611[/C][C]4142.66621811389[/C][/ROW]
[ROW][C]47[/C][C]3816.2[/C][C]3384.7637560005[/C][C]4247.6362439995[/C][/ROW]
[ROW][C]48[/C][C]3842[/C][C]3343.82033677745[/C][C]4340.17966322255[/C][/ROW]
[ROW][C]49[/C][C]3867.8[/C][C]3310.81820401322[/C][C]4424.78179598678[/C][/ROW]
[ROW][C]50[/C][C]3893.6[/C][C]3283.45701243659[/C][C]4503.7429875634[/C][/ROW]
[ROW][C]51[/C][C]3919.4[/C][C]3260.37025144161[/C][C]4578.42974855838[/C][/ROW]
[ROW][C]52[/C][C]3945.2[/C][C]3240.66756377221[/C][C]4649.73243622779[/C][/ROW]
[ROW][C]53[/C][C]3971[/C][C]3223.73050516618[/C][C]4718.26949483382[/C][/ROW]
[ROW][C]54[/C][C]3996.8[/C][C]3209.10879012056[/C][C]4784.49120987943[/C][/ROW]
[ROW][C]55[/C][C]4022.6[/C][C]3196.4624894526[/C][C]4848.7375105474[/C][/ROW]
[ROW][C]56[/C][C]4048.4[/C][C]3185.52751200099[/C][C]4911.272487999[/C][/ROW]
[/TABLE]
Source: https://freestatistics.org/blog/index.php?pk=299145&T=3

Globally Unique Identifier (entire table): ba.freestatistics.org/blog/index.php?pk=299145&T=3

As an alternative you can also use a QR Code:  

The GUIDs for individual cells are displayed in the table below:

Extrapolation Forecasts of Exponential Smoothing
tForecast95% Lower Bound95% Upper Bound
453764.63515.510168388734013.68983161127
463790.43438.133781886114142.66621811389
473816.23384.76375600054247.6362439995
4838423343.820336777454340.17966322255
493867.83310.818204013224424.78179598678
503893.63283.457012436594503.7429875634
513919.43260.370251441614578.42974855838
523945.23240.667563772214649.73243622779
5339713223.730505166184718.26949483382
543996.83209.108790120564784.49120987943
554022.63196.46248945264848.7375105474
564048.43185.527512000994911.272487999


Parameters (Session):
par1 = 12 ; par2 = Double ; par3 = additive ; par4 = 12 ;
Parameters (R input):
par1 = 12 ; par2 = Double ; par3 = additive ; par4 = 12 ;
R code (references can be found in the software module):
par1 <- as.numeric(par1)
par4 <- as.numeric(par4)
if (par2 == 'Single') K <- 1
if (par2 == 'Double') K <- 2
if (par2 == 'Triple') K <- par1
nx <- length(x)
nxmK <- nx - K
x <- ts(x, frequency = par1)
if (par2 == 'Single') fit <- HoltWinters(x, gamma=F, beta=F)
if (par2 == 'Double') fit <- HoltWinters(x, gamma=F)
if (par2 == 'Triple') fit <- HoltWinters(x, seasonal=par3)
fit
myresid <- x - fit$fitted[,'xhat']
bitmap(file='test1.png')
op <- par(mfrow=c(2,1))
plot(fit,ylab='Observed (black) / Fitted (red)',main='Interpolation Fit of Exponential Smoothing')
plot(myresid,ylab='Residuals',main='Interpolation Prediction Errors')
par(op)
dev.off()
bitmap(file='test2.png')
p <- predict(fit, par4, prediction.interval=TRUE)
np <- length(p[,1])
plot(fit,p,ylab='Observed (black) / Fitted (red)',main='Extrapolation Fit of Exponential Smoothing')
dev.off()
bitmap(file='test3.png')
op <- par(mfrow = c(2,2))
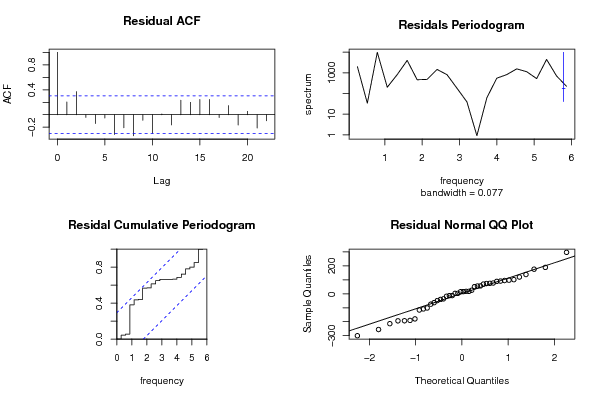
acf(as.numeric(myresid),lag.max = nx/2,main='Residual ACF')
spectrum(myresid,main='Residals Periodogram')
cpgram(myresid,main='Residal Cumulative Periodogram')
qqnorm(myresid,main='Residual Normal QQ Plot')
qqline(myresid)
par(op)
dev.off()
load(file='createtable')
a<-table.start()
a<-table.row.start(a)
a<-table.element(a,'Estimated Parameters of Exponential Smoothing',2,TRUE)
a<-table.row.end(a)
a<-table.row.start(a)
a<-table.element(a,'Parameter',header=TRUE)
a<-table.element(a,'Value',header=TRUE)
a<-table.row.end(a)
a<-table.row.start(a)
a<-table.element(a,'alpha',header=TRUE)
a<-table.element(a,fit$alpha)
a<-table.row.end(a)
a<-table.row.start(a)
a<-table.element(a,'beta',header=TRUE)
a<-table.element(a,fit$beta)
a<-table.row.end(a)
a<-table.row.start(a)
a<-table.element(a,'gamma',header=TRUE)
a<-table.element(a,fit$gamma)
a<-table.row.end(a)
a<-table.end(a)
table.save(a,file='mytable.tab')
a<-table.start()
a<-table.row.start(a)
a<-table.element(a,'Interpolation Forecasts of Exponential Smoothing',4,TRUE)
a<-table.row.end(a)
a<-table.row.start(a)
a<-table.element(a,'t',header=TRUE)
a<-table.element(a,'Observed',header=TRUE)
a<-table.element(a,'Fitted',header=TRUE)
a<-table.element(a,'Residuals',header=TRUE)
a<-table.row.end(a)
for (i in 1:nxmK) {
a<-table.row.start(a)
a<-table.element(a,i+K,header=TRUE)
a<-table.element(a,x[i+K])
a<-table.element(a,fit$fitted[i,'xhat'])
a<-table.element(a,myresid[i])
a<-table.row.end(a)
}
a<-table.end(a)
table.save(a,file='mytable1.tab')
a<-table.start()
a<-table.row.start(a)
a<-table.element(a,'Extrapolation Forecasts of Exponential Smoothing',4,TRUE)
a<-table.row.end(a)
a<-table.row.start(a)
a<-table.element(a,'t',header=TRUE)
a<-table.element(a,'Forecast',header=TRUE)
a<-table.element(a,'95% Lower Bound',header=TRUE)
a<-table.element(a,'95% Upper Bound',header=TRUE)
a<-table.row.end(a)
for (i in 1:np) {
a<-table.row.start(a)
a<-table.element(a,nx+i,header=TRUE)
a<-table.element(a,p[i,'fit'])
a<-table.element(a,p[i,'lwr'])
a<-table.element(a,p[i,'upr'])
a<-table.row.end(a)
}
a<-table.end(a)
table.save(a,file='mytable2.tab')