Free Statistics

of Irreproducible Research!

Author's title

Author*The author of this computation has been verified*
R Software Modulerwasp_exponentialsmoothing.wasp
Title produced by softwareExponential Smoothing
Date of computationTue, 13 Dec 2016 21:16:37 +0100
Cite this page as followsStatistical Computations at FreeStatistics.org, Office for Research Development and Education, URL https://freestatistics.org/blog/index.php?v=date/2016/Dec/13/t1481660302nilfqsxprm9l6e1.htm/, Retrieved Sun, 05 May 2024 08:25:14 +0000
Statistical Computations at FreeStatistics.org, Office for Research Development and Education, URL https://freestatistics.org/blog/index.php?pk=299220, Retrieved Sun, 05 May 2024 08:25:14 +0000
QR Codes:

Original text written by user:
IsPrivate?No (this computation is public)
User-defined keywords
Estimated Impact62
Family? (F = Feedback message, R = changed R code, M = changed R Module, P = changed Parameters, D = changed Data)
-       [Exponential Smoothing] [exponential smoot...] [2016-12-13 20:16:37] [130d73899007e5ff8a4f636b9bcfb397] [Current]
Feedback Forum

Post a new message
Dataseries X:
4786.55
5403.6
6042.4
5824.45
5349.4
5428.2
4906.65
4965.9
4842.3
4638.55
4542.2
4335.15
4445
4750.5
5081.2
5476.35
5359
5358.5
5646.5
5878
6270
6601.5
6792
6871.5
6726.5
6770.5
6611
6711
6089.5
5858.5
5673.5
5531.5
5081.5
5057.5
4979
5003.5


Summary of computational transaction
Raw Input view raw input (R code)
Raw Outputview raw output of R engine
Computing time1 seconds
R ServerBig Analytics Cloud Computing Center

\begin{tabular}{lllllllll}
\hline
Summary of computational transaction \tabularnewline
Raw Input view raw input (R code)  \tabularnewline
Raw Outputview raw output of R engine  \tabularnewline
Computing time1 seconds \tabularnewline
R ServerBig Analytics Cloud Computing Center \tabularnewline
\hline
\end{tabular}
%Source: https://freestatistics.org/blog/index.php?pk=299220&T=0

[TABLE]
[ROW]
Summary of computational transaction[/C][/ROW] [ROW]Raw Input[/C] view raw input (R code) [/C][/ROW] [ROW]Raw Output[/C]view raw output of R engine [/C][/ROW] [ROW]Computing time[/C]1 seconds[/C][/ROW] [ROW]R Server[/C]Big Analytics Cloud Computing Center[/C][/ROW] [/TABLE] Source: https://freestatistics.org/blog/index.php?pk=299220&T=0

Globally Unique Identifier (entire table): ba.freestatistics.org/blog/index.php?pk=299220&T=0

As an alternative you can also use a QR Code:  

The GUIDs for individual cells are displayed in the table below:

Summary of computational transaction
Raw Input view raw input (R code)
Raw Outputview raw output of R engine
Computing time1 seconds
R ServerBig Analytics Cloud Computing Center


Estimated Parameters of Exponential Smoothing
ParameterValue
alpha0.999940451779109
betaFALSE
gammaFALSE

\begin{tabular}{lllllllll}
\hline
Estimated Parameters of Exponential Smoothing \tabularnewline
Parameter & Value \tabularnewline
alpha & 0.999940451779109 \tabularnewline
beta & FALSE \tabularnewline
gamma & FALSE \tabularnewline
\hline
\end{tabular}
%Source: https://freestatistics.org/blog/index.php?pk=299220&T=1

[TABLE]
[ROW][C]Estimated Parameters of Exponential Smoothing[/C][/ROW]
[ROW][C]Parameter[/C][C]Value[/C][/ROW]
[ROW][C]alpha[/C][C]0.999940451779109[/C][/ROW]
[ROW][C]beta[/C][C]FALSE[/C][/ROW]
[ROW][C]gamma[/C][C]FALSE[/C][/ROW]
[/TABLE]
Source: https://freestatistics.org/blog/index.php?pk=299220&T=1

Globally Unique Identifier (entire table): ba.freestatistics.org/blog/index.php?pk=299220&T=1

As an alternative you can also use a QR Code:  

The GUIDs for individual cells are displayed in the table below:

Estimated Parameters of Exponential Smoothing
ParameterValue
alpha0.999940451779109
betaFALSE
gammaFALSE


Interpolation Forecasts of Exponential Smoothing
tObservedFittedResiduals
25403.64786.55617.05
36042.45403.5632557703638.836744229699
45824.456042.36195840844-217.911958408441
55349.45824.46297626943-475.062976269434
65428.25349.4282891550578.7717108449524
74906.655428.19530928476-521.545309284763
84965.94906.6810570952859.2189429047185
94842.34965.89647361731-123.596473617306
104638.554842.30735995011-203.757359950113
114542.24638.56213338828-96.3621333882784
124335.154542.2057381936-207.055738193605
1344454335.16232980083109.837670199166
144750.54444.99345936215305.506540637847
155081.24750.48180762903330.718192370966
165476.355081.18030632003395.169693679973
1753595476.32646834779-117.326468347791
185358.55359.00698658245-0.506986582453465
195646.55358.50003019015287.999969809851
2058785646.48285011418231.517149885819
2162705877.98621356562392.013786434381
226601.56269.97665627645331.523343723547
2367926601.4802583747190.519741625302
246871.56791.9886548883479.5113451116586
256726.56871.49526524086-144.995265240858
266770.56726.5086342100843.9913657899169
2766116770.49738039243-159.497380392432
2867116611.0094977852499.9905022147605
296089.56710.99404574349-621.494045743488
305858.56089.53700886472-231.037008864719
315673.55858.51375784284-185.013757842838
325531.55673.51101724012-142.01101724012
335081.55531.50845650342-450.008456503424
345057.55081.52679720297-24.0267972029706
3549795057.50143075303-78.5014307530273
365003.54979.0046746205424.495325379462

\begin{tabular}{lllllllll}
\hline
Interpolation Forecasts of Exponential Smoothing \tabularnewline
t & Observed & Fitted & Residuals \tabularnewline
2 & 5403.6 & 4786.55 & 617.05 \tabularnewline
3 & 6042.4 & 5403.5632557703 & 638.836744229699 \tabularnewline
4 & 5824.45 & 6042.36195840844 & -217.911958408441 \tabularnewline
5 & 5349.4 & 5824.46297626943 & -475.062976269434 \tabularnewline
6 & 5428.2 & 5349.42828915505 & 78.7717108449524 \tabularnewline
7 & 4906.65 & 5428.19530928476 & -521.545309284763 \tabularnewline
8 & 4965.9 & 4906.68105709528 & 59.2189429047185 \tabularnewline
9 & 4842.3 & 4965.89647361731 & -123.596473617306 \tabularnewline
10 & 4638.55 & 4842.30735995011 & -203.757359950113 \tabularnewline
11 & 4542.2 & 4638.56213338828 & -96.3621333882784 \tabularnewline
12 & 4335.15 & 4542.2057381936 & -207.055738193605 \tabularnewline
13 & 4445 & 4335.16232980083 & 109.837670199166 \tabularnewline
14 & 4750.5 & 4444.99345936215 & 305.506540637847 \tabularnewline
15 & 5081.2 & 4750.48180762903 & 330.718192370966 \tabularnewline
16 & 5476.35 & 5081.18030632003 & 395.169693679973 \tabularnewline
17 & 5359 & 5476.32646834779 & -117.326468347791 \tabularnewline
18 & 5358.5 & 5359.00698658245 & -0.506986582453465 \tabularnewline
19 & 5646.5 & 5358.50003019015 & 287.999969809851 \tabularnewline
20 & 5878 & 5646.48285011418 & 231.517149885819 \tabularnewline
21 & 6270 & 5877.98621356562 & 392.013786434381 \tabularnewline
22 & 6601.5 & 6269.97665627645 & 331.523343723547 \tabularnewline
23 & 6792 & 6601.4802583747 & 190.519741625302 \tabularnewline
24 & 6871.5 & 6791.98865488834 & 79.5113451116586 \tabularnewline
25 & 6726.5 & 6871.49526524086 & -144.995265240858 \tabularnewline
26 & 6770.5 & 6726.50863421008 & 43.9913657899169 \tabularnewline
27 & 6611 & 6770.49738039243 & -159.497380392432 \tabularnewline
28 & 6711 & 6611.00949778524 & 99.9905022147605 \tabularnewline
29 & 6089.5 & 6710.99404574349 & -621.494045743488 \tabularnewline
30 & 5858.5 & 6089.53700886472 & -231.037008864719 \tabularnewline
31 & 5673.5 & 5858.51375784284 & -185.013757842838 \tabularnewline
32 & 5531.5 & 5673.51101724012 & -142.01101724012 \tabularnewline
33 & 5081.5 & 5531.50845650342 & -450.008456503424 \tabularnewline
34 & 5057.5 & 5081.52679720297 & -24.0267972029706 \tabularnewline
35 & 4979 & 5057.50143075303 & -78.5014307530273 \tabularnewline
36 & 5003.5 & 4979.00467462054 & 24.495325379462 \tabularnewline
\hline
\end{tabular}
%Source: https://freestatistics.org/blog/index.php?pk=299220&T=2

[TABLE]
[ROW][C]Interpolation Forecasts of Exponential Smoothing[/C][/ROW]
[ROW][C]t[/C][C]Observed[/C][C]Fitted[/C][C]Residuals[/C][/ROW]
[ROW][C]2[/C][C]5403.6[/C][C]4786.55[/C][C]617.05[/C][/ROW]
[ROW][C]3[/C][C]6042.4[/C][C]5403.5632557703[/C][C]638.836744229699[/C][/ROW]
[ROW][C]4[/C][C]5824.45[/C][C]6042.36195840844[/C][C]-217.911958408441[/C][/ROW]
[ROW][C]5[/C][C]5349.4[/C][C]5824.46297626943[/C][C]-475.062976269434[/C][/ROW]
[ROW][C]6[/C][C]5428.2[/C][C]5349.42828915505[/C][C]78.7717108449524[/C][/ROW]
[ROW][C]7[/C][C]4906.65[/C][C]5428.19530928476[/C][C]-521.545309284763[/C][/ROW]
[ROW][C]8[/C][C]4965.9[/C][C]4906.68105709528[/C][C]59.2189429047185[/C][/ROW]
[ROW][C]9[/C][C]4842.3[/C][C]4965.89647361731[/C][C]-123.596473617306[/C][/ROW]
[ROW][C]10[/C][C]4638.55[/C][C]4842.30735995011[/C][C]-203.757359950113[/C][/ROW]
[ROW][C]11[/C][C]4542.2[/C][C]4638.56213338828[/C][C]-96.3621333882784[/C][/ROW]
[ROW][C]12[/C][C]4335.15[/C][C]4542.2057381936[/C][C]-207.055738193605[/C][/ROW]
[ROW][C]13[/C][C]4445[/C][C]4335.16232980083[/C][C]109.837670199166[/C][/ROW]
[ROW][C]14[/C][C]4750.5[/C][C]4444.99345936215[/C][C]305.506540637847[/C][/ROW]
[ROW][C]15[/C][C]5081.2[/C][C]4750.48180762903[/C][C]330.718192370966[/C][/ROW]
[ROW][C]16[/C][C]5476.35[/C][C]5081.18030632003[/C][C]395.169693679973[/C][/ROW]
[ROW][C]17[/C][C]5359[/C][C]5476.32646834779[/C][C]-117.326468347791[/C][/ROW]
[ROW][C]18[/C][C]5358.5[/C][C]5359.00698658245[/C][C]-0.506986582453465[/C][/ROW]
[ROW][C]19[/C][C]5646.5[/C][C]5358.50003019015[/C][C]287.999969809851[/C][/ROW]
[ROW][C]20[/C][C]5878[/C][C]5646.48285011418[/C][C]231.517149885819[/C][/ROW]
[ROW][C]21[/C][C]6270[/C][C]5877.98621356562[/C][C]392.013786434381[/C][/ROW]
[ROW][C]22[/C][C]6601.5[/C][C]6269.97665627645[/C][C]331.523343723547[/C][/ROW]
[ROW][C]23[/C][C]6792[/C][C]6601.4802583747[/C][C]190.519741625302[/C][/ROW]
[ROW][C]24[/C][C]6871.5[/C][C]6791.98865488834[/C][C]79.5113451116586[/C][/ROW]
[ROW][C]25[/C][C]6726.5[/C][C]6871.49526524086[/C][C]-144.995265240858[/C][/ROW]
[ROW][C]26[/C][C]6770.5[/C][C]6726.50863421008[/C][C]43.9913657899169[/C][/ROW]
[ROW][C]27[/C][C]6611[/C][C]6770.49738039243[/C][C]-159.497380392432[/C][/ROW]
[ROW][C]28[/C][C]6711[/C][C]6611.00949778524[/C][C]99.9905022147605[/C][/ROW]
[ROW][C]29[/C][C]6089.5[/C][C]6710.99404574349[/C][C]-621.494045743488[/C][/ROW]
[ROW][C]30[/C][C]5858.5[/C][C]6089.53700886472[/C][C]-231.037008864719[/C][/ROW]
[ROW][C]31[/C][C]5673.5[/C][C]5858.51375784284[/C][C]-185.013757842838[/C][/ROW]
[ROW][C]32[/C][C]5531.5[/C][C]5673.51101724012[/C][C]-142.01101724012[/C][/ROW]
[ROW][C]33[/C][C]5081.5[/C][C]5531.50845650342[/C][C]-450.008456503424[/C][/ROW]
[ROW][C]34[/C][C]5057.5[/C][C]5081.52679720297[/C][C]-24.0267972029706[/C][/ROW]
[ROW][C]35[/C][C]4979[/C][C]5057.50143075303[/C][C]-78.5014307530273[/C][/ROW]
[ROW][C]36[/C][C]5003.5[/C][C]4979.00467462054[/C][C]24.495325379462[/C][/ROW]
[/TABLE]
Source: https://freestatistics.org/blog/index.php?pk=299220&T=2

Globally Unique Identifier (entire table): ba.freestatistics.org/blog/index.php?pk=299220&T=2

As an alternative you can also use a QR Code:  

The GUIDs for individual cells are displayed in the table below:

Interpolation Forecasts of Exponential Smoothing
tObservedFittedResiduals
25403.64786.55617.05
36042.45403.5632557703638.836744229699
45824.456042.36195840844-217.911958408441
55349.45824.46297626943-475.062976269434
65428.25349.4282891550578.7717108449524
74906.655428.19530928476-521.545309284763
84965.94906.6810570952859.2189429047185
94842.34965.89647361731-123.596473617306
104638.554842.30735995011-203.757359950113
114542.24638.56213338828-96.3621333882784
124335.154542.2057381936-207.055738193605
1344454335.16232980083109.837670199166
144750.54444.99345936215305.506540637847
155081.24750.48180762903330.718192370966
165476.355081.18030632003395.169693679973
1753595476.32646834779-117.326468347791
185358.55359.00698658245-0.506986582453465
195646.55358.50003019015287.999969809851
2058785646.48285011418231.517149885819
2162705877.98621356562392.013786434381
226601.56269.97665627645331.523343723547
2367926601.4802583747190.519741625302
246871.56791.9886548883479.5113451116586
256726.56871.49526524086-144.995265240858
266770.56726.5086342100843.9913657899169
2766116770.49738039243-159.497380392432
2867116611.0094977852499.9905022147605
296089.56710.99404574349-621.494045743488
305858.56089.53700886472-231.037008864719
315673.55858.51375784284-185.013757842838
325531.55673.51101724012-142.01101724012
335081.55531.50845650342-450.008456503424
345057.55081.52679720297-24.0267972029706
3549795057.50143075303-78.5014307530273
365003.54979.0046746205424.495325379462


Extrapolation Forecasts of Exponential Smoothing
tForecast95% Lower Bound95% Upper Bound
375003.498541346954417.330003484955589.66707920896
385003.498541346954174.555726668445832.44135602547
395003.498541346953988.265156732856018.73192596105
405003.498541346953831.213823173566175.78325952034
415003.498541346953692.848284531386314.14879816253
425003.498541346953567.755970090336439.24111260358
435003.498541346953452.721521222386554.27556147153
445003.498541346953345.649935057976661.34714763593
455003.498541346953245.086008235866761.91107445805
465003.498541346953149.970210883666857.02687181025
475003.498541346953059.502680482566947.49440221135
485003.498541346952973.062001514757033.93508117916

\begin{tabular}{lllllllll}
\hline
Extrapolation Forecasts of Exponential Smoothing \tabularnewline
t & Forecast & 95% Lower Bound & 95% Upper Bound \tabularnewline
37 & 5003.49854134695 & 4417.33000348495 & 5589.66707920896 \tabularnewline
38 & 5003.49854134695 & 4174.55572666844 & 5832.44135602547 \tabularnewline
39 & 5003.49854134695 & 3988.26515673285 & 6018.73192596105 \tabularnewline
40 & 5003.49854134695 & 3831.21382317356 & 6175.78325952034 \tabularnewline
41 & 5003.49854134695 & 3692.84828453138 & 6314.14879816253 \tabularnewline
42 & 5003.49854134695 & 3567.75597009033 & 6439.24111260358 \tabularnewline
43 & 5003.49854134695 & 3452.72152122238 & 6554.27556147153 \tabularnewline
44 & 5003.49854134695 & 3345.64993505797 & 6661.34714763593 \tabularnewline
45 & 5003.49854134695 & 3245.08600823586 & 6761.91107445805 \tabularnewline
46 & 5003.49854134695 & 3149.97021088366 & 6857.02687181025 \tabularnewline
47 & 5003.49854134695 & 3059.50268048256 & 6947.49440221135 \tabularnewline
48 & 5003.49854134695 & 2973.06200151475 & 7033.93508117916 \tabularnewline
\hline
\end{tabular}
%Source: https://freestatistics.org/blog/index.php?pk=299220&T=3

[TABLE]
[ROW][C]Extrapolation Forecasts of Exponential Smoothing[/C][/ROW]
[ROW][C]t[/C][C]Forecast[/C][C]95% Lower Bound[/C][C]95% Upper Bound[/C][/ROW]
[ROW][C]37[/C][C]5003.49854134695[/C][C]4417.33000348495[/C][C]5589.66707920896[/C][/ROW]
[ROW][C]38[/C][C]5003.49854134695[/C][C]4174.55572666844[/C][C]5832.44135602547[/C][/ROW]
[ROW][C]39[/C][C]5003.49854134695[/C][C]3988.26515673285[/C][C]6018.73192596105[/C][/ROW]
[ROW][C]40[/C][C]5003.49854134695[/C][C]3831.21382317356[/C][C]6175.78325952034[/C][/ROW]
[ROW][C]41[/C][C]5003.49854134695[/C][C]3692.84828453138[/C][C]6314.14879816253[/C][/ROW]
[ROW][C]42[/C][C]5003.49854134695[/C][C]3567.75597009033[/C][C]6439.24111260358[/C][/ROW]
[ROW][C]43[/C][C]5003.49854134695[/C][C]3452.72152122238[/C][C]6554.27556147153[/C][/ROW]
[ROW][C]44[/C][C]5003.49854134695[/C][C]3345.64993505797[/C][C]6661.34714763593[/C][/ROW]
[ROW][C]45[/C][C]5003.49854134695[/C][C]3245.08600823586[/C][C]6761.91107445805[/C][/ROW]
[ROW][C]46[/C][C]5003.49854134695[/C][C]3149.97021088366[/C][C]6857.02687181025[/C][/ROW]
[ROW][C]47[/C][C]5003.49854134695[/C][C]3059.50268048256[/C][C]6947.49440221135[/C][/ROW]
[ROW][C]48[/C][C]5003.49854134695[/C][C]2973.06200151475[/C][C]7033.93508117916[/C][/ROW]
[/TABLE]
Source: https://freestatistics.org/blog/index.php?pk=299220&T=3

Globally Unique Identifier (entire table): ba.freestatistics.org/blog/index.php?pk=299220&T=3

As an alternative you can also use a QR Code:  

The GUIDs for individual cells are displayed in the table below:

Extrapolation Forecasts of Exponential Smoothing
tForecast95% Lower Bound95% Upper Bound
375003.498541346954417.330003484955589.66707920896
385003.498541346954174.555726668445832.44135602547
395003.498541346953988.265156732856018.73192596105
405003.498541346953831.213823173566175.78325952034
415003.498541346953692.848284531386314.14879816253
425003.498541346953567.755970090336439.24111260358
435003.498541346953452.721521222386554.27556147153
445003.498541346953345.649935057976661.34714763593
455003.498541346953245.086008235866761.91107445805
465003.498541346953149.970210883666857.02687181025
475003.498541346953059.502680482566947.49440221135
485003.498541346952973.062001514757033.93508117916


Parameters (Session):
par1 = 12 ; par2 = Single ; par3 = additive ; par4 = 12 ;
Parameters (R input):
par1 = 12 ; par2 = Single ; par3 = additive ; par4 = 12 ;
R code (references can be found in the software module):
par1 <- as.numeric(par1)
par4 <- as.numeric(par4)
if (par2 == 'Single') K <- 1
if (par2 == 'Double') K <- 2
if (par2 == 'Triple') K <- par1
nx <- length(x)
nxmK <- nx - K
x <- ts(x, frequency = par1)
if (par2 == 'Single') fit <- HoltWinters(x, gamma=F, beta=F)
if (par2 == 'Double') fit <- HoltWinters(x, gamma=F)
if (par2 == 'Triple') fit <- HoltWinters(x, seasonal=par3)
fit
myresid <- x - fit$fitted[,'xhat']
bitmap(file='test1.png')
op <- par(mfrow=c(2,1))
plot(fit,ylab='Observed (black) / Fitted (red)',main='Interpolation Fit of Exponential Smoothing')
plot(myresid,ylab='Residuals',main='Interpolation Prediction Errors')
par(op)
dev.off()
bitmap(file='test2.png')
p <- predict(fit, par4, prediction.interval=TRUE)
np <- length(p[,1])
plot(fit,p,ylab='Observed (black) / Fitted (red)',main='Extrapolation Fit of Exponential Smoothing')
dev.off()
bitmap(file='test3.png')
op <- par(mfrow = c(2,2))
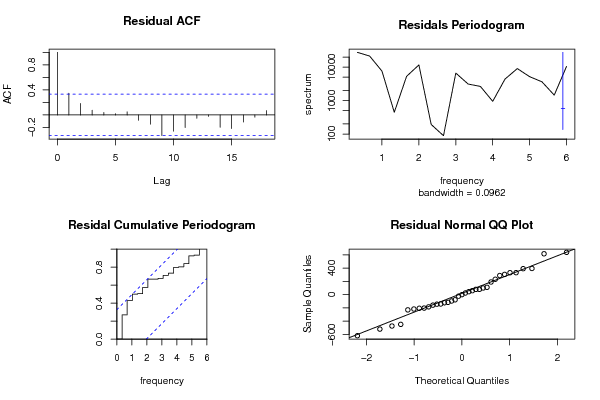
acf(as.numeric(myresid),lag.max = nx/2,main='Residual ACF')
spectrum(myresid,main='Residals Periodogram')
cpgram(myresid,main='Residal Cumulative Periodogram')
qqnorm(myresid,main='Residual Normal QQ Plot')
qqline(myresid)
par(op)
dev.off()
load(file='createtable')
a<-table.start()
a<-table.row.start(a)
a<-table.element(a,'Estimated Parameters of Exponential Smoothing',2,TRUE)
a<-table.row.end(a)
a<-table.row.start(a)
a<-table.element(a,'Parameter',header=TRUE)
a<-table.element(a,'Value',header=TRUE)
a<-table.row.end(a)
a<-table.row.start(a)
a<-table.element(a,'alpha',header=TRUE)
a<-table.element(a,fit$alpha)
a<-table.row.end(a)
a<-table.row.start(a)
a<-table.element(a,'beta',header=TRUE)
a<-table.element(a,fit$beta)
a<-table.row.end(a)
a<-table.row.start(a)
a<-table.element(a,'gamma',header=TRUE)
a<-table.element(a,fit$gamma)
a<-table.row.end(a)
a<-table.end(a)
table.save(a,file='mytable.tab')
a<-table.start()
a<-table.row.start(a)
a<-table.element(a,'Interpolation Forecasts of Exponential Smoothing',4,TRUE)
a<-table.row.end(a)
a<-table.row.start(a)
a<-table.element(a,'t',header=TRUE)
a<-table.element(a,'Observed',header=TRUE)
a<-table.element(a,'Fitted',header=TRUE)
a<-table.element(a,'Residuals',header=TRUE)
a<-table.row.end(a)
for (i in 1:nxmK) {
a<-table.row.start(a)
a<-table.element(a,i+K,header=TRUE)
a<-table.element(a,x[i+K])
a<-table.element(a,fit$fitted[i,'xhat'])
a<-table.element(a,myresid[i])
a<-table.row.end(a)
}
a<-table.end(a)
table.save(a,file='mytable1.tab')
a<-table.start()
a<-table.row.start(a)
a<-table.element(a,'Extrapolation Forecasts of Exponential Smoothing',4,TRUE)
a<-table.row.end(a)
a<-table.row.start(a)
a<-table.element(a,'t',header=TRUE)
a<-table.element(a,'Forecast',header=TRUE)
a<-table.element(a,'95% Lower Bound',header=TRUE)
a<-table.element(a,'95% Upper Bound',header=TRUE)
a<-table.row.end(a)
for (i in 1:np) {
a<-table.row.start(a)
a<-table.element(a,nx+i,header=TRUE)
a<-table.element(a,p[i,'fit'])
a<-table.element(a,p[i,'lwr'])
a<-table.element(a,p[i,'upr'])
a<-table.row.end(a)
}
a<-table.end(a)
table.save(a,file='mytable2.tab')