Free Statistics

of Irreproducible Research!

Author's title

Author*The author of this computation has been verified*
R Software Modulerwasp_exponentialsmoothing.wasp
Title produced by softwareExponential Smoothing
Date of computationTue, 13 Dec 2016 22:21:13 +0100
Cite this page as followsStatistical Computations at FreeStatistics.org, Office for Research Development and Education, URL https://freestatistics.org/blog/index.php?v=date/2016/Dec/13/t1481664108efkyv9rlco9idaw.htm/, Retrieved Sun, 05 May 2024 01:02:06 +0000
Statistical Computations at FreeStatistics.org, Office for Research Development and Education, URL https://freestatistics.org/blog/index.php?pk=299235, Retrieved Sun, 05 May 2024 01:02:06 +0000
QR Codes:

Original text written by user:
IsPrivate?No (this computation is public)
User-defined keywords
Estimated Impact44
Family? (F = Feedback message, R = changed R code, M = changed R Module, P = changed Parameters, D = changed Data)
-       [Exponential Smoothing] [] [2016-12-13 21:21:13] [130d73899007e5ff8a4f636b9bcfb397] [Current]
Feedback Forum

Post a new message
Dataseries X:
1737.4
1934.4
1716
1894.6
2078.4
2116.4
2132.8
1874.2
2021.4
2109
2101.2
1913
1965
1903.4
1837.4
1888
1912
1971.4
2041.6
2132.2
2075.4
2172
2284.6
2396.4
2539.4
2688
2964.2
3375.6
3271.4
3714.8
3989.4
4367.2
5070.4
5651.6
6180.8
5428.6
5346.4
5891.8
5527
5191.4
5324.6


Summary of computational transaction
Raw Input view raw input (R code)
Raw Outputview raw output of R engine
Computing time1 seconds
R ServerBig Analytics Cloud Computing Center

\begin{tabular}{lllllllll}
\hline
Summary of computational transaction \tabularnewline
Raw Input view raw input (R code)  \tabularnewline
Raw Outputview raw output of R engine  \tabularnewline
Computing time1 seconds \tabularnewline
R ServerBig Analytics Cloud Computing Center \tabularnewline
\hline
\end{tabular}
%Source: https://freestatistics.org/blog/index.php?pk=299235&T=0

[TABLE]
[ROW]
Summary of computational transaction[/C][/ROW] [ROW]Raw Input[/C] view raw input (R code) [/C][/ROW] [ROW]Raw Output[/C]view raw output of R engine [/C][/ROW] [ROW]Computing time[/C]1 seconds[/C][/ROW] [ROW]R Server[/C]Big Analytics Cloud Computing Center[/C][/ROW] [/TABLE] Source: https://freestatistics.org/blog/index.php?pk=299235&T=0

Globally Unique Identifier (entire table): ba.freestatistics.org/blog/index.php?pk=299235&T=0

As an alternative you can also use a QR Code:  

The GUIDs for individual cells are displayed in the table below:

Summary of computational transaction
Raw Input view raw input (R code)
Raw Outputview raw output of R engine
Computing time1 seconds
R ServerBig Analytics Cloud Computing Center


Estimated Parameters of Exponential Smoothing
ParameterValue
alpha0.999953443816346
betaFALSE
gammaFALSE

\begin{tabular}{lllllllll}
\hline
Estimated Parameters of Exponential Smoothing \tabularnewline
Parameter & Value \tabularnewline
alpha & 0.999953443816346 \tabularnewline
beta & FALSE \tabularnewline
gamma & FALSE \tabularnewline
\hline
\end{tabular}
%Source: https://freestatistics.org/blog/index.php?pk=299235&T=1

[TABLE]
[ROW][C]Estimated Parameters of Exponential Smoothing[/C][/ROW]
[ROW][C]Parameter[/C][C]Value[/C][/ROW]
[ROW][C]alpha[/C][C]0.999953443816346[/C][/ROW]
[ROW][C]beta[/C][C]FALSE[/C][/ROW]
[ROW][C]gamma[/C][C]FALSE[/C][/ROW]
[/TABLE]
Source: https://freestatistics.org/blog/index.php?pk=299235&T=1

Globally Unique Identifier (entire table): ba.freestatistics.org/blog/index.php?pk=299235&T=1

As an alternative you can also use a QR Code:  

The GUIDs for individual cells are displayed in the table below:

Estimated Parameters of Exponential Smoothing
ParameterValue
alpha0.999953443816346
betaFALSE
gammaFALSE


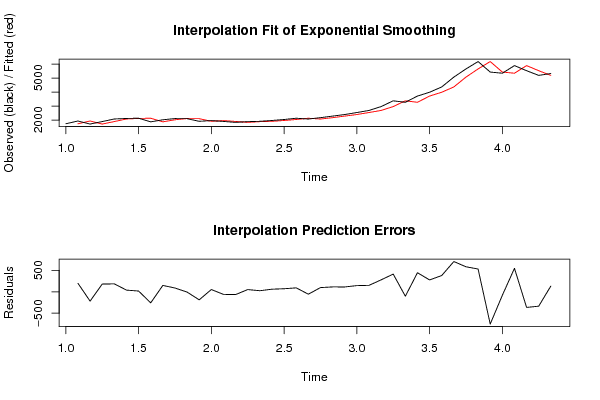
Interpolation Forecasts of Exponential Smoothing
tObservedFittedResiduals
21934.41737.4197
317161934.39082843182-218.39082843182
41894.61716.01016744352178.589832556483
52078.41894.59168553896183.808314461043
62116.42078.3914425863538.0085574136451
72132.82116.3982304666216.4017695333791
81874.22132.79923639621-258.599236396206
92021.41874.21203939354147.187960606458
1021092021.3931474902787.6068525097255
112101.22108.99592135929-7.79592135928533
1219132101.20036294835-188.200362948347
1319651913.0087618906651.9912381093388
141903.41964.99757948637-61.59757948637
151837.41903.40286774822-66.002867748223
1618881837.4030728416350.5969271583674
1719121887.9976444001724.0023555998332
181971.41911.9988825419259.4011174580755
192041.61971.3972345106770.2027654893336
202132.22041.5967316271690.6032683728431
212075.42132.1957818576-56.7957818575978
2221722075.4026441948596.5973558051492
232284.62171.99550279576112.604497204237
242396.42284.59475756435111.805242435652
252539.42396.3947947746143.0052052254
2626882539.3933422234148.606657776598
272964.22687.99308144115276.206918558851
283375.62964.18714085997411.412859140027
293271.43375.58084618737-104.180846187372
303714.83271.40485026261443.395149737392
313989.43714.77935721398274.620642786022
324367.23989.38721471092377.81278528908
335070.44367.18241047858703.217589521419
345651.65070.36726087275581.232739127247
356180.85651.57294002185529.227059978148
365428.66180.7753612078-752.1753612078
375346.45428.63501841426-82.235018414257
385891.85346.40382854862545.39617145138
3955275891.77460843568-364.774608435678
405191.45527.01698251366-335.616982513662
415324.65191.41562504588133.184374954125

\begin{tabular}{lllllllll}
\hline
Interpolation Forecasts of Exponential Smoothing \tabularnewline
t & Observed & Fitted & Residuals \tabularnewline
2 & 1934.4 & 1737.4 & 197 \tabularnewline
3 & 1716 & 1934.39082843182 & -218.39082843182 \tabularnewline
4 & 1894.6 & 1716.01016744352 & 178.589832556483 \tabularnewline
5 & 2078.4 & 1894.59168553896 & 183.808314461043 \tabularnewline
6 & 2116.4 & 2078.39144258635 & 38.0085574136451 \tabularnewline
7 & 2132.8 & 2116.39823046662 & 16.4017695333791 \tabularnewline
8 & 1874.2 & 2132.79923639621 & -258.599236396206 \tabularnewline
9 & 2021.4 & 1874.21203939354 & 147.187960606458 \tabularnewline
10 & 2109 & 2021.39314749027 & 87.6068525097255 \tabularnewline
11 & 2101.2 & 2108.99592135929 & -7.79592135928533 \tabularnewline
12 & 1913 & 2101.20036294835 & -188.200362948347 \tabularnewline
13 & 1965 & 1913.00876189066 & 51.9912381093388 \tabularnewline
14 & 1903.4 & 1964.99757948637 & -61.59757948637 \tabularnewline
15 & 1837.4 & 1903.40286774822 & -66.002867748223 \tabularnewline
16 & 1888 & 1837.40307284163 & 50.5969271583674 \tabularnewline
17 & 1912 & 1887.99764440017 & 24.0023555998332 \tabularnewline
18 & 1971.4 & 1911.99888254192 & 59.4011174580755 \tabularnewline
19 & 2041.6 & 1971.39723451067 & 70.2027654893336 \tabularnewline
20 & 2132.2 & 2041.59673162716 & 90.6032683728431 \tabularnewline
21 & 2075.4 & 2132.1957818576 & -56.7957818575978 \tabularnewline
22 & 2172 & 2075.40264419485 & 96.5973558051492 \tabularnewline
23 & 2284.6 & 2171.99550279576 & 112.604497204237 \tabularnewline
24 & 2396.4 & 2284.59475756435 & 111.805242435652 \tabularnewline
25 & 2539.4 & 2396.3947947746 & 143.0052052254 \tabularnewline
26 & 2688 & 2539.3933422234 & 148.606657776598 \tabularnewline
27 & 2964.2 & 2687.99308144115 & 276.206918558851 \tabularnewline
28 & 3375.6 & 2964.18714085997 & 411.412859140027 \tabularnewline
29 & 3271.4 & 3375.58084618737 & -104.180846187372 \tabularnewline
30 & 3714.8 & 3271.40485026261 & 443.395149737392 \tabularnewline
31 & 3989.4 & 3714.77935721398 & 274.620642786022 \tabularnewline
32 & 4367.2 & 3989.38721471092 & 377.81278528908 \tabularnewline
33 & 5070.4 & 4367.18241047858 & 703.217589521419 \tabularnewline
34 & 5651.6 & 5070.36726087275 & 581.232739127247 \tabularnewline
35 & 6180.8 & 5651.57294002185 & 529.227059978148 \tabularnewline
36 & 5428.6 & 6180.7753612078 & -752.1753612078 \tabularnewline
37 & 5346.4 & 5428.63501841426 & -82.235018414257 \tabularnewline
38 & 5891.8 & 5346.40382854862 & 545.39617145138 \tabularnewline
39 & 5527 & 5891.77460843568 & -364.774608435678 \tabularnewline
40 & 5191.4 & 5527.01698251366 & -335.616982513662 \tabularnewline
41 & 5324.6 & 5191.41562504588 & 133.184374954125 \tabularnewline
\hline
\end{tabular}
%Source: https://freestatistics.org/blog/index.php?pk=299235&T=2

[TABLE]
[ROW][C]Interpolation Forecasts of Exponential Smoothing[/C][/ROW]
[ROW][C]t[/C][C]Observed[/C][C]Fitted[/C][C]Residuals[/C][/ROW]
[ROW][C]2[/C][C]1934.4[/C][C]1737.4[/C][C]197[/C][/ROW]
[ROW][C]3[/C][C]1716[/C][C]1934.39082843182[/C][C]-218.39082843182[/C][/ROW]
[ROW][C]4[/C][C]1894.6[/C][C]1716.01016744352[/C][C]178.589832556483[/C][/ROW]
[ROW][C]5[/C][C]2078.4[/C][C]1894.59168553896[/C][C]183.808314461043[/C][/ROW]
[ROW][C]6[/C][C]2116.4[/C][C]2078.39144258635[/C][C]38.0085574136451[/C][/ROW]
[ROW][C]7[/C][C]2132.8[/C][C]2116.39823046662[/C][C]16.4017695333791[/C][/ROW]
[ROW][C]8[/C][C]1874.2[/C][C]2132.79923639621[/C][C]-258.599236396206[/C][/ROW]
[ROW][C]9[/C][C]2021.4[/C][C]1874.21203939354[/C][C]147.187960606458[/C][/ROW]
[ROW][C]10[/C][C]2109[/C][C]2021.39314749027[/C][C]87.6068525097255[/C][/ROW]
[ROW][C]11[/C][C]2101.2[/C][C]2108.99592135929[/C][C]-7.79592135928533[/C][/ROW]
[ROW][C]12[/C][C]1913[/C][C]2101.20036294835[/C][C]-188.200362948347[/C][/ROW]
[ROW][C]13[/C][C]1965[/C][C]1913.00876189066[/C][C]51.9912381093388[/C][/ROW]
[ROW][C]14[/C][C]1903.4[/C][C]1964.99757948637[/C][C]-61.59757948637[/C][/ROW]
[ROW][C]15[/C][C]1837.4[/C][C]1903.40286774822[/C][C]-66.002867748223[/C][/ROW]
[ROW][C]16[/C][C]1888[/C][C]1837.40307284163[/C][C]50.5969271583674[/C][/ROW]
[ROW][C]17[/C][C]1912[/C][C]1887.99764440017[/C][C]24.0023555998332[/C][/ROW]
[ROW][C]18[/C][C]1971.4[/C][C]1911.99888254192[/C][C]59.4011174580755[/C][/ROW]
[ROW][C]19[/C][C]2041.6[/C][C]1971.39723451067[/C][C]70.2027654893336[/C][/ROW]
[ROW][C]20[/C][C]2132.2[/C][C]2041.59673162716[/C][C]90.6032683728431[/C][/ROW]
[ROW][C]21[/C][C]2075.4[/C][C]2132.1957818576[/C][C]-56.7957818575978[/C][/ROW]
[ROW][C]22[/C][C]2172[/C][C]2075.40264419485[/C][C]96.5973558051492[/C][/ROW]
[ROW][C]23[/C][C]2284.6[/C][C]2171.99550279576[/C][C]112.604497204237[/C][/ROW]
[ROW][C]24[/C][C]2396.4[/C][C]2284.59475756435[/C][C]111.805242435652[/C][/ROW]
[ROW][C]25[/C][C]2539.4[/C][C]2396.3947947746[/C][C]143.0052052254[/C][/ROW]
[ROW][C]26[/C][C]2688[/C][C]2539.3933422234[/C][C]148.606657776598[/C][/ROW]
[ROW][C]27[/C][C]2964.2[/C][C]2687.99308144115[/C][C]276.206918558851[/C][/ROW]
[ROW][C]28[/C][C]3375.6[/C][C]2964.18714085997[/C][C]411.412859140027[/C][/ROW]
[ROW][C]29[/C][C]3271.4[/C][C]3375.58084618737[/C][C]-104.180846187372[/C][/ROW]
[ROW][C]30[/C][C]3714.8[/C][C]3271.40485026261[/C][C]443.395149737392[/C][/ROW]
[ROW][C]31[/C][C]3989.4[/C][C]3714.77935721398[/C][C]274.620642786022[/C][/ROW]
[ROW][C]32[/C][C]4367.2[/C][C]3989.38721471092[/C][C]377.81278528908[/C][/ROW]
[ROW][C]33[/C][C]5070.4[/C][C]4367.18241047858[/C][C]703.217589521419[/C][/ROW]
[ROW][C]34[/C][C]5651.6[/C][C]5070.36726087275[/C][C]581.232739127247[/C][/ROW]
[ROW][C]35[/C][C]6180.8[/C][C]5651.57294002185[/C][C]529.227059978148[/C][/ROW]
[ROW][C]36[/C][C]5428.6[/C][C]6180.7753612078[/C][C]-752.1753612078[/C][/ROW]
[ROW][C]37[/C][C]5346.4[/C][C]5428.63501841426[/C][C]-82.235018414257[/C][/ROW]
[ROW][C]38[/C][C]5891.8[/C][C]5346.40382854862[/C][C]545.39617145138[/C][/ROW]
[ROW][C]39[/C][C]5527[/C][C]5891.77460843568[/C][C]-364.774608435678[/C][/ROW]
[ROW][C]40[/C][C]5191.4[/C][C]5527.01698251366[/C][C]-335.616982513662[/C][/ROW]
[ROW][C]41[/C][C]5324.6[/C][C]5191.41562504588[/C][C]133.184374954125[/C][/ROW]
[/TABLE]
Source: https://freestatistics.org/blog/index.php?pk=299235&T=2

Globally Unique Identifier (entire table): ba.freestatistics.org/blog/index.php?pk=299235&T=2

As an alternative you can also use a QR Code:  

The GUIDs for individual cells are displayed in the table below:

Interpolation Forecasts of Exponential Smoothing
tObservedFittedResiduals
21934.41737.4197
317161934.39082843182-218.39082843182
41894.61716.01016744352178.589832556483
52078.41894.59168553896183.808314461043
62116.42078.3914425863538.0085574136451
72132.82116.3982304666216.4017695333791
81874.22132.79923639621-258.599236396206
92021.41874.21203939354147.187960606458
1021092021.3931474902787.6068525097255
112101.22108.99592135929-7.79592135928533
1219132101.20036294835-188.200362948347
1319651913.0087618906651.9912381093388
141903.41964.99757948637-61.59757948637
151837.41903.40286774822-66.002867748223
1618881837.4030728416350.5969271583674
1719121887.9976444001724.0023555998332
181971.41911.9988825419259.4011174580755
192041.61971.3972345106770.2027654893336
202132.22041.5967316271690.6032683728431
212075.42132.1957818576-56.7957818575978
2221722075.4026441948596.5973558051492
232284.62171.99550279576112.604497204237
242396.42284.59475756435111.805242435652
252539.42396.3947947746143.0052052254
2626882539.3933422234148.606657776598
272964.22687.99308144115276.206918558851
283375.62964.18714085997411.412859140027
293271.43375.58084618737-104.180846187372
303714.83271.40485026261443.395149737392
313989.43714.77935721398274.620642786022
324367.23989.38721471092377.81278528908
335070.44367.18241047858703.217589521419
345651.65070.36726087275581.232739127247
356180.85651.57294002185529.227059978148
365428.66180.7753612078-752.1753612078
375346.45428.63501841426-82.235018414257
385891.85346.40382854862545.39617145138
3955275891.77460843568-364.774608435678
405191.45527.01698251366-335.616982513662
415324.65191.41562504588133.184374954125


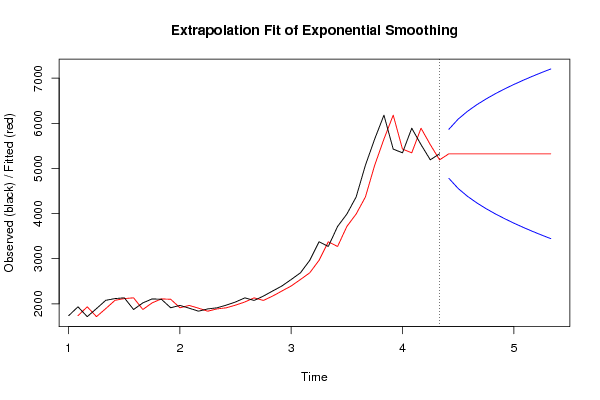
Extrapolation Forecasts of Exponential Smoothing
tForecast95% Lower Bound95% Upper Bound
425324.593799443784781.740707042135867.44689184543
435324.593799443784556.901464413856092.28613447371
445324.593799443784384.37384507286264.81375381477
455324.593799443784238.925524172256410.26207471531
465324.593799443784110.782592845036538.40500604253
475324.593799443783994.932306206356654.25529268121
485324.593799443783888.396832474396760.79076641317
495324.593799443783789.235935860926859.95166302664
505324.593799443783696.101917179896953.08568170768
515324.593799443783608.013521119157041.17407776842
525324.593799443783524.229976971577124.95762191599
535324.593799443783444.175778204777205.01182068279

\begin{tabular}{lllllllll}
\hline
Extrapolation Forecasts of Exponential Smoothing \tabularnewline
t & Forecast & 95% Lower Bound & 95% Upper Bound \tabularnewline
42 & 5324.59379944378 & 4781.74070704213 & 5867.44689184543 \tabularnewline
43 & 5324.59379944378 & 4556.90146441385 & 6092.28613447371 \tabularnewline
44 & 5324.59379944378 & 4384.3738450728 & 6264.81375381477 \tabularnewline
45 & 5324.59379944378 & 4238.92552417225 & 6410.26207471531 \tabularnewline
46 & 5324.59379944378 & 4110.78259284503 & 6538.40500604253 \tabularnewline
47 & 5324.59379944378 & 3994.93230620635 & 6654.25529268121 \tabularnewline
48 & 5324.59379944378 & 3888.39683247439 & 6760.79076641317 \tabularnewline
49 & 5324.59379944378 & 3789.23593586092 & 6859.95166302664 \tabularnewline
50 & 5324.59379944378 & 3696.10191717989 & 6953.08568170768 \tabularnewline
51 & 5324.59379944378 & 3608.01352111915 & 7041.17407776842 \tabularnewline
52 & 5324.59379944378 & 3524.22997697157 & 7124.95762191599 \tabularnewline
53 & 5324.59379944378 & 3444.17577820477 & 7205.01182068279 \tabularnewline
\hline
\end{tabular}
%Source: https://freestatistics.org/blog/index.php?pk=299235&T=3

[TABLE]
[ROW][C]Extrapolation Forecasts of Exponential Smoothing[/C][/ROW]
[ROW][C]t[/C][C]Forecast[/C][C]95% Lower Bound[/C][C]95% Upper Bound[/C][/ROW]
[ROW][C]42[/C][C]5324.59379944378[/C][C]4781.74070704213[/C][C]5867.44689184543[/C][/ROW]
[ROW][C]43[/C][C]5324.59379944378[/C][C]4556.90146441385[/C][C]6092.28613447371[/C][/ROW]
[ROW][C]44[/C][C]5324.59379944378[/C][C]4384.3738450728[/C][C]6264.81375381477[/C][/ROW]
[ROW][C]45[/C][C]5324.59379944378[/C][C]4238.92552417225[/C][C]6410.26207471531[/C][/ROW]
[ROW][C]46[/C][C]5324.59379944378[/C][C]4110.78259284503[/C][C]6538.40500604253[/C][/ROW]
[ROW][C]47[/C][C]5324.59379944378[/C][C]3994.93230620635[/C][C]6654.25529268121[/C][/ROW]
[ROW][C]48[/C][C]5324.59379944378[/C][C]3888.39683247439[/C][C]6760.79076641317[/C][/ROW]
[ROW][C]49[/C][C]5324.59379944378[/C][C]3789.23593586092[/C][C]6859.95166302664[/C][/ROW]
[ROW][C]50[/C][C]5324.59379944378[/C][C]3696.10191717989[/C][C]6953.08568170768[/C][/ROW]
[ROW][C]51[/C][C]5324.59379944378[/C][C]3608.01352111915[/C][C]7041.17407776842[/C][/ROW]
[ROW][C]52[/C][C]5324.59379944378[/C][C]3524.22997697157[/C][C]7124.95762191599[/C][/ROW]
[ROW][C]53[/C][C]5324.59379944378[/C][C]3444.17577820477[/C][C]7205.01182068279[/C][/ROW]
[/TABLE]
Source: https://freestatistics.org/blog/index.php?pk=299235&T=3

Globally Unique Identifier (entire table): ba.freestatistics.org/blog/index.php?pk=299235&T=3

As an alternative you can also use a QR Code:  

The GUIDs for individual cells are displayed in the table below:

Extrapolation Forecasts of Exponential Smoothing
tForecast95% Lower Bound95% Upper Bound
425324.593799443784781.740707042135867.44689184543
435324.593799443784556.901464413856092.28613447371
445324.593799443784384.37384507286264.81375381477
455324.593799443784238.925524172256410.26207471531
465324.593799443784110.782592845036538.40500604253
475324.593799443783994.932306206356654.25529268121
485324.593799443783888.396832474396760.79076641317
495324.593799443783789.235935860926859.95166302664
505324.593799443783696.101917179896953.08568170768
515324.593799443783608.013521119157041.17407776842
525324.593799443783524.229976971577124.95762191599
535324.593799443783444.175778204777205.01182068279


Parameters (Session):
par1 = 12 ; par2 = 12 ; par3 = BFGS ;
Parameters (R input):
par1 = 12 ; par2 = Single ; par3 = additive ; par4 = 12 ;
R code (references can be found in the software module):
par1 <- as.numeric(par1)
par4 <- as.numeric(par4)
if (par2 == 'Single') K <- 1
if (par2 == 'Double') K <- 2
if (par2 == 'Triple') K <- par1
nx <- length(x)
nxmK <- nx - K
x <- ts(x, frequency = par1)
if (par2 == 'Single') fit <- HoltWinters(x, gamma=F, beta=F)
if (par2 == 'Double') fit <- HoltWinters(x, gamma=F)
if (par2 == 'Triple') fit <- HoltWinters(x, seasonal=par3)
fit
myresid <- x - fit$fitted[,'xhat']
bitmap(file='test1.png')
op <- par(mfrow=c(2,1))
plot(fit,ylab='Observed (black) / Fitted (red)',main='Interpolation Fit of Exponential Smoothing')
plot(myresid,ylab='Residuals',main='Interpolation Prediction Errors')
par(op)
dev.off()
bitmap(file='test2.png')
p <- predict(fit, par4, prediction.interval=TRUE)
np <- length(p[,1])
plot(fit,p,ylab='Observed (black) / Fitted (red)',main='Extrapolation Fit of Exponential Smoothing')
dev.off()
bitmap(file='test3.png')
op <- par(mfrow = c(2,2))
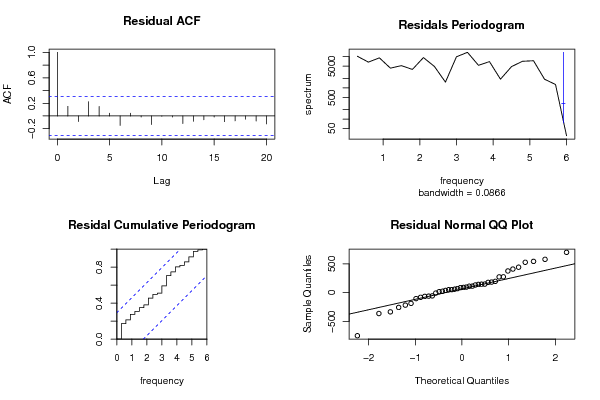
acf(as.numeric(myresid),lag.max = nx/2,main='Residual ACF')
spectrum(myresid,main='Residals Periodogram')
cpgram(myresid,main='Residal Cumulative Periodogram')
qqnorm(myresid,main='Residual Normal QQ Plot')
qqline(myresid)
par(op)
dev.off()
load(file='createtable')
a<-table.start()
a<-table.row.start(a)
a<-table.element(a,'Estimated Parameters of Exponential Smoothing',2,TRUE)
a<-table.row.end(a)
a<-table.row.start(a)
a<-table.element(a,'Parameter',header=TRUE)
a<-table.element(a,'Value',header=TRUE)
a<-table.row.end(a)
a<-table.row.start(a)
a<-table.element(a,'alpha',header=TRUE)
a<-table.element(a,fit$alpha)
a<-table.row.end(a)
a<-table.row.start(a)
a<-table.element(a,'beta',header=TRUE)
a<-table.element(a,fit$beta)
a<-table.row.end(a)
a<-table.row.start(a)
a<-table.element(a,'gamma',header=TRUE)
a<-table.element(a,fit$gamma)
a<-table.row.end(a)
a<-table.end(a)
table.save(a,file='mytable.tab')
a<-table.start()
a<-table.row.start(a)
a<-table.element(a,'Interpolation Forecasts of Exponential Smoothing',4,TRUE)
a<-table.row.end(a)
a<-table.row.start(a)
a<-table.element(a,'t',header=TRUE)
a<-table.element(a,'Observed',header=TRUE)
a<-table.element(a,'Fitted',header=TRUE)
a<-table.element(a,'Residuals',header=TRUE)
a<-table.row.end(a)
for (i in 1:nxmK) {
a<-table.row.start(a)
a<-table.element(a,i+K,header=TRUE)
a<-table.element(a,x[i+K])
a<-table.element(a,fit$fitted[i,'xhat'])
a<-table.element(a,myresid[i])
a<-table.row.end(a)
}
a<-table.end(a)
table.save(a,file='mytable1.tab')
a<-table.start()
a<-table.row.start(a)
a<-table.element(a,'Extrapolation Forecasts of Exponential Smoothing',4,TRUE)
a<-table.row.end(a)
a<-table.row.start(a)
a<-table.element(a,'t',header=TRUE)
a<-table.element(a,'Forecast',header=TRUE)
a<-table.element(a,'95% Lower Bound',header=TRUE)
a<-table.element(a,'95% Upper Bound',header=TRUE)
a<-table.row.end(a)
for (i in 1:np) {
a<-table.row.start(a)
a<-table.element(a,nx+i,header=TRUE)
a<-table.element(a,p[i,'fit'])
a<-table.element(a,p[i,'lwr'])
a<-table.element(a,p[i,'upr'])
a<-table.row.end(a)
}
a<-table.end(a)
table.save(a,file='mytable2.tab')