Free Statistics

of Irreproducible Research!

Author's title

Author*The author of this computation has been verified*
R Software Modulerwasp_structuraltimeseries.wasp
Title produced by softwareStructural Time Series Models
Date of computationTue, 13 Dec 2016 22:38:53 +0100
Cite this page as followsStatistical Computations at FreeStatistics.org, Office for Research Development and Education, URL https://freestatistics.org/blog/index.php?v=date/2016/Dec/13/t1481665172regeyhtovfueoq0.htm/, Retrieved Sat, 04 May 2024 20:44:53 +0000
Statistical Computations at FreeStatistics.org, Office for Research Development and Education, URL https://freestatistics.org/blog/index.php?pk=299243, Retrieved Sat, 04 May 2024 20:44:53 +0000
QR Codes:

Original text written by user:
IsPrivate?No (this computation is public)
User-defined keywords
Estimated Impact57
Family? (F = Feedback message, R = changed R code, M = changed R Module, P = changed Parameters, D = changed Data)
-       [Structural Time Series Models] [] [2016-12-13 21:38:53] [130d73899007e5ff8a4f636b9bcfb397] [Current]
Feedback Forum

Post a new message
Dataseries X:
4650
4800
3500
3850
9100
4400
8500
6000
2850
7450
6000
4950
6400
5550
6900
9900
6400
8000
5450
6800
6150
8600
8700
4000
8300
4950
4100
4200
6600
8050
8950
10850
3750
6800
3650
3600
3400
3400
3750
5100
3700
4850
7700
2800
5750
6200
5150
4300
4500
3450
5600


Summary of computational transaction
Raw Input view raw input (R code)
Raw Outputview raw output of R engine
Computing time3 seconds
R ServerBig Analytics Cloud Computing Center

\begin{tabular}{lllllllll}
\hline
Summary of computational transaction \tabularnewline
Raw Input view raw input (R code)  \tabularnewline
Raw Outputview raw output of R engine  \tabularnewline
Computing time3 seconds \tabularnewline
R ServerBig Analytics Cloud Computing Center \tabularnewline
\hline
\end{tabular}
%Source: https://freestatistics.org/blog/index.php?pk=299243&T=0

[TABLE]
[ROW]
Summary of computational transaction[/C][/ROW] [ROW]Raw Input[/C] view raw input (R code) [/C][/ROW] [ROW]Raw Output[/C]view raw output of R engine [/C][/ROW] [ROW]Computing time[/C]3 seconds[/C][/ROW] [ROW]R Server[/C]Big Analytics Cloud Computing Center[/C][/ROW] [/TABLE] Source: https://freestatistics.org/blog/index.php?pk=299243&T=0

Globally Unique Identifier (entire table): ba.freestatistics.org/blog/index.php?pk=299243&T=0

As an alternative you can also use a QR Code:  

The GUIDs for individual cells are displayed in the table below:

Summary of computational transaction
Raw Input view raw input (R code)
Raw Outputview raw output of R engine
Computing time3 seconds
R ServerBig Analytics Cloud Computing Center


Structural Time Series Model -- Interpolation
tObservedLevelSlopeSeasonalStand. Residuals
146504650000
248004683.286832670576.377895800683476.37789581655810.0715298762287045
335004385.31421597596-38.5473251577775-38.5473251577778-0.559551317745787
438504224.18399964908-53.3396687054258-53.3396687054259-0.213190898383006
591005516.4959608447184.307304195084784.3073041950842.32162617069331
644005256.8040833423253.719266552913953.7192665529136-0.601451277222783
785006136.17059838104118.759111451993118.7591114519931.47526778227215
860006158.36753290686111.918530383738111.918530383738-0.176706099074346
928505374.3047698009154.13672612896854.1367261289678-1.6779778606891
1074505919.0173176391683.230761252359683.23076125235950.938383736322243
1160005981.2587716076282.07627958132982.0762795813289-0.0409106173614484
1249505773.7452114269967.197425420454367.197425420454-0.5738101359717
1364005999.428664408948.2066170763798-530.2727873659850.611221751133331
1455505896.9570029761240.339541205403840.3395406327306-0.255646531530131
1569006177.1568134534451.621269022562751.62126902256210.437490751475187
1699007131.3633460101790.245670044844390.24567004484421.7312188647635
1764007001.0125656208381.572439770799781.5724397707993-0.43865779278821
1880007280.3207956400388.78128334395288.78128334395140.403762933766549
1954506902.0337226813672.860198731569872.8601987315701-0.972912351961943
2068006918.0030426593271.033605943691171.0336059436911-0.120328390414046
2161506782.1635161009464.737305541691364.7373055416908-0.442799995887134
2286007227.6189722842175.781844863464975.78184486346480.822659845939115
2387007599.3118078015984.002213690895784.00221369089560.644316803383929
2440006843.7821053095861.580770176812161.5807701768115-1.83950465008674
2583007242.7111300199145.9919286665035-505.9112141931411.00066682719413
2649506709.5367027745627.54850542079727.5485037913065-1.14781979232163
2741006109.584263390379.324087266898559.32408726689678-1.28961988612347
2842005674.80849225636-2.55759526614279-2.55759526614232-0.936818085022735
2966005883.042167075422.687488111404252.687488111403580.453240848248284
3080506369.5595536852913.982627535213113.98262753521281.05528014338215
3189506949.5844081212726.477463047673926.4774630476741.24805059838933
32108507823.1858413790344.279313321977244.27931332197721.88349519854727
3337506956.2790637570225.943539607037525.9435396070367-2.03926186098947
3468006936.8492938532325.064880796733325.0648807967331-0.102077997771857
3536506237.1816157587511.502482878157911.5024828781577-1.63733725987253
3636005672.641011906471.048884373162541.04888437316195-1.30590809829559
3734005274.6502640583312.5084382641983-137.592820012986-1.10218033497911
3834004848.834189320242.435922386397142.43592108512417-0.923203709056798
3937504601.81875942177-2.81854941238261-2.81854941238402-0.538226736105004
4051004711.16894001948-0.630535954129481-0.6305359541292390.246294075762462
4137004488.18291456869-4.68572720178414-4.68572720178489-0.494588778664419
4248504564.54328517905-3.29178810821586-3.291788108215720.182029514282213
4377005242.937204140397.850470872396847.850470872396581.54242392478195
4428004719.98824945642-0.449684482237893-0.449684482238085-1.20789835175841
4557504941.24784177722.88593209237332.885932092372790.506788497766213
4662005212.779152955046.793387628832176.793387628831660.616260757661598
4751505203.23947164266.562792434296956.56279243429682-0.0375745069628739
4843005014.202697622583.873312929248813.87331292924842-0.451028649248609
4945004930.930834020435.68850765094509-62.5735829290257-0.232691562145752
5034504601.70421205114-0.333265865392359-0.333267424179994-0.728822051458114
5156004822.105720459663.315069679374193.3150696793730.489093770865151

\begin{tabular}{lllllllll}
\hline
Structural Time Series Model -- Interpolation \tabularnewline
t & Observed & Level & Slope & Seasonal & Stand. Residuals \tabularnewline
1 & 4650 & 4650 & 0 & 0 & 0 \tabularnewline
2 & 4800 & 4683.28683267057 & 6.37789580068347 & 6.3778958165581 & 0.0715298762287045 \tabularnewline
3 & 3500 & 4385.31421597596 & -38.5473251577775 & -38.5473251577778 & -0.559551317745787 \tabularnewline
4 & 3850 & 4224.18399964908 & -53.3396687054258 & -53.3396687054259 & -0.213190898383006 \tabularnewline
5 & 9100 & 5516.49596084471 & 84.3073041950847 & 84.307304195084 & 2.32162617069331 \tabularnewline
6 & 4400 & 5256.80408334232 & 53.7192665529139 & 53.7192665529136 & -0.601451277222783 \tabularnewline
7 & 8500 & 6136.17059838104 & 118.759111451993 & 118.759111451993 & 1.47526778227215 \tabularnewline
8 & 6000 & 6158.36753290686 & 111.918530383738 & 111.918530383738 & -0.176706099074346 \tabularnewline
9 & 2850 & 5374.30476980091 & 54.136726128968 & 54.1367261289678 & -1.6779778606891 \tabularnewline
10 & 7450 & 5919.01731763916 & 83.2307612523596 & 83.2307612523595 & 0.938383736322243 \tabularnewline
11 & 6000 & 5981.25877160762 & 82.076279581329 & 82.0762795813289 & -0.0409106173614484 \tabularnewline
12 & 4950 & 5773.74521142699 & 67.1974254204543 & 67.197425420454 & -0.5738101359717 \tabularnewline
13 & 6400 & 5999.4286644089 & 48.2066170763798 & -530.272787365985 & 0.611221751133331 \tabularnewline
14 & 5550 & 5896.95700297612 & 40.3395412054038 & 40.3395406327306 & -0.255646531530131 \tabularnewline
15 & 6900 & 6177.15681345344 & 51.6212690225627 & 51.6212690225621 & 0.437490751475187 \tabularnewline
16 & 9900 & 7131.36334601017 & 90.2456700448443 & 90.2456700448442 & 1.7312188647635 \tabularnewline
17 & 6400 & 7001.01256562083 & 81.5724397707997 & 81.5724397707993 & -0.43865779278821 \tabularnewline
18 & 8000 & 7280.32079564003 & 88.781283343952 & 88.7812833439514 & 0.403762933766549 \tabularnewline
19 & 5450 & 6902.03372268136 & 72.8601987315698 & 72.8601987315701 & -0.972912351961943 \tabularnewline
20 & 6800 & 6918.00304265932 & 71.0336059436911 & 71.0336059436911 & -0.120328390414046 \tabularnewline
21 & 6150 & 6782.16351610094 & 64.7373055416913 & 64.7373055416908 & -0.442799995887134 \tabularnewline
22 & 8600 & 7227.61897228421 & 75.7818448634649 & 75.7818448634648 & 0.822659845939115 \tabularnewline
23 & 8700 & 7599.31180780159 & 84.0022136908957 & 84.0022136908956 & 0.644316803383929 \tabularnewline
24 & 4000 & 6843.78210530958 & 61.5807701768121 & 61.5807701768115 & -1.83950465008674 \tabularnewline
25 & 8300 & 7242.71113001991 & 45.9919286665035 & -505.911214193141 & 1.00066682719413 \tabularnewline
26 & 4950 & 6709.53670277456 & 27.548505420797 & 27.5485037913065 & -1.14781979232163 \tabularnewline
27 & 4100 & 6109.58426339037 & 9.32408726689855 & 9.32408726689678 & -1.28961988612347 \tabularnewline
28 & 4200 & 5674.80849225636 & -2.55759526614279 & -2.55759526614232 & -0.936818085022735 \tabularnewline
29 & 6600 & 5883.04216707542 & 2.68748811140425 & 2.68748811140358 & 0.453240848248284 \tabularnewline
30 & 8050 & 6369.55955368529 & 13.9826275352131 & 13.9826275352128 & 1.05528014338215 \tabularnewline
31 & 8950 & 6949.58440812127 & 26.4774630476739 & 26.477463047674 & 1.24805059838933 \tabularnewline
32 & 10850 & 7823.18584137903 & 44.2793133219772 & 44.2793133219772 & 1.88349519854727 \tabularnewline
33 & 3750 & 6956.27906375702 & 25.9435396070375 & 25.9435396070367 & -2.03926186098947 \tabularnewline
34 & 6800 & 6936.84929385323 & 25.0648807967333 & 25.0648807967331 & -0.102077997771857 \tabularnewline
35 & 3650 & 6237.18161575875 & 11.5024828781579 & 11.5024828781577 & -1.63733725987253 \tabularnewline
36 & 3600 & 5672.64101190647 & 1.04888437316254 & 1.04888437316195 & -1.30590809829559 \tabularnewline
37 & 3400 & 5274.65026405833 & 12.5084382641983 & -137.592820012986 & -1.10218033497911 \tabularnewline
38 & 3400 & 4848.83418932024 & 2.43592238639714 & 2.43592108512417 & -0.923203709056798 \tabularnewline
39 & 3750 & 4601.81875942177 & -2.81854941238261 & -2.81854941238402 & -0.538226736105004 \tabularnewline
40 & 5100 & 4711.16894001948 & -0.630535954129481 & -0.630535954129239 & 0.246294075762462 \tabularnewline
41 & 3700 & 4488.18291456869 & -4.68572720178414 & -4.68572720178489 & -0.494588778664419 \tabularnewline
42 & 4850 & 4564.54328517905 & -3.29178810821586 & -3.29178810821572 & 0.182029514282213 \tabularnewline
43 & 7700 & 5242.93720414039 & 7.85047087239684 & 7.85047087239658 & 1.54242392478195 \tabularnewline
44 & 2800 & 4719.98824945642 & -0.449684482237893 & -0.449684482238085 & -1.20789835175841 \tabularnewline
45 & 5750 & 4941.2478417772 & 2.8859320923733 & 2.88593209237279 & 0.506788497766213 \tabularnewline
46 & 6200 & 5212.77915295504 & 6.79338762883217 & 6.79338762883166 & 0.616260757661598 \tabularnewline
47 & 5150 & 5203.2394716426 & 6.56279243429695 & 6.56279243429682 & -0.0375745069628739 \tabularnewline
48 & 4300 & 5014.20269762258 & 3.87331292924881 & 3.87331292924842 & -0.451028649248609 \tabularnewline
49 & 4500 & 4930.93083402043 & 5.68850765094509 & -62.5735829290257 & -0.232691562145752 \tabularnewline
50 & 3450 & 4601.70421205114 & -0.333265865392359 & -0.333267424179994 & -0.728822051458114 \tabularnewline
51 & 5600 & 4822.10572045966 & 3.31506967937419 & 3.315069679373 & 0.489093770865151 \tabularnewline
\hline
\end{tabular}
%Source: https://freestatistics.org/blog/index.php?pk=299243&T=1

[TABLE]
[ROW][C]Structural Time Series Model -- Interpolation[/C][/ROW]
[ROW][C]t[/C][C]Observed[/C][C]Level[/C][C]Slope[/C][C]Seasonal[/C][C]Stand. Residuals[/C][/ROW]
[ROW][C]1[/C][C]4650[/C][C]4650[/C][C]0[/C][C]0[/C][C]0[/C][/ROW]
[ROW][C]2[/C][C]4800[/C][C]4683.28683267057[/C][C]6.37789580068347[/C][C]6.3778958165581[/C][C]0.0715298762287045[/C][/ROW]
[ROW][C]3[/C][C]3500[/C][C]4385.31421597596[/C][C]-38.5473251577775[/C][C]-38.5473251577778[/C][C]-0.559551317745787[/C][/ROW]
[ROW][C]4[/C][C]3850[/C][C]4224.18399964908[/C][C]-53.3396687054258[/C][C]-53.3396687054259[/C][C]-0.213190898383006[/C][/ROW]
[ROW][C]5[/C][C]9100[/C][C]5516.49596084471[/C][C]84.3073041950847[/C][C]84.307304195084[/C][C]2.32162617069331[/C][/ROW]
[ROW][C]6[/C][C]4400[/C][C]5256.80408334232[/C][C]53.7192665529139[/C][C]53.7192665529136[/C][C]-0.601451277222783[/C][/ROW]
[ROW][C]7[/C][C]8500[/C][C]6136.17059838104[/C][C]118.759111451993[/C][C]118.759111451993[/C][C]1.47526778227215[/C][/ROW]
[ROW][C]8[/C][C]6000[/C][C]6158.36753290686[/C][C]111.918530383738[/C][C]111.918530383738[/C][C]-0.176706099074346[/C][/ROW]
[ROW][C]9[/C][C]2850[/C][C]5374.30476980091[/C][C]54.136726128968[/C][C]54.1367261289678[/C][C]-1.6779778606891[/C][/ROW]
[ROW][C]10[/C][C]7450[/C][C]5919.01731763916[/C][C]83.2307612523596[/C][C]83.2307612523595[/C][C]0.938383736322243[/C][/ROW]
[ROW][C]11[/C][C]6000[/C][C]5981.25877160762[/C][C]82.076279581329[/C][C]82.0762795813289[/C][C]-0.0409106173614484[/C][/ROW]
[ROW][C]12[/C][C]4950[/C][C]5773.74521142699[/C][C]67.1974254204543[/C][C]67.197425420454[/C][C]-0.5738101359717[/C][/ROW]
[ROW][C]13[/C][C]6400[/C][C]5999.4286644089[/C][C]48.2066170763798[/C][C]-530.272787365985[/C][C]0.611221751133331[/C][/ROW]
[ROW][C]14[/C][C]5550[/C][C]5896.95700297612[/C][C]40.3395412054038[/C][C]40.3395406327306[/C][C]-0.255646531530131[/C][/ROW]
[ROW][C]15[/C][C]6900[/C][C]6177.15681345344[/C][C]51.6212690225627[/C][C]51.6212690225621[/C][C]0.437490751475187[/C][/ROW]
[ROW][C]16[/C][C]9900[/C][C]7131.36334601017[/C][C]90.2456700448443[/C][C]90.2456700448442[/C][C]1.7312188647635[/C][/ROW]
[ROW][C]17[/C][C]6400[/C][C]7001.01256562083[/C][C]81.5724397707997[/C][C]81.5724397707993[/C][C]-0.43865779278821[/C][/ROW]
[ROW][C]18[/C][C]8000[/C][C]7280.32079564003[/C][C]88.781283343952[/C][C]88.7812833439514[/C][C]0.403762933766549[/C][/ROW]
[ROW][C]19[/C][C]5450[/C][C]6902.03372268136[/C][C]72.8601987315698[/C][C]72.8601987315701[/C][C]-0.972912351961943[/C][/ROW]
[ROW][C]20[/C][C]6800[/C][C]6918.00304265932[/C][C]71.0336059436911[/C][C]71.0336059436911[/C][C]-0.120328390414046[/C][/ROW]
[ROW][C]21[/C][C]6150[/C][C]6782.16351610094[/C][C]64.7373055416913[/C][C]64.7373055416908[/C][C]-0.442799995887134[/C][/ROW]
[ROW][C]22[/C][C]8600[/C][C]7227.61897228421[/C][C]75.7818448634649[/C][C]75.7818448634648[/C][C]0.822659845939115[/C][/ROW]
[ROW][C]23[/C][C]8700[/C][C]7599.31180780159[/C][C]84.0022136908957[/C][C]84.0022136908956[/C][C]0.644316803383929[/C][/ROW]
[ROW][C]24[/C][C]4000[/C][C]6843.78210530958[/C][C]61.5807701768121[/C][C]61.5807701768115[/C][C]-1.83950465008674[/C][/ROW]
[ROW][C]25[/C][C]8300[/C][C]7242.71113001991[/C][C]45.9919286665035[/C][C]-505.911214193141[/C][C]1.00066682719413[/C][/ROW]
[ROW][C]26[/C][C]4950[/C][C]6709.53670277456[/C][C]27.548505420797[/C][C]27.5485037913065[/C][C]-1.14781979232163[/C][/ROW]
[ROW][C]27[/C][C]4100[/C][C]6109.58426339037[/C][C]9.32408726689855[/C][C]9.32408726689678[/C][C]-1.28961988612347[/C][/ROW]
[ROW][C]28[/C][C]4200[/C][C]5674.80849225636[/C][C]-2.55759526614279[/C][C]-2.55759526614232[/C][C]-0.936818085022735[/C][/ROW]
[ROW][C]29[/C][C]6600[/C][C]5883.04216707542[/C][C]2.68748811140425[/C][C]2.68748811140358[/C][C]0.453240848248284[/C][/ROW]
[ROW][C]30[/C][C]8050[/C][C]6369.55955368529[/C][C]13.9826275352131[/C][C]13.9826275352128[/C][C]1.05528014338215[/C][/ROW]
[ROW][C]31[/C][C]8950[/C][C]6949.58440812127[/C][C]26.4774630476739[/C][C]26.477463047674[/C][C]1.24805059838933[/C][/ROW]
[ROW][C]32[/C][C]10850[/C][C]7823.18584137903[/C][C]44.2793133219772[/C][C]44.2793133219772[/C][C]1.88349519854727[/C][/ROW]
[ROW][C]33[/C][C]3750[/C][C]6956.27906375702[/C][C]25.9435396070375[/C][C]25.9435396070367[/C][C]-2.03926186098947[/C][/ROW]
[ROW][C]34[/C][C]6800[/C][C]6936.84929385323[/C][C]25.0648807967333[/C][C]25.0648807967331[/C][C]-0.102077997771857[/C][/ROW]
[ROW][C]35[/C][C]3650[/C][C]6237.18161575875[/C][C]11.5024828781579[/C][C]11.5024828781577[/C][C]-1.63733725987253[/C][/ROW]
[ROW][C]36[/C][C]3600[/C][C]5672.64101190647[/C][C]1.04888437316254[/C][C]1.04888437316195[/C][C]-1.30590809829559[/C][/ROW]
[ROW][C]37[/C][C]3400[/C][C]5274.65026405833[/C][C]12.5084382641983[/C][C]-137.592820012986[/C][C]-1.10218033497911[/C][/ROW]
[ROW][C]38[/C][C]3400[/C][C]4848.83418932024[/C][C]2.43592238639714[/C][C]2.43592108512417[/C][C]-0.923203709056798[/C][/ROW]
[ROW][C]39[/C][C]3750[/C][C]4601.81875942177[/C][C]-2.81854941238261[/C][C]-2.81854941238402[/C][C]-0.538226736105004[/C][/ROW]
[ROW][C]40[/C][C]5100[/C][C]4711.16894001948[/C][C]-0.630535954129481[/C][C]-0.630535954129239[/C][C]0.246294075762462[/C][/ROW]
[ROW][C]41[/C][C]3700[/C][C]4488.18291456869[/C][C]-4.68572720178414[/C][C]-4.68572720178489[/C][C]-0.494588778664419[/C][/ROW]
[ROW][C]42[/C][C]4850[/C][C]4564.54328517905[/C][C]-3.29178810821586[/C][C]-3.29178810821572[/C][C]0.182029514282213[/C][/ROW]
[ROW][C]43[/C][C]7700[/C][C]5242.93720414039[/C][C]7.85047087239684[/C][C]7.85047087239658[/C][C]1.54242392478195[/C][/ROW]
[ROW][C]44[/C][C]2800[/C][C]4719.98824945642[/C][C]-0.449684482237893[/C][C]-0.449684482238085[/C][C]-1.20789835175841[/C][/ROW]
[ROW][C]45[/C][C]5750[/C][C]4941.2478417772[/C][C]2.8859320923733[/C][C]2.88593209237279[/C][C]0.506788497766213[/C][/ROW]
[ROW][C]46[/C][C]6200[/C][C]5212.77915295504[/C][C]6.79338762883217[/C][C]6.79338762883166[/C][C]0.616260757661598[/C][/ROW]
[ROW][C]47[/C][C]5150[/C][C]5203.2394716426[/C][C]6.56279243429695[/C][C]6.56279243429682[/C][C]-0.0375745069628739[/C][/ROW]
[ROW][C]48[/C][C]4300[/C][C]5014.20269762258[/C][C]3.87331292924881[/C][C]3.87331292924842[/C][C]-0.451028649248609[/C][/ROW]
[ROW][C]49[/C][C]4500[/C][C]4930.93083402043[/C][C]5.68850765094509[/C][C]-62.5735829290257[/C][C]-0.232691562145752[/C][/ROW]
[ROW][C]50[/C][C]3450[/C][C]4601.70421205114[/C][C]-0.333265865392359[/C][C]-0.333267424179994[/C][C]-0.728822051458114[/C][/ROW]
[ROW][C]51[/C][C]5600[/C][C]4822.10572045966[/C][C]3.31506967937419[/C][C]3.315069679373[/C][C]0.489093770865151[/C][/ROW]
[/TABLE]
Source: https://freestatistics.org/blog/index.php?pk=299243&T=1

Globally Unique Identifier (entire table): ba.freestatistics.org/blog/index.php?pk=299243&T=1

As an alternative you can also use a QR Code:  

The GUIDs for individual cells are displayed in the table below:

Structural Time Series Model -- Interpolation
tObservedLevelSlopeSeasonalStand. Residuals
146504650000
248004683.286832670576.377895800683476.37789581655810.0715298762287045
335004385.31421597596-38.5473251577775-38.5473251577778-0.559551317745787
438504224.18399964908-53.3396687054258-53.3396687054259-0.213190898383006
591005516.4959608447184.307304195084784.3073041950842.32162617069331
644005256.8040833423253.719266552913953.7192665529136-0.601451277222783
785006136.17059838104118.759111451993118.7591114519931.47526778227215
860006158.36753290686111.918530383738111.918530383738-0.176706099074346
928505374.3047698009154.13672612896854.1367261289678-1.6779778606891
1074505919.0173176391683.230761252359683.23076125235950.938383736322243
1160005981.2587716076282.07627958132982.0762795813289-0.0409106173614484
1249505773.7452114269967.197425420454367.197425420454-0.5738101359717
1364005999.428664408948.2066170763798-530.2727873659850.611221751133331
1455505896.9570029761240.339541205403840.3395406327306-0.255646531530131
1569006177.1568134534451.621269022562751.62126902256210.437490751475187
1699007131.3633460101790.245670044844390.24567004484421.7312188647635
1764007001.0125656208381.572439770799781.5724397707993-0.43865779278821
1880007280.3207956400388.78128334395288.78128334395140.403762933766549
1954506902.0337226813672.860198731569872.8601987315701-0.972912351961943
2068006918.0030426593271.033605943691171.0336059436911-0.120328390414046
2161506782.1635161009464.737305541691364.7373055416908-0.442799995887134
2286007227.6189722842175.781844863464975.78184486346480.822659845939115
2387007599.3118078015984.002213690895784.00221369089560.644316803383929
2440006843.7821053095861.580770176812161.5807701768115-1.83950465008674
2583007242.7111300199145.9919286665035-505.9112141931411.00066682719413
2649506709.5367027745627.54850542079727.5485037913065-1.14781979232163
2741006109.584263390379.324087266898559.32408726689678-1.28961988612347
2842005674.80849225636-2.55759526614279-2.55759526614232-0.936818085022735
2966005883.042167075422.687488111404252.687488111403580.453240848248284
3080506369.5595536852913.982627535213113.98262753521281.05528014338215
3189506949.5844081212726.477463047673926.4774630476741.24805059838933
32108507823.1858413790344.279313321977244.27931332197721.88349519854727
3337506956.2790637570225.943539607037525.9435396070367-2.03926186098947
3468006936.8492938532325.064880796733325.0648807967331-0.102077997771857
3536506237.1816157587511.502482878157911.5024828781577-1.63733725987253
3636005672.641011906471.048884373162541.04888437316195-1.30590809829559
3734005274.6502640583312.5084382641983-137.592820012986-1.10218033497911
3834004848.834189320242.435922386397142.43592108512417-0.923203709056798
3937504601.81875942177-2.81854941238261-2.81854941238402-0.538226736105004
4051004711.16894001948-0.630535954129481-0.6305359541292390.246294075762462
4137004488.18291456869-4.68572720178414-4.68572720178489-0.494588778664419
4248504564.54328517905-3.29178810821586-3.291788108215720.182029514282213
4377005242.937204140397.850470872396847.850470872396581.54242392478195
4428004719.98824945642-0.449684482237893-0.449684482238085-1.20789835175841
4557504941.24784177722.88593209237332.885932092372790.506788497766213
4662005212.779152955046.793387628832176.793387628831660.616260757661598
4751505203.23947164266.562792434296956.56279243429682-0.0375745069628739
4843005014.202697622583.873312929248813.87331292924842-0.451028649248609
4945004930.930834020435.68850765094509-62.5735829290257-0.232691562145752
5034504601.70421205114-0.333265865392359-0.333267424179994-0.728822051458114
5156004822.105720459663.315069679374193.3150696793730.489093770865151


Structural Time Series Model -- Extrapolation
tObservedLevelSeasonal
15936.825066541235805.34468893617131.480377605059
25580.37185794745972.01110272711-391.639244779704
36811.241407464146138.67751651804672.563890946097
49356.926372701076305.343930308983051.58244239209
55655.723644955896472.01034409991-816.286699144023
66932.773911988256638.67675789085294.0971540974
77785.866901673356805.34317168179980.523729991567
86711.367995852826972.00958547272-260.641589619904
96112.349217933737138.67599926366-1026.32678132993
106619.408852741467305.3424130546-685.933560313138
115719.821210490437472.00882684553-1752.1876163551
127441.443137146057638.67524063647-197.232103490416

\begin{tabular}{lllllllll}
\hline
Structural Time Series Model -- Extrapolation \tabularnewline
t & Observed & Level & Seasonal \tabularnewline
1 & 5936.82506654123 & 5805.34468893617 & 131.480377605059 \tabularnewline
2 & 5580.3718579474 & 5972.01110272711 & -391.639244779704 \tabularnewline
3 & 6811.24140746414 & 6138.67751651804 & 672.563890946097 \tabularnewline
4 & 9356.92637270107 & 6305.34393030898 & 3051.58244239209 \tabularnewline
5 & 5655.72364495589 & 6472.01034409991 & -816.286699144023 \tabularnewline
6 & 6932.77391198825 & 6638.67675789085 & 294.0971540974 \tabularnewline
7 & 7785.86690167335 & 6805.34317168179 & 980.523729991567 \tabularnewline
8 & 6711.36799585282 & 6972.00958547272 & -260.641589619904 \tabularnewline
9 & 6112.34921793373 & 7138.67599926366 & -1026.32678132993 \tabularnewline
10 & 6619.40885274146 & 7305.3424130546 & -685.933560313138 \tabularnewline
11 & 5719.82121049043 & 7472.00882684553 & -1752.1876163551 \tabularnewline
12 & 7441.44313714605 & 7638.67524063647 & -197.232103490416 \tabularnewline
\hline
\end{tabular}
%Source: https://freestatistics.org/blog/index.php?pk=299243&T=2

[TABLE]
[ROW][C]Structural Time Series Model -- Extrapolation[/C][/ROW]
[ROW][C]t[/C][C]Observed[/C][C]Level[/C][C]Seasonal[/C][/ROW]
[ROW][C]1[/C][C]5936.82506654123[/C][C]5805.34468893617[/C][C]131.480377605059[/C][/ROW]
[ROW][C]2[/C][C]5580.3718579474[/C][C]5972.01110272711[/C][C]-391.639244779704[/C][/ROW]
[ROW][C]3[/C][C]6811.24140746414[/C][C]6138.67751651804[/C][C]672.563890946097[/C][/ROW]
[ROW][C]4[/C][C]9356.92637270107[/C][C]6305.34393030898[/C][C]3051.58244239209[/C][/ROW]
[ROW][C]5[/C][C]5655.72364495589[/C][C]6472.01034409991[/C][C]-816.286699144023[/C][/ROW]
[ROW][C]6[/C][C]6932.77391198825[/C][C]6638.67675789085[/C][C]294.0971540974[/C][/ROW]
[ROW][C]7[/C][C]7785.86690167335[/C][C]6805.34317168179[/C][C]980.523729991567[/C][/ROW]
[ROW][C]8[/C][C]6711.36799585282[/C][C]6972.00958547272[/C][C]-260.641589619904[/C][/ROW]
[ROW][C]9[/C][C]6112.34921793373[/C][C]7138.67599926366[/C][C]-1026.32678132993[/C][/ROW]
[ROW][C]10[/C][C]6619.40885274146[/C][C]7305.3424130546[/C][C]-685.933560313138[/C][/ROW]
[ROW][C]11[/C][C]5719.82121049043[/C][C]7472.00882684553[/C][C]-1752.1876163551[/C][/ROW]
[ROW][C]12[/C][C]7441.44313714605[/C][C]7638.67524063647[/C][C]-197.232103490416[/C][/ROW]
[/TABLE]
Source: https://freestatistics.org/blog/index.php?pk=299243&T=2

Globally Unique Identifier (entire table): ba.freestatistics.org/blog/index.php?pk=299243&T=2

As an alternative you can also use a QR Code:  

The GUIDs for individual cells are displayed in the table below:

Structural Time Series Model -- Extrapolation
tObservedLevelSeasonal
15936.825066541235805.34468893617131.480377605059
25580.37185794745972.01110272711-391.639244779704
36811.241407464146138.67751651804672.563890946097
49356.926372701076305.343930308983051.58244239209
55655.723644955896472.01034409991-816.286699144023
66932.773911988256638.67675789085294.0971540974
77785.866901673356805.34317168179980.523729991567
86711.367995852826972.00958547272-260.641589619904
96112.349217933737138.67599926366-1026.32678132993
106619.408852741467305.3424130546-685.933560313138
115719.821210490437472.00882684553-1752.1876163551
127441.443137146057638.67524063647-197.232103490416


Parameters (Session):
par1 = 12 ; par2 = 12 ; par3 = BFGS ;
Parameters (R input):
par1 = 12 ; par2 = 12 ; par3 = BFGS ;
R code (references can be found in the software module):
require('stsm')
require('stsm.class')
require('KFKSDS')
par1 <- as.numeric(par1)
par2 <- as.numeric(par2)
nx <- length(x)
x <- ts(x,frequency=par1)
m <- StructTS(x,type='BSM')
print(m$coef)
print(m$fitted)
print(m$resid)
mylevel <- as.numeric(m$fitted[,'level'])
myslope <- as.numeric(m$fitted[,'slope'])
myseas <- as.numeric(m$fitted[,'sea'])
myresid <- as.numeric(m$resid)
myfit <- mylevel+myseas
mm <- stsm.model(model = 'BSM', y = x, transPars = 'StructTS')
fit2 <- stsmFit(mm, stsm.method = 'maxlik.td.optim', method = par3, KF.args = list(P0cov = TRUE))
(fit2.comps <- tsSmooth(fit2, P0cov = FALSE)$states)
m2 <- set.pars(mm, pmax(fit2$par, .Machine$double.eps))
(ss <- char2numeric(m2))
(pred <- predict(ss, x, n.ahead = par2))
mylagmax <- nx/2
bitmap(file='test2.png')
op <- par(mfrow = c(2,2))
acf(as.numeric(x),lag.max = mylagmax,main='Observed')
acf(mylevel,na.action=na.pass,lag.max = mylagmax,main='Level')
acf(myseas,na.action=na.pass,lag.max = mylagmax,main='Seasonal')
acf(myresid,na.action=na.pass,lag.max = mylagmax,main='Standardized Residals')
par(op)
dev.off()
bitmap(file='test3.png')
op <- par(mfrow = c(2,2))
spectrum(as.numeric(x),main='Observed')
spectrum(mylevel,main='Level')
spectrum(myseas,main='Seasonal')
spectrum(myresid,main='Standardized Residals')
par(op)
dev.off()
bitmap(file='test4.png')
op <- par(mfrow = c(2,2))
cpgram(as.numeric(x),main='Observed')
cpgram(mylevel,main='Level')
cpgram(myseas,main='Seasonal')
cpgram(myresid,main='Standardized Residals')
par(op)
dev.off()
bitmap(file='test1.png')
plot(as.numeric(m$resid),main='Standardized Residuals',ylab='Residuals',xlab='time',type='b')
grid()
dev.off()
bitmap(file='test5.png')
op <- par(mfrow = c(2,2))
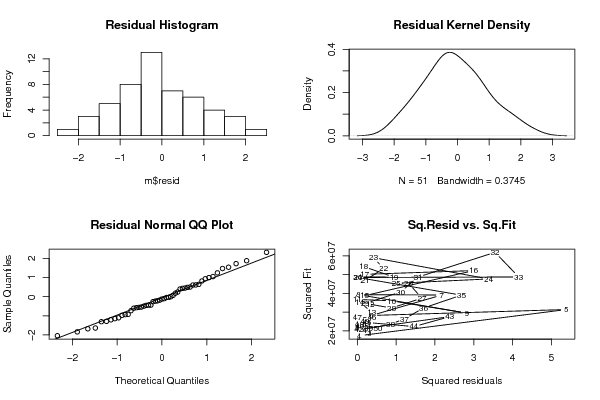
hist(m$resid,main='Residual Histogram')
plot(density(m$resid),main='Residual Kernel Density')
qqnorm(m$resid,main='Residual Normal QQ Plot')
qqline(m$resid)
plot(m$resid^2, myfit^2,main='Sq.Resid vs. Sq.Fit',xlab='Squared residuals',ylab='Squared Fit')
par(op)
dev.off()
bitmap(file='test6.png')
par(mfrow = c(3,1), mar = c(3,3,3,3))
plot(cbind(x, pred$pred), type = 'n', plot.type = 'single', ylab = '')
lines(x)
polygon(c(time(pred$pred), rev(time(pred$pred))), c(pred$pred + 2 * pred$se, rev(pred$pred)), col = 'gray85', border = NA)
polygon(c(time(pred$pred), rev(time(pred$pred))), c(pred$pred - 2 * pred$se, rev(pred$pred)), col = ' gray85', border = NA)
lines(pred$pred, col = 'blue', lwd = 1.5)
mtext(text = 'forecasts of the observed series', side = 3, adj = 0)
plot(cbind(x, pred$a[,1]), type = 'n', plot.type = 'single', ylab = '')
lines(x)
polygon(c(time(pred$a[,1]), rev(time(pred$a[,1]))), c(pred$a[,1] + 2 * sqrt(pred$P[,1]), rev(pred$a[,1])), col = 'gray85', border = NA)
polygon(c(time(pred$a[,1]), rev(time(pred$a[,1]))), c(pred$a[,1] - 2 * sqrt(pred$P[,1]), rev(pred$a[,1])), col = ' gray85', border = NA)
lines(pred$a[,1], col = 'blue', lwd = 1.5)
mtext(text = 'forecasts of the level component', side = 3, adj = 0)
plot(cbind(fit2.comps[,3], pred$a[,3]), type = 'n', plot.type = 'single', ylab = '')
lines(fit2.comps[,3])
polygon(c(time(pred$a[,3]), rev(time(pred$a[,3]))), c(pred$a[,3] + 2 * sqrt(pred$P[,3]), rev(pred$a[,3])), col = 'gray85', border = NA)
polygon(c(time(pred$a[,3]), rev(time(pred$a[,3]))), c(pred$a[,3] - 2 * sqrt(pred$P[,3]), rev(pred$a[,3])), col = ' gray85', border = NA)
lines(pred$a[,3], col = 'blue', lwd = 1.5)
mtext(text = 'forecasts of the seasonal component', side = 3, adj = 0)
dev.off()
load(file='createtable')
a<-table.start()
a<-table.row.start(a)
a<-table.element(a,'Structural Time Series Model -- Interpolation',6,TRUE)
a<-table.row.end(a)
a<-table.row.start(a)
a<-table.element(a,'t',header=TRUE)
a<-table.element(a,'Observed',header=TRUE)
a<-table.element(a,'Level',header=TRUE)
a<-table.element(a,'Slope',header=TRUE)
a<-table.element(a,'Seasonal',header=TRUE)
a<-table.element(a,'Stand. Residuals',header=TRUE)
a<-table.row.end(a)
for (i in 1:nx) {
a<-table.row.start(a)
a<-table.element(a,i,header=TRUE)
a<-table.element(a,x[i])
a<-table.element(a,mylevel[i])
a<-table.element(a,myslope[i])
a<-table.element(a,myseas[i])
a<-table.element(a,myresid[i])
a<-table.row.end(a)
}
a<-table.end(a)
table.save(a,file='mytable.tab')
a<-table.start()
a<-table.row.start(a)
a<-table.element(a,'Structural Time Series Model -- Extrapolation',4,TRUE)
a<-table.row.end(a)
a<-table.row.start(a)
a<-table.element(a,'t',header=TRUE)
a<-table.element(a,'Observed',header=TRUE)
a<-table.element(a,'Level',header=TRUE)
a<-table.element(a,'Seasonal',header=TRUE)
a<-table.row.end(a)
for (i in 1:par2) {
a<-table.row.start(a)
a<-table.element(a,i,header=TRUE)
a<-table.element(a,pred$pred[i])
a<-table.element(a,pred$a[i,1])
a<-table.element(a,pred$a[i,3])
a<-table.row.end(a)
}
a<-table.end(a)
table.save(a,file='mytable1.tab')