Free Statistics

of Irreproducible Research!

Author's title

Author*The author of this computation has been verified*
R Software Modulerwasp_univariatedataseries.wasp
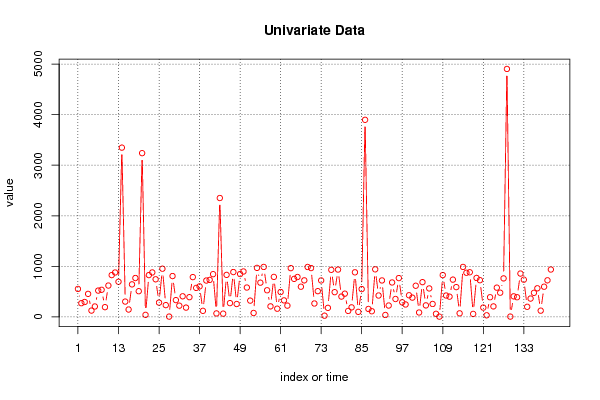
Title produced by softwareUnivariate Data Series
Date of computationWed, 14 Dec 2016 12:37:50 +0100
Cite this page as followsStatistical Computations at FreeStatistics.org, Office for Research Development and Education, URL https://freestatistics.org/blog/index.php?v=date/2016/Dec/14/t1481715485q9qrv36pp3uiaar.htm/, Retrieved Fri, 03 May 2024 21:50:28 +0000
Statistical Computations at FreeStatistics.org, Office for Research Development and Education, URL https://freestatistics.org/blog/index.php?pk=299311, Retrieved Fri, 03 May 2024 21:50:28 +0000
QR Codes:

Original text written by user:
IsPrivate?No (this computation is public)
User-defined keywords
Estimated Impact102
Family? (F = Feedback message, R = changed R code, M = changed R Module, P = changed Parameters, D = changed Data)
-       [Univariate Data Series] [] [2016-12-14 11:37:50] [349958aef20b862f8399a5ba04d6f6e3] [Current]
Feedback Forum

Post a new message
Dataseries X:
554
272
296
456
126
207
521
537
194
621
828
879
696
3348
304
147
645
770
509
3239
42
828
880
745
284
954
234
7
809
333
223
409
185
391
788
574
605
121
720
733
846
70
2352
65
832
274
888
256
849
899
582
323
79
970
678
989
528
210
792
163
493
328
224
965
753
790
598
724
988
967
266
510
722
25
180
932
490
937
403
460
119
190
883
101
551
3898
158
113
942
424
722
39
226
682
355
769
290
247
429
382
617
88
688
229
564
257
62
6
828
424
401
738
590
72
989
874
884
60
771
727
185
33
390
209
579
479
763
4904
7
408
390
858
737
201
364
477
567
124
598
725
938


Summary of computational transaction
Raw Input view raw input (R code)
Raw Outputview raw output of R engine
Computing time0 seconds
R ServerBig Analytics Cloud Computing Center

\begin{tabular}{lllllllll}
\hline
Summary of computational transaction \tabularnewline
Raw Input view raw input (R code)  \tabularnewline
Raw Outputview raw output of R engine  \tabularnewline
Computing time0 seconds \tabularnewline
R ServerBig Analytics Cloud Computing Center \tabularnewline
\hline
\end{tabular}
%Source: https://freestatistics.org/blog/index.php?pk=299311&T=0

[TABLE]
[ROW]
Summary of computational transaction[/C][/ROW] [ROW]Raw Input[/C] view raw input (R code) [/C][/ROW] [ROW]Raw Output[/C]view raw output of R engine [/C][/ROW] [ROW]Computing time[/C]0 seconds[/C][/ROW] [ROW]R Server[/C]Big Analytics Cloud Computing Center[/C][/ROW] [/TABLE] Source: https://freestatistics.org/blog/index.php?pk=299311&T=0

Globally Unique Identifier (entire table): ba.freestatistics.org/blog/index.php?pk=299311&T=0

As an alternative you can also use a QR Code:  

The GUIDs for individual cells are displayed in the table below:

Summary of computational transaction
Raw Input view raw input (R code)
Raw Outputview raw output of R engine
Computing time0 seconds
R ServerBig Analytics Cloud Computing Center


Univariate Dataseries
Name of dataseries
Source
Description
Number of observations141

\begin{tabular}{lllllllll}
\hline
Univariate Dataseries \tabularnewline
Name of dataseries &  \tabularnewline
Source &  \tabularnewline
Description &  \tabularnewline
Number of observations & 141 \tabularnewline
\hline
\end{tabular}
%Source: https://freestatistics.org/blog/index.php?pk=299311&T=1

[TABLE]
[ROW][C]Univariate Dataseries[/C][/ROW]
[ROW][C]Name of dataseries[/C][C][/C][/ROW]
[ROW][C]Source[/C][C][/C][/ROW]
[ROW][C]Description[/C][C][/C][/ROW]
[ROW][C]Number of observations[/C][C]141[/C][/ROW]
[/TABLE]
Source: https://freestatistics.org/blog/index.php?pk=299311&T=1

Globally Unique Identifier (entire table): ba.freestatistics.org/blog/index.php?pk=299311&T=1

As an alternative you can also use a QR Code:  

The GUIDs for individual cells are displayed in the table below:

Univariate Dataseries
Name of dataseries
Source
Description
Number of observations141


Summary Statistics of dataseries x
> summary(x)
   Min. 1st Qu.  Median    Mean 3rd Qu.    Max. 
      6     229     510     601     770    4904 

\begin{tabular}{lllllllll}
\hline
Summary Statistics of dataseries x \tabularnewline
> summary(x)
   Min. 1st Qu.  Median    Mean 3rd Qu.    Max. 
      6     229     510     601     770    4904 
\tabularnewline \hline \end{tabular} %Source: https://freestatistics.org/blog/index.php?pk=299311&T=2

[TABLE]
[ROW][C]Summary Statistics of dataseries x[/C][/ROW]
[ROW][C]
> summary(x)
   Min. 1st Qu.  Median    Mean 3rd Qu.    Max. 
      6     229     510     601     770    4904 
[/C][/ROW] [/TABLE] Source: https://freestatistics.org/blog/index.php?pk=299311&T=2

Globally Unique Identifier (entire table): ba.freestatistics.org/blog/index.php?pk=299311&T=2

As an alternative you can also use a QR Code:  

The GUIDs for individual cells are displayed in the table below:

Summary Statistics of dataseries x
> summary(x)
   Min. 1st Qu.  Median    Mean 3rd Qu.    Max. 
      6     229     510     601     770    4904 


Parameters (Session):
par4 = 12 ;
Parameters (R input):
par1 = ; par2 = ; par3 = ; par4 = 12 ;
R code (references can be found in the software module):
if (par4 != 'No season') {
par4 <- as.numeric(par4)
if (par4 < 4) par4 <- 12
}
summary(x)
n <- length(x)
bitmap(file='test1.png')
if (par4=='No season') {
plot(x,col=2,type='b',main=main,xlab=xlab,ylab=ylab,xaxt='n')
axis(1,at=seq(1,n,10))
}
if (par4!='No season') {
plot(x,col=2,type='b',main=main,xlab=xlab,ylab=ylab,xaxt='n')
axis(1,at=seq(1,n,par4))
grid(nx=0,ny=NULL,col='black')
abline(v=seq(1,n,par4),col='black',lty='dotted')
}
dev.off()
load(file='createtable')
a<-table.start()
a<-table.row.start(a)
a<-table.element(a,'Univariate Dataseries',2,TRUE)
a<-table.row.end(a)
a<-table.row.start(a)
a<-table.element(a,'Name of dataseries',header=TRUE)
a<-table.element(a,par1)
a<-table.row.end(a)
a<-table.row.start(a)
a<-table.element(a,'Source',header=TRUE)
a<-table.element(a,par2)
a<-table.row.end(a)
a<-table.row.start(a)
a<-table.element(a,'Description',header=TRUE)
a<-table.element(a,par3)
a<-table.row.end(a)
a<-table.row.start(a)
a<-table.element(a,'Number of observations',header=TRUE)
a<-table.element(a,length(x))
a<-table.row.end(a)
a<-table.end(a)
table.save(a,file='mytable.tab')
a<-table.start()
a<-table.row.start(a)
a<-table.element(a,'Summary Statistics of dataseries x',1,TRUE)
a<-table.row.end(a)
a<-table.row.start(a)
a<-table.element(a,paste('
',RC.texteval('summary(x)'),'
',sep=''))
a<-table.row.end(a)
a<-table.end(a)
table.save(a,file='mytable1.tab')