Free Statistics

of Irreproducible Research!

Author's title

Author*The author of this computation has been verified*
R Software Modulerwasp_arimabackwardselection.wasp
Title produced by softwareARIMA Backward Selection
Date of computationWed, 14 Dec 2016 12:56:31 +0100
Cite this page as followsStatistical Computations at FreeStatistics.org, Office for Research Development and Education, URL https://freestatistics.org/blog/index.php?v=date/2016/Dec/14/t1481716614xjbe1zwj3c7xgyo.htm/, Retrieved Sat, 04 May 2024 03:34:44 +0000
Statistical Computations at FreeStatistics.org, Office for Research Development and Education, URL https://freestatistics.org/blog/index.php?pk=299328, Retrieved Sat, 04 May 2024 03:34:44 +0000
QR Codes:

Original text written by user:
IsPrivate?No (this computation is public)
User-defined keywords
Estimated Impact69
Family? (F = Feedback message, R = changed R code, M = changed R Module, P = changed Parameters, D = changed Data)
-       [ARIMA Backward Selection] [ARIMA Backward Se...] [2016-12-14 11:56:31] [f916b4255bf1e1993d1067800ff1f972] [Current]
Feedback Forum

Post a new message
Dataseries X:
5033
4509.5
3970
3378
2866
2315.5
1895
8401.5
8040
7534
7135.5
6466.5
5661.5
4896
4064.5
3296
2593.5
2007
1513.5
6645
6221.5
5474
5135.5
4630.5
4164
3600.5
2969
2503.5
2054.5
1608.5
1297.5
8485
8163.5
7814
7453.5
6888.5
6283.5
5712
5030
4488
4058.5
3585
3199.5
8181
8219.5
7865.5
7516.5
7116
6615.5
6216.5
5699.5
5179
4727.5
4224.5
3780.5
7023.5
6558
6257.5
5862.5
5343
4756
4173.5
3451.5
2849
2351
1887.5
1416.5
7399
7013
6644.5
6238.5
5721
5137.5
4357
3750.5
3324
2861
2455.5
2027.5
8388.5
7910
7686
7163
6841.5
6448.5
6060.5
5739
5362.5
5081
4764
4522.5
9056.5
8352
7683
7319.5
6708
6204.5
5576.5
4776.5
4279.5
3918
3288.5
2393.5
8131.5
8121
7790.5
7411.5
6861
6197
5622.5
4855.5
4303.5
3853.5
3283.5
2861.5
9486.5
9061
8877.5
8557.5
8031
7404.5
6852.5
6174.5
5341.5
4975.5
4290


Summary of computational transaction
Raw Input view raw input (R code)
Raw Outputview raw output of R engine
Computing time4 seconds
R ServerBig Analytics Cloud Computing Center

\begin{tabular}{lllllllll}
\hline
Summary of computational transaction \tabularnewline
Raw Input view raw input (R code)  \tabularnewline
Raw Outputview raw output of R engine  \tabularnewline
Computing time4 seconds \tabularnewline
R ServerBig Analytics Cloud Computing Center \tabularnewline
\hline
\end{tabular}
%Source: https://freestatistics.org/blog/index.php?pk=299328&T=0

[TABLE]
[ROW]
Summary of computational transaction[/C][/ROW] [ROW]Raw Input[/C] view raw input (R code) [/C][/ROW] [ROW]Raw Output[/C]view raw output of R engine [/C][/ROW] [ROW]Computing time[/C]4 seconds[/C][/ROW] [ROW]R Server[/C]Big Analytics Cloud Computing Center[/C][/ROW] [/TABLE] Source: https://freestatistics.org/blog/index.php?pk=299328&T=0

Globally Unique Identifier (entire table): ba.freestatistics.org/blog/index.php?pk=299328&T=0

As an alternative you can also use a QR Code:  

The GUIDs for individual cells are displayed in the table below:

Summary of computational transaction
Raw Input view raw input (R code)
Raw Outputview raw output of R engine
Computing time4 seconds
R ServerBig Analytics Cloud Computing Center


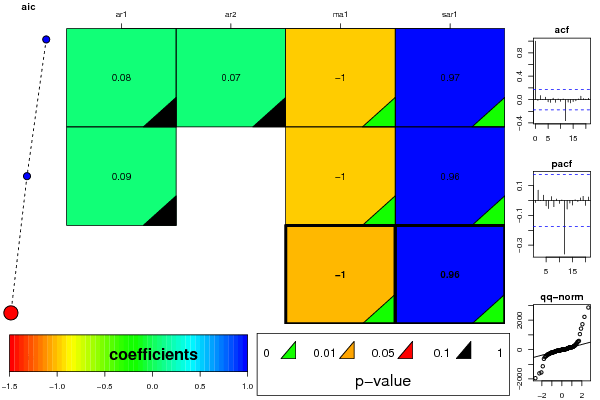
ARIMA Parameter Estimation and Backward Selection
Iterationar1ar2ma1sar1
Estimates ( 1 )0.0810.0748-10.9652
(p-val)(0.3689 )(0.406 )(0 )(0 )
Estimates ( 2 )0.08610-10.9644
(p-val)(0.3399 )(NA )(0 )(0 )
Estimates ( 3 )00-10.9635
(p-val)(NA )(NA )(0 )(0 )
Estimates ( 4 )NANANANA
(p-val)(NA )(NA )(NA )(NA )
Estimates ( 5 )NANANANA
(p-val)(NA )(NA )(NA )(NA )
Estimates ( 6 )NANANANA
(p-val)(NA )(NA )(NA )(NA )
Estimates ( 7 )NANANANA
(p-val)(NA )(NA )(NA )(NA )

\begin{tabular}{lllllllll}
\hline
ARIMA Parameter Estimation and Backward Selection \tabularnewline
Iteration & ar1 & ar2 & ma1 & sar1 \tabularnewline
Estimates ( 1 ) & 0.081 & 0.0748 & -1 & 0.9652 \tabularnewline
(p-val) & (0.3689 ) & (0.406 ) & (0 ) & (0 ) \tabularnewline
Estimates ( 2 ) & 0.0861 & 0 & -1 & 0.9644 \tabularnewline
(p-val) & (0.3399 ) & (NA ) & (0 ) & (0 ) \tabularnewline
Estimates ( 3 ) & 0 & 0 & -1 & 0.9635 \tabularnewline
(p-val) & (NA ) & (NA ) & (0 ) & (0 ) \tabularnewline
Estimates ( 4 ) & NA & NA & NA & NA \tabularnewline
(p-val) & (NA ) & (NA ) & (NA ) & (NA ) \tabularnewline
Estimates ( 5 ) & NA & NA & NA & NA \tabularnewline
(p-val) & (NA ) & (NA ) & (NA ) & (NA ) \tabularnewline
Estimates ( 6 ) & NA & NA & NA & NA \tabularnewline
(p-val) & (NA ) & (NA ) & (NA ) & (NA ) \tabularnewline
Estimates ( 7 ) & NA & NA & NA & NA \tabularnewline
(p-val) & (NA ) & (NA ) & (NA ) & (NA ) \tabularnewline
\hline
\end{tabular}
%Source: https://freestatistics.org/blog/index.php?pk=299328&T=1

[TABLE]
[ROW][C]ARIMA Parameter Estimation and Backward Selection[/C][/ROW]
[ROW][C]Iteration[/C][C]ar1[/C][C]ar2[/C][C]ma1[/C][C]sar1[/C][/ROW]
[ROW][C]Estimates ( 1 )[/C][C]0.081[/C][C]0.0748[/C][C]-1[/C][C]0.9652[/C][/ROW]
[ROW][C](p-val)[/C][C](0.3689 )[/C][C](0.406 )[/C][C](0 )[/C][C](0 )[/C][/ROW]
[ROW][C]Estimates ( 2 )[/C][C]0.0861[/C][C]0[/C][C]-1[/C][C]0.9644[/C][/ROW]
[ROW][C](p-val)[/C][C](0.3399 )[/C][C](NA )[/C][C](0 )[/C][C](0 )[/C][/ROW]
[ROW][C]Estimates ( 3 )[/C][C]0[/C][C]0[/C][C]-1[/C][C]0.9635[/C][/ROW]
[ROW][C](p-val)[/C][C](NA )[/C][C](NA )[/C][C](0 )[/C][C](0 )[/C][/ROW]
[ROW][C]Estimates ( 4 )[/C][C]NA[/C][C]NA[/C][C]NA[/C][C]NA[/C][/ROW]
[ROW][C](p-val)[/C][C](NA )[/C][C](NA )[/C][C](NA )[/C][C](NA )[/C][/ROW]
[ROW][C]Estimates ( 5 )[/C][C]NA[/C][C]NA[/C][C]NA[/C][C]NA[/C][/ROW]
[ROW][C](p-val)[/C][C](NA )[/C][C](NA )[/C][C](NA )[/C][C](NA )[/C][/ROW]
[ROW][C]Estimates ( 6 )[/C][C]NA[/C][C]NA[/C][C]NA[/C][C]NA[/C][/ROW]
[ROW][C](p-val)[/C][C](NA )[/C][C](NA )[/C][C](NA )[/C][C](NA )[/C][/ROW]
[ROW][C]Estimates ( 7 )[/C][C]NA[/C][C]NA[/C][C]NA[/C][C]NA[/C][/ROW]
[ROW][C](p-val)[/C][C](NA )[/C][C](NA )[/C][C](NA )[/C][C](NA )[/C][/ROW]
[/TABLE]
Source: https://freestatistics.org/blog/index.php?pk=299328&T=1

Globally Unique Identifier (entire table): ba.freestatistics.org/blog/index.php?pk=299328&T=1

As an alternative you can also use a QR Code:  

The GUIDs for individual cells are displayed in the table below:

ARIMA Parameter Estimation and Backward Selection
Iterationar1ar2ma1sar1
Estimates ( 1 )0.0810.0748-10.9652
(p-val)(0.3689 )(0.406 )(0 )(0 )
Estimates ( 2 )0.08610-10.9644
(p-val)(0.3399 )(NA )(0 )(0 )
Estimates ( 3 )00-10.9635
(p-val)(NA )(NA )(0 )(0 )
Estimates ( 4 )NANANANA
(p-val)(NA )(NA )(NA )(NA )
Estimates ( 5 )NANANANA
(p-val)(NA )(NA )(NA )(NA )
Estimates ( 6 )NANANANA
(p-val)(NA )(NA )(NA )(NA )
Estimates ( 7 )NANANANA
(p-val)(NA )(NA )(NA )(NA )


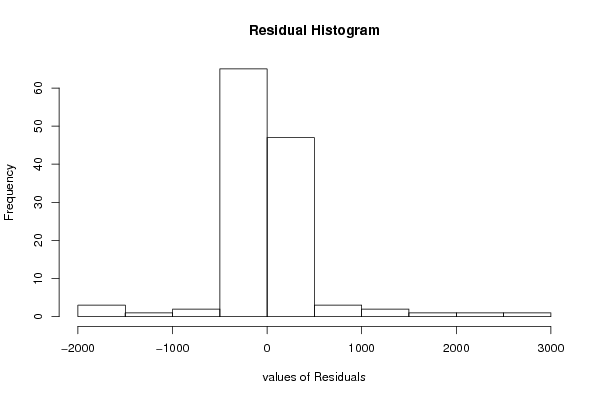
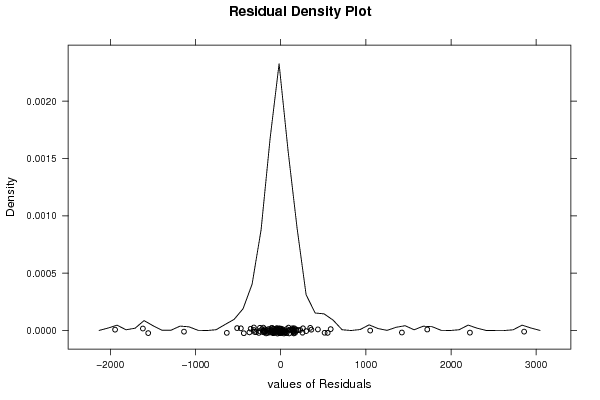
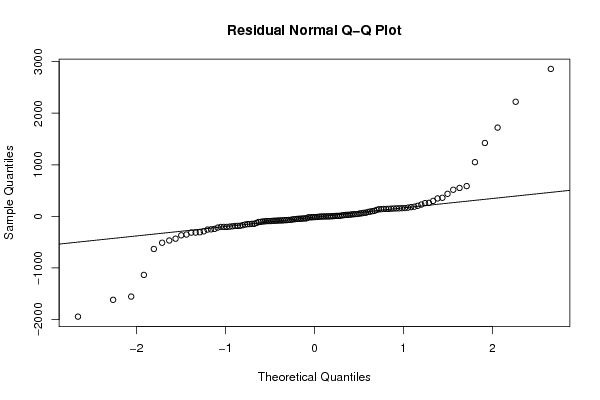
Estimated ARIMA Residuals
Value
-7.92264145867933
-3.15897422634683
-13.1221998369345
10.0042374835079
-2.93516145359455
29.846683647867
1721.22932171171
-352.034140628921
-199.883410745842
-148.993212191261
-204.570003389565
-205.663896294317
-256.509707736527
-289.86168769736
-171.52674392763
-192.19324110393
-37.9280956449031
-83.3999317220135
-1135.41544857304
25.1212897688159
-251.373537325957
69.9831235565525
137.923268311893
299.138429177445
149.101831397217
156.161162772244
261.467793756771
204.909094444139
99.8683141297455
154.362625753109
2222.23197523588
-109.371888089885
360.172162909192
-69.9943157838812
-78.8959712855913
-152.077796384353
-18.2608458735714
-74.0510008292664
-90.1623468571912
8.21479005536133
-46.9669735821232
-85.0343874810899
-1944.83636331481
515.789413727741
-47.9907305880615
-0.877383819935453
143.406376313732
69.2841118269232
143.611929059711
126.033030490267
-11.5877414067292
-39.1251101561147
-44.7290350834985
-69.7385967474961
-1555.54234600463
-367.206607535763
85.3823967445713
-60.7572086467789
-126.904869947164
-91.3635760650554
-187.051719204635
-204.431610699907
-79.143986269371
-51.6784076703963
29.2389679910326
-42.4014754628647
2858.79378651342
-184.429051749207
-85.4961148573604
-19.5881214374795
-15.6087445072038
-17.2241860991618
-218.325248715138
107.628760588387
145.638117229252
2.67569821934954
38.6943111887161
21.30042022216
587.159558197437
-159.2170973422
138.47035072033
-144.819816161081
186.819268733335
152.133673494182
347.466404174981
228.971692872502
8.93183402831882
158.703929942589
56.3918000039497
161.276733943796
-1618.23489580377
-106.666376871648
-433.164157451525
178.956517626893
-314.423476077824
-99.1021718526363
-243.432181508908
-467.959292951646
-91.2078425399245
-77.8725669677722
-315.152702532549
-632.713552846131
1423.20057373728
551.078266812631
256.251438554505
-56.5208462658248
40.7165183663042
-182.678832475192
45.7267362394545
1.0359213369457
-73.8518398886041
-95.7737479036492
45.2010029805607
437.025901710115
1051.1085302496
-511.596721764013
168.953281409293
31.6889147763503
-1.70335183436675
11.2934580594124
-1.34574029304702
59.2902192866155
-308.043350563694
91.9243683729612
-143.549263384656

\begin{tabular}{lllllllll}
\hline
Estimated ARIMA Residuals \tabularnewline
Value \tabularnewline
-7.92264145867933 \tabularnewline
-3.15897422634683 \tabularnewline
-13.1221998369345 \tabularnewline
10.0042374835079 \tabularnewline
-2.93516145359455 \tabularnewline
29.846683647867 \tabularnewline
1721.22932171171 \tabularnewline
-352.034140628921 \tabularnewline
-199.883410745842 \tabularnewline
-148.993212191261 \tabularnewline
-204.570003389565 \tabularnewline
-205.663896294317 \tabularnewline
-256.509707736527 \tabularnewline
-289.86168769736 \tabularnewline
-171.52674392763 \tabularnewline
-192.19324110393 \tabularnewline
-37.9280956449031 \tabularnewline
-83.3999317220135 \tabularnewline
-1135.41544857304 \tabularnewline
25.1212897688159 \tabularnewline
-251.373537325957 \tabularnewline
69.9831235565525 \tabularnewline
137.923268311893 \tabularnewline
299.138429177445 \tabularnewline
149.101831397217 \tabularnewline
156.161162772244 \tabularnewline
261.467793756771 \tabularnewline
204.909094444139 \tabularnewline
99.8683141297455 \tabularnewline
154.362625753109 \tabularnewline
2222.23197523588 \tabularnewline
-109.371888089885 \tabularnewline
360.172162909192 \tabularnewline
-69.9943157838812 \tabularnewline
-78.8959712855913 \tabularnewline
-152.077796384353 \tabularnewline
-18.2608458735714 \tabularnewline
-74.0510008292664 \tabularnewline
-90.1623468571912 \tabularnewline
8.21479005536133 \tabularnewline
-46.9669735821232 \tabularnewline
-85.0343874810899 \tabularnewline
-1944.83636331481 \tabularnewline
515.789413727741 \tabularnewline
-47.9907305880615 \tabularnewline
-0.877383819935453 \tabularnewline
143.406376313732 \tabularnewline
69.2841118269232 \tabularnewline
143.611929059711 \tabularnewline
126.033030490267 \tabularnewline
-11.5877414067292 \tabularnewline
-39.1251101561147 \tabularnewline
-44.7290350834985 \tabularnewline
-69.7385967474961 \tabularnewline
-1555.54234600463 \tabularnewline
-367.206607535763 \tabularnewline
85.3823967445713 \tabularnewline
-60.7572086467789 \tabularnewline
-126.904869947164 \tabularnewline
-91.3635760650554 \tabularnewline
-187.051719204635 \tabularnewline
-204.431610699907 \tabularnewline
-79.143986269371 \tabularnewline
-51.6784076703963 \tabularnewline
29.2389679910326 \tabularnewline
-42.4014754628647 \tabularnewline
2858.79378651342 \tabularnewline
-184.429051749207 \tabularnewline
-85.4961148573604 \tabularnewline
-19.5881214374795 \tabularnewline
-15.6087445072038 \tabularnewline
-17.2241860991618 \tabularnewline
-218.325248715138 \tabularnewline
107.628760588387 \tabularnewline
145.638117229252 \tabularnewline
2.67569821934954 \tabularnewline
38.6943111887161 \tabularnewline
21.30042022216 \tabularnewline
587.159558197437 \tabularnewline
-159.2170973422 \tabularnewline
138.47035072033 \tabularnewline
-144.819816161081 \tabularnewline
186.819268733335 \tabularnewline
152.133673494182 \tabularnewline
347.466404174981 \tabularnewline
228.971692872502 \tabularnewline
8.93183402831882 \tabularnewline
158.703929942589 \tabularnewline
56.3918000039497 \tabularnewline
161.276733943796 \tabularnewline
-1618.23489580377 \tabularnewline
-106.666376871648 \tabularnewline
-433.164157451525 \tabularnewline
178.956517626893 \tabularnewline
-314.423476077824 \tabularnewline
-99.1021718526363 \tabularnewline
-243.432181508908 \tabularnewline
-467.959292951646 \tabularnewline
-91.2078425399245 \tabularnewline
-77.8725669677722 \tabularnewline
-315.152702532549 \tabularnewline
-632.713552846131 \tabularnewline
1423.20057373728 \tabularnewline
551.078266812631 \tabularnewline
256.251438554505 \tabularnewline
-56.5208462658248 \tabularnewline
40.7165183663042 \tabularnewline
-182.678832475192 \tabularnewline
45.7267362394545 \tabularnewline
1.0359213369457 \tabularnewline
-73.8518398886041 \tabularnewline
-95.7737479036492 \tabularnewline
45.2010029805607 \tabularnewline
437.025901710115 \tabularnewline
1051.1085302496 \tabularnewline
-511.596721764013 \tabularnewline
168.953281409293 \tabularnewline
31.6889147763503 \tabularnewline
-1.70335183436675 \tabularnewline
11.2934580594124 \tabularnewline
-1.34574029304702 \tabularnewline
59.2902192866155 \tabularnewline
-308.043350563694 \tabularnewline
91.9243683729612 \tabularnewline
-143.549263384656 \tabularnewline
\hline
\end{tabular}
%Source: https://freestatistics.org/blog/index.php?pk=299328&T=2

[TABLE]
[ROW][C]Estimated ARIMA Residuals[/C][/ROW]
[ROW][C]Value[/C][/ROW]
[ROW][C]-7.92264145867933[/C][/ROW]
[ROW][C]-3.15897422634683[/C][/ROW]
[ROW][C]-13.1221998369345[/C][/ROW]
[ROW][C]10.0042374835079[/C][/ROW]
[ROW][C]-2.93516145359455[/C][/ROW]
[ROW][C]29.846683647867[/C][/ROW]
[ROW][C]1721.22932171171[/C][/ROW]
[ROW][C]-352.034140628921[/C][/ROW]
[ROW][C]-199.883410745842[/C][/ROW]
[ROW][C]-148.993212191261[/C][/ROW]
[ROW][C]-204.570003389565[/C][/ROW]
[ROW][C]-205.663896294317[/C][/ROW]
[ROW][C]-256.509707736527[/C][/ROW]
[ROW][C]-289.86168769736[/C][/ROW]
[ROW][C]-171.52674392763[/C][/ROW]
[ROW][C]-192.19324110393[/C][/ROW]
[ROW][C]-37.9280956449031[/C][/ROW]
[ROW][C]-83.3999317220135[/C][/ROW]
[ROW][C]-1135.41544857304[/C][/ROW]
[ROW][C]25.1212897688159[/C][/ROW]
[ROW][C]-251.373537325957[/C][/ROW]
[ROW][C]69.9831235565525[/C][/ROW]
[ROW][C]137.923268311893[/C][/ROW]
[ROW][C]299.138429177445[/C][/ROW]
[ROW][C]149.101831397217[/C][/ROW]
[ROW][C]156.161162772244[/C][/ROW]
[ROW][C]261.467793756771[/C][/ROW]
[ROW][C]204.909094444139[/C][/ROW]
[ROW][C]99.8683141297455[/C][/ROW]
[ROW][C]154.362625753109[/C][/ROW]
[ROW][C]2222.23197523588[/C][/ROW]
[ROW][C]-109.371888089885[/C][/ROW]
[ROW][C]360.172162909192[/C][/ROW]
[ROW][C]-69.9943157838812[/C][/ROW]
[ROW][C]-78.8959712855913[/C][/ROW]
[ROW][C]-152.077796384353[/C][/ROW]
[ROW][C]-18.2608458735714[/C][/ROW]
[ROW][C]-74.0510008292664[/C][/ROW]
[ROW][C]-90.1623468571912[/C][/ROW]
[ROW][C]8.21479005536133[/C][/ROW]
[ROW][C]-46.9669735821232[/C][/ROW]
[ROW][C]-85.0343874810899[/C][/ROW]
[ROW][C]-1944.83636331481[/C][/ROW]
[ROW][C]515.789413727741[/C][/ROW]
[ROW][C]-47.9907305880615[/C][/ROW]
[ROW][C]-0.877383819935453[/C][/ROW]
[ROW][C]143.406376313732[/C][/ROW]
[ROW][C]69.2841118269232[/C][/ROW]
[ROW][C]143.611929059711[/C][/ROW]
[ROW][C]126.033030490267[/C][/ROW]
[ROW][C]-11.5877414067292[/C][/ROW]
[ROW][C]-39.1251101561147[/C][/ROW]
[ROW][C]-44.7290350834985[/C][/ROW]
[ROW][C]-69.7385967474961[/C][/ROW]
[ROW][C]-1555.54234600463[/C][/ROW]
[ROW][C]-367.206607535763[/C][/ROW]
[ROW][C]85.3823967445713[/C][/ROW]
[ROW][C]-60.7572086467789[/C][/ROW]
[ROW][C]-126.904869947164[/C][/ROW]
[ROW][C]-91.3635760650554[/C][/ROW]
[ROW][C]-187.051719204635[/C][/ROW]
[ROW][C]-204.431610699907[/C][/ROW]
[ROW][C]-79.143986269371[/C][/ROW]
[ROW][C]-51.6784076703963[/C][/ROW]
[ROW][C]29.2389679910326[/C][/ROW]
[ROW][C]-42.4014754628647[/C][/ROW]
[ROW][C]2858.79378651342[/C][/ROW]
[ROW][C]-184.429051749207[/C][/ROW]
[ROW][C]-85.4961148573604[/C][/ROW]
[ROW][C]-19.5881214374795[/C][/ROW]
[ROW][C]-15.6087445072038[/C][/ROW]
[ROW][C]-17.2241860991618[/C][/ROW]
[ROW][C]-218.325248715138[/C][/ROW]
[ROW][C]107.628760588387[/C][/ROW]
[ROW][C]145.638117229252[/C][/ROW]
[ROW][C]2.67569821934954[/C][/ROW]
[ROW][C]38.6943111887161[/C][/ROW]
[ROW][C]21.30042022216[/C][/ROW]
[ROW][C]587.159558197437[/C][/ROW]
[ROW][C]-159.2170973422[/C][/ROW]
[ROW][C]138.47035072033[/C][/ROW]
[ROW][C]-144.819816161081[/C][/ROW]
[ROW][C]186.819268733335[/C][/ROW]
[ROW][C]152.133673494182[/C][/ROW]
[ROW][C]347.466404174981[/C][/ROW]
[ROW][C]228.971692872502[/C][/ROW]
[ROW][C]8.93183402831882[/C][/ROW]
[ROW][C]158.703929942589[/C][/ROW]
[ROW][C]56.3918000039497[/C][/ROW]
[ROW][C]161.276733943796[/C][/ROW]
[ROW][C]-1618.23489580377[/C][/ROW]
[ROW][C]-106.666376871648[/C][/ROW]
[ROW][C]-433.164157451525[/C][/ROW]
[ROW][C]178.956517626893[/C][/ROW]
[ROW][C]-314.423476077824[/C][/ROW]
[ROW][C]-99.1021718526363[/C][/ROW]
[ROW][C]-243.432181508908[/C][/ROW]
[ROW][C]-467.959292951646[/C][/ROW]
[ROW][C]-91.2078425399245[/C][/ROW]
[ROW][C]-77.8725669677722[/C][/ROW]
[ROW][C]-315.152702532549[/C][/ROW]
[ROW][C]-632.713552846131[/C][/ROW]
[ROW][C]1423.20057373728[/C][/ROW]
[ROW][C]551.078266812631[/C][/ROW]
[ROW][C]256.251438554505[/C][/ROW]
[ROW][C]-56.5208462658248[/C][/ROW]
[ROW][C]40.7165183663042[/C][/ROW]
[ROW][C]-182.678832475192[/C][/ROW]
[ROW][C]45.7267362394545[/C][/ROW]
[ROW][C]1.0359213369457[/C][/ROW]
[ROW][C]-73.8518398886041[/C][/ROW]
[ROW][C]-95.7737479036492[/C][/ROW]
[ROW][C]45.2010029805607[/C][/ROW]
[ROW][C]437.025901710115[/C][/ROW]
[ROW][C]1051.1085302496[/C][/ROW]
[ROW][C]-511.596721764013[/C][/ROW]
[ROW][C]168.953281409293[/C][/ROW]
[ROW][C]31.6889147763503[/C][/ROW]
[ROW][C]-1.70335183436675[/C][/ROW]
[ROW][C]11.2934580594124[/C][/ROW]
[ROW][C]-1.34574029304702[/C][/ROW]
[ROW][C]59.2902192866155[/C][/ROW]
[ROW][C]-308.043350563694[/C][/ROW]
[ROW][C]91.9243683729612[/C][/ROW]
[ROW][C]-143.549263384656[/C][/ROW]
[/TABLE]
Source: https://freestatistics.org/blog/index.php?pk=299328&T=2

Globally Unique Identifier (entire table): ba.freestatistics.org/blog/index.php?pk=299328&T=2

As an alternative you can also use a QR Code:  

The GUIDs for individual cells are displayed in the table below:

Estimated ARIMA Residuals
Value
-7.92264145867933
-3.15897422634683
-13.1221998369345
10.0042374835079
-2.93516145359455
29.846683647867
1721.22932171171
-352.034140628921
-199.883410745842
-148.993212191261
-204.570003389565
-205.663896294317
-256.509707736527
-289.86168769736
-171.52674392763
-192.19324110393
-37.9280956449031
-83.3999317220135
-1135.41544857304
25.1212897688159
-251.373537325957
69.9831235565525
137.923268311893
299.138429177445
149.101831397217
156.161162772244
261.467793756771
204.909094444139
99.8683141297455
154.362625753109
2222.23197523588
-109.371888089885
360.172162909192
-69.9943157838812
-78.8959712855913
-152.077796384353
-18.2608458735714
-74.0510008292664
-90.1623468571912
8.21479005536133
-46.9669735821232
-85.0343874810899
-1944.83636331481
515.789413727741
-47.9907305880615
-0.877383819935453
143.406376313732
69.2841118269232
143.611929059711
126.033030490267
-11.5877414067292
-39.1251101561147
-44.7290350834985
-69.7385967474961
-1555.54234600463
-367.206607535763
85.3823967445713
-60.7572086467789
-126.904869947164
-91.3635760650554
-187.051719204635
-204.431610699907
-79.143986269371
-51.6784076703963
29.2389679910326
-42.4014754628647
2858.79378651342
-184.429051749207
-85.4961148573604
-19.5881214374795
-15.6087445072038
-17.2241860991618
-218.325248715138
107.628760588387
145.638117229252
2.67569821934954
38.6943111887161
21.30042022216
587.159558197437
-159.2170973422
138.47035072033
-144.819816161081
186.819268733335
152.133673494182
347.466404174981
228.971692872502
8.93183402831882
158.703929942589
56.3918000039497
161.276733943796
-1618.23489580377
-106.666376871648
-433.164157451525
178.956517626893
-314.423476077824
-99.1021718526363
-243.432181508908
-467.959292951646
-91.2078425399245
-77.8725669677722
-315.152702532549
-632.713552846131
1423.20057373728
551.078266812631
256.251438554505
-56.5208462658248
40.7165183663042
-182.678832475192
45.7267362394545
1.0359213369457
-73.8518398886041
-95.7737479036492
45.2010029805607
437.025901710115
1051.1085302496
-511.596721764013
168.953281409293
31.6889147763503
-1.70335183436675
11.2934580594124
-1.34574029304702
59.2902192866155
-308.043350563694
91.9243683729612
-143.549263384656


Parameters (Session):
par1 = FALSE ; par2 = 1 ; par3 = 2 ; par4 = 0 ; par5 = 12 ; par6 = 2 ; par7 = 1 ; par8 = 1 ; par9 = 0 ;
Parameters (R input):
par1 = FALSE ; par2 = 1 ; par3 = 2 ; par4 = 0 ; par5 = 12 ; par6 = 2 ; par7 = 1 ; par8 = 1 ; par9 = 0 ;
R code (references can be found in the software module):
library(lattice)
if (par1 == 'TRUE') par1 <- TRUE
if (par1 == 'FALSE') par1 <- FALSE
par2 <- as.numeric(par2) #Box-Cox lambda transformation parameter
par3 <- as.numeric(par3) #degree of non-seasonal differencing
par4 <- as.numeric(par4) #degree of seasonal differencing
par5 <- as.numeric(par5) #seasonal period
par6 <- as.numeric(par6) #degree (p) of the non-seasonal AR(p) polynomial
par7 <- as.numeric(par7) #degree (q) of the non-seasonal MA(q) polynomial
par8 <- as.numeric(par8) #degree (P) of the seasonal AR(P) polynomial
par9 <- as.numeric(par9) #degree (Q) of the seasonal MA(Q) polynomial
armaGR <- function(arima.out, names, n){
try1 <- arima.out$coef
try2 <- sqrt(diag(arima.out$var.coef))
try.data.frame <- data.frame(matrix(NA,ncol=4,nrow=length(names)))
dimnames(try.data.frame) <- list(names,c('coef','std','tstat','pv'))
try.data.frame[,1] <- try1
for(i in 1:length(try2)) try.data.frame[which(rownames(try.data.frame)==names(try2)[i]),2] <- try2[i]
try.data.frame[,3] <- try.data.frame[,1] / try.data.frame[,2]
try.data.frame[,4] <- round((1-pt(abs(try.data.frame[,3]),df=n-(length(try2)+1)))*2,5)
vector <- rep(NA,length(names))
vector[is.na(try.data.frame[,4])] <- 0
maxi <- which.max(try.data.frame[,4])
continue <- max(try.data.frame[,4],na.rm=TRUE) > .05
vector[maxi] <- 0
list(summary=try.data.frame,next.vector=vector,continue=continue)
}
arimaSelect <- function(series, order=c(13,0,0), seasonal=list(order=c(2,0,0),period=12), include.mean=F){
nrc <- order[1]+order[3]+seasonal$order[1]+seasonal$order[3]
coeff <- matrix(NA, nrow=nrc*2, ncol=nrc)
pval <- matrix(NA, nrow=nrc*2, ncol=nrc)
mylist <- rep(list(NULL), nrc)
names <- NULL
if(order[1] > 0) names <- paste('ar',1:order[1],sep='')
if(order[3] > 0) names <- c( names , paste('ma',1:order[3],sep='') )
if(seasonal$order[1] > 0) names <- c(names, paste('sar',1:seasonal$order[1],sep=''))
if(seasonal$order[3] > 0) names <- c(names, paste('sma',1:seasonal$order[3],sep=''))
arima.out <- arima(series, order=order, seasonal=seasonal, include.mean=include.mean, method='ML')
mylist[[1]] <- arima.out
last.arma <- armaGR(arima.out, names, length(series))
mystop <- FALSE
i <- 1
coeff[i,] <- last.arma[[1]][,1]
pval [i,] <- last.arma[[1]][,4]
i <- 2
aic <- arima.out$aic
while(!mystop){
mylist[[i]] <- arima.out
arima.out <- arima(series, order=order, seasonal=seasonal, include.mean=include.mean, method='ML', fixed=last.arma$next.vector)
aic <- c(aic, arima.out$aic)
last.arma <- armaGR(arima.out, names, length(series))
mystop <- !last.arma$continue
coeff[i,] <- last.arma[[1]][,1]
pval [i,] <- last.arma[[1]][,4]
i <- i+1
}
list(coeff, pval, mylist, aic=aic)
}
arimaSelectplot <- function(arimaSelect.out,noms,choix){
noms <- names(arimaSelect.out[[3]][[1]]$coef)
coeff <- arimaSelect.out[[1]]
k <- min(which(is.na(coeff[,1])))-1
coeff <- coeff[1:k,]
pval <- arimaSelect.out[[2]][1:k,]
aic <- arimaSelect.out$aic[1:k]
coeff[coeff==0] <- NA
n <- ncol(coeff)
if(missing(choix)) choix <- k
layout(matrix(c(1,1,1,2,
3,3,3,2,
3,3,3,4,
5,6,7,7),nr=4),
widths=c(10,35,45,15),
heights=c(30,30,15,15))
couleurs <- rainbow(75)[1:50]#(50)
ticks <- pretty(coeff)
par(mar=c(1,1,3,1))
plot(aic,k:1-.5,type='o',pch=21,bg='blue',cex=2,axes=F,lty=2,xpd=NA)
points(aic[choix],k-choix+.5,pch=21,cex=4,bg=2,xpd=NA)
title('aic',line=2)
par(mar=c(3,0,0,0))
plot(0,axes=F,xlab='',ylab='',xlim=range(ticks),ylim=c(.1,1))
rect(xleft = min(ticks) + (0:49)/50*(max(ticks)-min(ticks)),
xright = min(ticks) + (1:50)/50*(max(ticks)-min(ticks)),
ytop = rep(1,50),
ybottom= rep(0,50),col=couleurs,border=NA)
axis(1,ticks)
rect(xleft=min(ticks),xright=max(ticks),ytop=1,ybottom=0)
text(mean(coeff,na.rm=T),.5,'coefficients',cex=2,font=2)
par(mar=c(1,1,3,1))
image(1:n,1:k,t(coeff[k:1,]),axes=F,col=couleurs,zlim=range(ticks))
for(i in 1:n) for(j in 1:k) if(!is.na(coeff[j,i])) {
if(pval[j,i]<.01) symb = 'green'
else if( (pval[j,i]<.05) & (pval[j,i]>=.01)) symb = 'orange'
else if( (pval[j,i]<.1) & (pval[j,i]>=.05)) symb = 'red'
else symb = 'black'
polygon(c(i+.5 ,i+.2 ,i+.5 ,i+.5),
c(k-j+0.5,k-j+0.5,k-j+0.8,k-j+0.5),
col=symb)
if(j==choix) {
rect(xleft=i-.5,
xright=i+.5,
ybottom=k-j+1.5,
ytop=k-j+.5,
lwd=4)
text(i,
k-j+1,
round(coeff[j,i],2),
cex=1.2,
font=2)
}
else{
rect(xleft=i-.5,xright=i+.5,ybottom=k-j+1.5,ytop=k-j+.5)
text(i,k-j+1,round(coeff[j,i],2),cex=1.2,font=1)
}
}
axis(3,1:n,noms)
par(mar=c(0.5,0,0,0.5))
plot(0,axes=F,xlab='',ylab='',type='n',xlim=c(0,8),ylim=c(-.2,.8))
cols <- c('green','orange','red','black')
niv <- c('0','0.01','0.05','0.1')
for(i in 0:3){
polygon(c(1+2*i ,1+2*i ,1+2*i-.5 ,1+2*i),
c(.4 ,.7 , .4 , .4),
col=cols[i+1])
text(2*i,0.5,niv[i+1],cex=1.5)
}
text(8,.5,1,cex=1.5)
text(4,0,'p-value',cex=2)
box()
residus <- arimaSelect.out[[3]][[choix]]$res
par(mar=c(1,2,4,1))
acf(residus,main='')
title('acf',line=.5)
par(mar=c(1,2,4,1))
pacf(residus,main='')
title('pacf',line=.5)
par(mar=c(2,2,4,1))
qqnorm(residus,main='')
title('qq-norm',line=.5)
qqline(residus)
residus
}
if (par2 == 0) x <- log(x)
if (par2 != 0) x <- x^par2
(selection <- arimaSelect(x, order=c(par6,par3,par7), seasonal=list(order=c(par8,par4,par9), period=par5)))
bitmap(file='test1.png')
resid <- arimaSelectplot(selection)
dev.off()
resid
bitmap(file='test2.png')
acf(resid,length(resid)/2, main='Residual Autocorrelation Function')
dev.off()
bitmap(file='test3.png')
pacf(resid,length(resid)/2, main='Residual Partial Autocorrelation Function')
dev.off()
bitmap(file='test4.png')
cpgram(resid, main='Residual Cumulative Periodogram')
dev.off()
bitmap(file='test5.png')
hist(resid, main='Residual Histogram', xlab='values of Residuals')
dev.off()
bitmap(file='test6.png')
densityplot(~resid,col='black',main='Residual Density Plot', xlab='values of Residuals')
dev.off()
bitmap(file='test7.png')
qqnorm(resid, main='Residual Normal Q-Q Plot')
qqline(resid)
dev.off()
ncols <- length(selection[[1]][1,])
nrows <- length(selection[[2]][,1])-1
load(file='createtable')
a<-table.start()
a<-table.row.start(a)
a<-table.element(a,'ARIMA Parameter Estimation and Backward Selection', ncols+1,TRUE)
a<-table.row.end(a)
a<-table.row.start(a)
a<-table.element(a,'Iteration', header=TRUE)
for (i in 1:ncols) {
a<-table.element(a,names(selection[[3]][[1]]$coef)[i],header=TRUE)
}
a<-table.row.end(a)
for (j in 1:nrows) {
a<-table.row.start(a)
mydum <- 'Estimates ('
mydum <- paste(mydum,j)
mydum <- paste(mydum,')')
a<-table.element(a,mydum, header=TRUE)
for (i in 1:ncols) {
a<-table.element(a,round(selection[[1]][j,i],4))
}
a<-table.row.end(a)
a<-table.row.start(a)
a<-table.element(a,'(p-val)', header=TRUE)
for (i in 1:ncols) {
mydum <- '('
mydum <- paste(mydum,round(selection[[2]][j,i],4),sep='')
mydum <- paste(mydum,')')
a<-table.element(a,mydum)
}
a<-table.row.end(a)
}
a<-table.end(a)
table.save(a,file='mytable.tab')
a<-table.start()
a<-table.row.start(a)
a<-table.element(a,'Estimated ARIMA Residuals', 1,TRUE)
a<-table.row.end(a)
a<-table.row.start(a)
a<-table.element(a,'Value', 1,TRUE)
a<-table.row.end(a)
for (i in (par4*par5+par3):length(resid)) {
a<-table.row.start(a)
a<-table.element(a,resid[i])
a<-table.row.end(a)
}
a<-table.end(a)
table.save(a,file='mytable1.tab')