Free Statistics

of Irreproducible Research!

Author's title

Author*The author of this computation has been verified*
R Software Modulerwasp_multipleregression.wasp
Title produced by softwareMultiple Regression
Date of computationWed, 14 Dec 2016 13:03:38 +0100
Cite this page as followsStatistical Computations at FreeStatistics.org, Office for Research Development and Education, URL https://freestatistics.org/blog/index.php?v=date/2016/Dec/14/t1481717031rdwlc9w9qqhbwmv.htm/, Retrieved Fri, 03 May 2024 17:40:32 +0000
Statistical Computations at FreeStatistics.org, Office for Research Development and Education, URL https://freestatistics.org/blog/index.php?pk=299335, Retrieved Fri, 03 May 2024 17:40:32 +0000
QR Codes:

Original text written by user:
IsPrivate?No (this computation is public)
User-defined keywords
Estimated Impact78
Family? (F = Feedback message, R = changed R code, M = changed R Module, P = changed Parameters, D = changed Data)
-       [Multiple Regression] [Multiple regression] [2016-12-14 12:03:38] [02b5df5aa2382aa6805f6181aa5e25f1] [Current]
Feedback Forum

Post a new message
Dataseries X:
14	2	2	3	4
19	4	2	1	4
17	4	2	5	4
17	4	3	4	4
15	3	4	3	3
20	4	3	2	5
15	1	4	4	4
19	4	2	5	4
15	4	4	3	4
19	2	2	2	4
20	4	5	4	3
18	5	4	4	4
15	4	2	4	4
14	1	3	5	4
20	2	1	2	5
16	4	3	2	4
16	5	4	4	4
16	5	5	4	4
10	4	5	4	4
19	1	1	5	4
19	4	4	3	4
16	2	2	4	4
15	4	4	3	4
18	5	4	3	3
17	3	3	3	3
19	5	4	5	5
17	3	2	4	4
19	2	4	3	4
20	1	2	3	4
19	4	2	3	3
16	4	4	3	4
15	3	3	3	4
16	5	3	5	5
18	4	4	3	4
15	4	3	3	4
17	2	2	4	3
20	1	2	1	5
19	3	2	4	4
7	3	3	4	3
13	3	3	3	3
16	4	4	4	4
18	4	4	4	4
18	4	4	4	4
16	2	4	3	4
17	5	2	2	4
19	3	2	4	3
16	3	1	3	4
19	4	3	3	3
13	4	4	3	4
16	4	3	4	2
13	3	3	4	4
12	4	2	3	4
17	4	3	4	4
17	4	2	5	3
17	4	4	2	4
16	4	3	3	3
16	2	2	3	4
14	4	4	3	3
16	4	5	4	4
13	4	4	3	4
16	4	3	4	4
14	4	2	3	4
20	5	3	1	3
12	3	4	4	3
13	2	4	3	2
18	4	4	2	4
14	5	5	3	5
19	4	4	3	4
18	5	4	4	5
14	5	4	5	2
18	2	3	3	4
19	4	2	4	4
15	4	4	2	4
14	4	4	2	4
17	3	4	2	5
19	4	2	3	4
13	2	2	4	4
19	5	1	3	4
20	4	4	4	1
15	2	4	4	4
15	4	4	3	4
15	3	3	4	3
20	3	4	3	4
15	4	4	5	4
19	4	4	4	3
18	4	2	4	3
18	3	4	3	4
15	4	4	4	5
20	3	1	1	3
17	3	4	4	4
12	1	2	4	3
18	4	3	4	4
19	3	3	4	5
20	3	4	4	3
17	5	4	5	4
16	5	4	5	5
18	4	4	4	4
18	4	5	4	4
14	4	5	4	5
15	4	2	4	3
12	3	1	3	3
17	4	3	4	3
14	3	3	3	4
18	4	1	3	4
17	2	4	3	4
17	1	4	3	4
20	5	2	2	4
16	4	4	4	4
14	3	3	3	3
15	4	4	2	4
18	4	4	4	5
20	4	2	4	4
17	4	2	3	3
17	2	4	4	4
17	4	4	5	4
17	4	2	4	3
17	4	2	4	4
18	3	2	4	2
17	4	5	4	4
20	5	2	5	3
16	5	2	4	4
15	4	4	4	4
18	3	5	5	4
15	2	4	4	2
18	2	3	5	5
20	2	3	2	3
19	4	1	4	4
14	4	4	5	4
16	5	5	3	4
15	3	4	4	5
17	3	4	4	4
18	4	5	3	4
20	4	4	5	3
17	4	5	5	1
18	4	5	3	4
15	4	3	2	5
16	4	5	4	4
11	4	1	5	4
15	2	3	3	4
18	5	2	3	5
17	4	2	4	4
12	4	4	2	4
19	4	2	3	4
18	4	5	3	4
15	2	4	4	3
17	3	5	1	5
19	3	3	4	3
18	4	2	3	4
19	4	4	3	4
16	4	2	2	5
16	4	3	3	4
16	3	3	3	4
14	3	2	5	2


Summary of computational transaction
Raw Input view raw input (R code)
Raw Outputview raw output of R engine
Computing time9 seconds
R ServerBig Analytics Cloud Computing Center
R Framework error message
The field 'Names of X columns' contains a hard return which cannot be interpreted.
Please, resubmit your request without hard returns in the 'Names of X columns'.

\begin{tabular}{lllllllll}
\hline
Summary of computational transaction \tabularnewline
Raw Input view raw input (R code)  \tabularnewline
Raw Outputview raw output of R engine  \tabularnewline
Computing time9 seconds \tabularnewline
R ServerBig Analytics Cloud Computing Center \tabularnewline
R Framework error message & 
The field 'Names of X columns' contains a hard return which cannot be interpreted.
Please, resubmit your request without hard returns in the 'Names of X columns'.
\tabularnewline \hline \end{tabular} %Source: https://freestatistics.org/blog/index.php?pk=299335&T=0

[TABLE]
[ROW]
Summary of computational transaction[/C][/ROW] [ROW]Raw Input[/C] view raw input (R code) [/C][/ROW] [ROW]Raw Output[/C]view raw output of R engine [/C][/ROW] [ROW]Computing time[/C]9 seconds[/C][/ROW] [ROW]R Server[/C]Big Analytics Cloud Computing Center[/C][/ROW] [ROW]R Framework error message[/C][C]
The field 'Names of X columns' contains a hard return which cannot be interpreted.
Please, resubmit your request without hard returns in the 'Names of X columns'.
[/C][/ROW] [/TABLE] Source: https://freestatistics.org/blog/index.php?pk=299335&T=0

Globally Unique Identifier (entire table): ba.freestatistics.org/blog/index.php?pk=299335&T=0

As an alternative you can also use a QR Code:  

The GUIDs for individual cells are displayed in the table below:

Summary of computational transaction
Raw Input view raw input (R code)
Raw Outputview raw output of R engine
Computing time9 seconds
R ServerBig Analytics Cloud Computing Center
R Framework error message
The field 'Names of X columns' contains a hard return which cannot be interpreted.
Please, resubmit your request without hard returns in the 'Names of X columns'.


Multiple Linear Regression - Estimated Regression Equation
Som_Tevredenheid[t] = + 17.0083 + 0.249828IVHB1[t] -0.271285IVHB2[t] -0.254186IVHB3[t] + 0.120956`IVHB4\r`[t] + e[t]

\begin{tabular}{lllllllll}
\hline
Multiple Linear Regression - Estimated Regression Equation \tabularnewline
Som_Tevredenheid[t] =  +  17.0083 +  0.249828IVHB1[t] -0.271285IVHB2[t] -0.254186IVHB3[t] +  0.120956`IVHB4\r`[t]  + e[t] \tabularnewline
 \tabularnewline
\hline
\end{tabular}
%Source: https://freestatistics.org/blog/index.php?pk=299335&T=1

[TABLE]
[ROW][C]Multiple Linear Regression - Estimated Regression Equation[/C][/ROW]
[ROW][C]Som_Tevredenheid[t] =  +  17.0083 +  0.249828IVHB1[t] -0.271285IVHB2[t] -0.254186IVHB3[t] +  0.120956`IVHB4\r`[t]  + e[t][/C][/ROW]
[ROW][C][/C][/ROW]
[/TABLE]
Source: https://freestatistics.org/blog/index.php?pk=299335&T=1

Globally Unique Identifier (entire table): ba.freestatistics.org/blog/index.php?pk=299335&T=1

As an alternative you can also use a QR Code:  

The GUIDs for individual cells are displayed in the table below:

Multiple Linear Regression - Estimated Regression Equation
Som_Tevredenheid[t] = + 17.0083 + 0.249828IVHB1[t] -0.271285IVHB2[t] -0.254186IVHB3[t] + 0.120956`IVHB4\r`[t] + e[t]


Multiple Linear Regression - Ordinary Least Squares
VariableParameterS.D.T-STATH0: parameter = 02-tail p-value1-tail p-value
(Intercept)+17.01 1.438+1.1830e+01 3.881e-23 1.94e-23
IVHB1+0.2498 0.1903+1.3130e+00 0.1913 0.09567
IVHB2-0.2713 0.1725-1.5730e+00 0.1179 0.05894
IVHB3-0.2542 0.2013-1.2630e+00 0.2086 0.1043
`IVHB4\r`+0.121 0.2557+4.7290e-01 0.6369 0.3185

\begin{tabular}{lllllllll}
\hline
Multiple Linear Regression - Ordinary Least Squares \tabularnewline
Variable & Parameter & S.D. & T-STATH0: parameter = 0 & 2-tail p-value & 1-tail p-value \tabularnewline
(Intercept) & +17.01 &  1.438 & +1.1830e+01 &  3.881e-23 &  1.94e-23 \tabularnewline
IVHB1 & +0.2498 &  0.1903 & +1.3130e+00 &  0.1913 &  0.09567 \tabularnewline
IVHB2 & -0.2713 &  0.1725 & -1.5730e+00 &  0.1179 &  0.05894 \tabularnewline
IVHB3 & -0.2542 &  0.2013 & -1.2630e+00 &  0.2086 &  0.1043 \tabularnewline
`IVHB4\r` & +0.121 &  0.2557 & +4.7290e-01 &  0.6369 &  0.3185 \tabularnewline
\hline
\end{tabular}
%Source: https://freestatistics.org/blog/index.php?pk=299335&T=2

[TABLE]
[ROW][C]Multiple Linear Regression - Ordinary Least Squares[/C][/ROW]
[ROW][C]Variable[/C][C]Parameter[/C][C]S.D.[/C][C]T-STATH0: parameter = 0[/C][C]2-tail p-value[/C][C]1-tail p-value[/C][/ROW]
[ROW][C](Intercept)[/C][C]+17.01[/C][C] 1.438[/C][C]+1.1830e+01[/C][C] 3.881e-23[/C][C] 1.94e-23[/C][/ROW]
[ROW][C]IVHB1[/C][C]+0.2498[/C][C] 0.1903[/C][C]+1.3130e+00[/C][C] 0.1913[/C][C] 0.09567[/C][/ROW]
[ROW][C]IVHB2[/C][C]-0.2713[/C][C] 0.1725[/C][C]-1.5730e+00[/C][C] 0.1179[/C][C] 0.05894[/C][/ROW]
[ROW][C]IVHB3[/C][C]-0.2542[/C][C] 0.2013[/C][C]-1.2630e+00[/C][C] 0.2086[/C][C] 0.1043[/C][/ROW]
[ROW][C]`IVHB4\r`[/C][C]+0.121[/C][C] 0.2557[/C][C]+4.7290e-01[/C][C] 0.6369[/C][C] 0.3185[/C][/ROW]
[/TABLE]
Source: https://freestatistics.org/blog/index.php?pk=299335&T=2

Globally Unique Identifier (entire table): ba.freestatistics.org/blog/index.php?pk=299335&T=2

As an alternative you can also use a QR Code:  

The GUIDs for individual cells are displayed in the table below:

Multiple Linear Regression - Ordinary Least Squares
VariableParameterS.D.T-STATH0: parameter = 02-tail p-value1-tail p-value
(Intercept)+17.01 1.438+1.1830e+01 3.881e-23 1.94e-23
IVHB1+0.2498 0.1903+1.3130e+00 0.1913 0.09567
IVHB2-0.2713 0.1725-1.5730e+00 0.1179 0.05894
IVHB3-0.2542 0.2013-1.2630e+00 0.2086 0.1043
`IVHB4\r`+0.121 0.2557+4.7290e-01 0.6369 0.3185


Multiple Linear Regression - Regression Statistics
Multiple R 0.195
R-squared 0.03804
Adjusted R-squared 0.01204
F-TEST (value) 1.463
F-TEST (DF numerator)4
F-TEST (DF denominator)148
p-value 0.2163
Multiple Linear Regression - Residual Statistics
Residual Standard Deviation 2.332
Sum Squared Residuals 805

\begin{tabular}{lllllllll}
\hline
Multiple Linear Regression - Regression Statistics \tabularnewline
Multiple R &  0.195 \tabularnewline
R-squared &  0.03804 \tabularnewline
Adjusted R-squared &  0.01204 \tabularnewline
F-TEST (value) &  1.463 \tabularnewline
F-TEST (DF numerator) & 4 \tabularnewline
F-TEST (DF denominator) & 148 \tabularnewline
p-value &  0.2163 \tabularnewline
Multiple Linear Regression - Residual Statistics \tabularnewline
Residual Standard Deviation &  2.332 \tabularnewline
Sum Squared Residuals &  805 \tabularnewline
\hline
\end{tabular}
%Source: https://freestatistics.org/blog/index.php?pk=299335&T=3

[TABLE]
[ROW][C]Multiple Linear Regression - Regression Statistics[/C][/ROW]
[ROW][C]Multiple R[/C][C] 0.195[/C][/ROW]
[ROW][C]R-squared[/C][C] 0.03804[/C][/ROW]
[ROW][C]Adjusted R-squared[/C][C] 0.01204[/C][/ROW]
[ROW][C]F-TEST (value)[/C][C] 1.463[/C][/ROW]
[ROW][C]F-TEST (DF numerator)[/C][C]4[/C][/ROW]
[ROW][C]F-TEST (DF denominator)[/C][C]148[/C][/ROW]
[ROW][C]p-value[/C][C] 0.2163[/C][/ROW]
[ROW][C]Multiple Linear Regression - Residual Statistics[/C][/ROW]
[ROW][C]Residual Standard Deviation[/C][C] 2.332[/C][/ROW]
[ROW][C]Sum Squared Residuals[/C][C] 805[/C][/ROW]
[/TABLE]
Source: https://freestatistics.org/blog/index.php?pk=299335&T=3

Globally Unique Identifier (entire table): ba.freestatistics.org/blog/index.php?pk=299335&T=3

As an alternative you can also use a QR Code:  

The GUIDs for individual cells are displayed in the table below:

Multiple Linear Regression - Regression Statistics
Multiple R 0.195
R-squared 0.03804
Adjusted R-squared 0.01204
F-TEST (value) 1.463
F-TEST (DF numerator)4
F-TEST (DF denominator)148
p-value 0.2163
Multiple Linear Regression - Residual Statistics
Residual Standard Deviation 2.332
Sum Squared Residuals 805


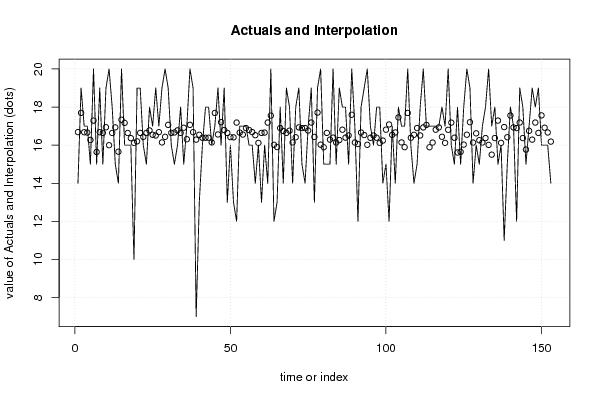
Multiple Linear Regression - Actuals, Interpolation, and Residuals
Time or IndexActualsInterpolationForecastResidualsPrediction Error
1 14 16.69-2.687
2 19 17.69 1.305
3 17 16.68 0.3221
4 17 16.66 0.3392
5 15 16.27-1.273
6 20 17.29 2.71
7 15 15.64-0.6401
8 19 16.68 2.322
9 15 16.64-1.644
10 19 16.94 2.059
11 20 16 4.003
12 18 16.64 1.361
13 15 16.93-1.932
14 14 15.66-1.657
15 20 17.33 2.667
16 16 17.17-1.169
17 16 16.64-0.6394
18 16 16.37-0.3681
19 10 16.12-6.118
20 19 16.2 2.8
21 19 16.64 2.356
22 16 16.43-0.4325
23 15 16.64-1.644
24 18 16.77 1.227
25 17 16.54 0.4558
26 19 16.51 2.494
27 17 16.68 0.3177
28 19 16.14 2.856
29 20 16.44 3.563
30 19 17.07 1.935
31 16 16.64-0.6437
32 15 16.67-1.665
33 16 16.78-0.7774
34 18 16.64 1.356
35 15 16.91-1.915
36 17 16.31 0.6885
37 20 17.07 2.934
38 19 16.68 2.318
39 7 16.29-9.29
40 13 16.54-3.544
41 16 16.39-0.3896
42 18 16.39 1.61
43 18 16.39 1.61
44 16 16.14-0.1441
45 17 17.69-0.6903
46 19 16.56 2.439
47 16 17.21-1.208
48 19 16.79 2.206
49 13 16.64-3.644
50 16 16.42-0.4189
51 13 16.41-3.411
52 12 17.19-5.186
53 17 16.66 0.3392
54 17 16.56 0.443
55 17 16.9 0.1021
56 16 16.79-0.7941
57 16 16.69-0.6867
58 14 16.52-2.523
59 16 16.12-0.1183
60 13 16.64-3.644
61 16 16.66-0.6608
62 14 17.19-3.186
63 20 17.55 2.448
64 12 16.02-4.019
65 13 15.9-2.902
66 18 16.9 1.102
67 14 16.74-2.743
68 19 16.64 2.356
69 18 16.76 1.24
70 14 16.14-2.143
71 18 16.42 1.585
72 19 16.93 2.068
73 15 16.9-1.898
74 14 16.9-2.898
75 17 16.77 0.2309
76 19 17.19 1.814
77 13 16.43-3.432
78 19 17.71 1.293
79 20 16.03 3.973
80 15 15.89-0.8899
81 15 16.64-1.644
82 15 16.29-1.29
83 20 16.39 3.606
84 15 16.14-1.135
85 19 16.27 2.731
86 18 16.81 1.189
87 18 16.39 1.606
88 15 16.51-1.511
89 20 17.6 2.405
90 17 16.14 0.8603
91 12 16.06-4.062
92 18 16.66 1.339
93 19 16.53 2.468
94 20 16.02 3.981
95 17 16.39 0.6148
96 16 16.51-0.5062
97 18 16.39 1.61
98 18 16.12 1.882
99 14 16.24-2.239
100 15 16.81-1.811
101 12 17.09-5.087
102 17 16.54 0.4601
103 14 16.67-2.665
104 18 17.46 0.5424
105 17 16.14 0.8559
106 17 15.89 1.106
107 20 17.69 2.31
108 16 16.39-0.3896
109 14 16.54-2.544
110 15 16.9-1.898
111 18 16.51 1.489
112 20 16.93 3.068
113 17 17.07-0.06536
114 17 15.89 1.11
115 17 16.14 0.8646
116 17 16.81 0.1888
117 17 16.93 0.06787
118 18 16.44 1.56
119 17 16.12 0.8817
120 20 16.81 3.193
121 16 17.18-1.182
122 15 16.39-1.39
123 18 15.61 2.386
124 15 15.65-0.648
125 18 16.03 1.972
126 20 16.55 3.451
127 19 17.2 1.797
128 14 16.14-2.135
129 16 16.62-0.6223
130 15 16.26-1.261
131 17 16.14 0.8603
132 18 16.37 1.628
133 20 16.01 3.986
134 17 15.5 1.499
135 18 16.37 1.628
136 15 17.29-2.29
137 16 16.12-0.1183
138 11 16.95-5.949
139 15 16.42-1.415
140 18 17.56 0.4429
141 17 16.93 0.06787
142 12 16.9-4.898
143 19 17.19 1.814
144 18 16.37 1.628
145 15 15.77-0.7689
146 17 16.75 0.248
147 19 16.29 2.71
148 18 17.19 0.8137
149 19 16.64 2.356
150 16 17.56-1.561
151 16 16.91-0.915
152 16 16.67-0.6652
153 14 16.19-2.186

\begin{tabular}{lllllllll}
\hline
Multiple Linear Regression - Actuals, Interpolation, and Residuals \tabularnewline
Time or Index & Actuals & InterpolationForecast & ResidualsPrediction Error \tabularnewline
1 &  14 &  16.69 & -2.687 \tabularnewline
2 &  19 &  17.69 &  1.305 \tabularnewline
3 &  17 &  16.68 &  0.3221 \tabularnewline
4 &  17 &  16.66 &  0.3392 \tabularnewline
5 &  15 &  16.27 & -1.273 \tabularnewline
6 &  20 &  17.29 &  2.71 \tabularnewline
7 &  15 &  15.64 & -0.6401 \tabularnewline
8 &  19 &  16.68 &  2.322 \tabularnewline
9 &  15 &  16.64 & -1.644 \tabularnewline
10 &  19 &  16.94 &  2.059 \tabularnewline
11 &  20 &  16 &  4.003 \tabularnewline
12 &  18 &  16.64 &  1.361 \tabularnewline
13 &  15 &  16.93 & -1.932 \tabularnewline
14 &  14 &  15.66 & -1.657 \tabularnewline
15 &  20 &  17.33 &  2.667 \tabularnewline
16 &  16 &  17.17 & -1.169 \tabularnewline
17 &  16 &  16.64 & -0.6394 \tabularnewline
18 &  16 &  16.37 & -0.3681 \tabularnewline
19 &  10 &  16.12 & -6.118 \tabularnewline
20 &  19 &  16.2 &  2.8 \tabularnewline
21 &  19 &  16.64 &  2.356 \tabularnewline
22 &  16 &  16.43 & -0.4325 \tabularnewline
23 &  15 &  16.64 & -1.644 \tabularnewline
24 &  18 &  16.77 &  1.227 \tabularnewline
25 &  17 &  16.54 &  0.4558 \tabularnewline
26 &  19 &  16.51 &  2.494 \tabularnewline
27 &  17 &  16.68 &  0.3177 \tabularnewline
28 &  19 &  16.14 &  2.856 \tabularnewline
29 &  20 &  16.44 &  3.563 \tabularnewline
30 &  19 &  17.07 &  1.935 \tabularnewline
31 &  16 &  16.64 & -0.6437 \tabularnewline
32 &  15 &  16.67 & -1.665 \tabularnewline
33 &  16 &  16.78 & -0.7774 \tabularnewline
34 &  18 &  16.64 &  1.356 \tabularnewline
35 &  15 &  16.91 & -1.915 \tabularnewline
36 &  17 &  16.31 &  0.6885 \tabularnewline
37 &  20 &  17.07 &  2.934 \tabularnewline
38 &  19 &  16.68 &  2.318 \tabularnewline
39 &  7 &  16.29 & -9.29 \tabularnewline
40 &  13 &  16.54 & -3.544 \tabularnewline
41 &  16 &  16.39 & -0.3896 \tabularnewline
42 &  18 &  16.39 &  1.61 \tabularnewline
43 &  18 &  16.39 &  1.61 \tabularnewline
44 &  16 &  16.14 & -0.1441 \tabularnewline
45 &  17 &  17.69 & -0.6903 \tabularnewline
46 &  19 &  16.56 &  2.439 \tabularnewline
47 &  16 &  17.21 & -1.208 \tabularnewline
48 &  19 &  16.79 &  2.206 \tabularnewline
49 &  13 &  16.64 & -3.644 \tabularnewline
50 &  16 &  16.42 & -0.4189 \tabularnewline
51 &  13 &  16.41 & -3.411 \tabularnewline
52 &  12 &  17.19 & -5.186 \tabularnewline
53 &  17 &  16.66 &  0.3392 \tabularnewline
54 &  17 &  16.56 &  0.443 \tabularnewline
55 &  17 &  16.9 &  0.1021 \tabularnewline
56 &  16 &  16.79 & -0.7941 \tabularnewline
57 &  16 &  16.69 & -0.6867 \tabularnewline
58 &  14 &  16.52 & -2.523 \tabularnewline
59 &  16 &  16.12 & -0.1183 \tabularnewline
60 &  13 &  16.64 & -3.644 \tabularnewline
61 &  16 &  16.66 & -0.6608 \tabularnewline
62 &  14 &  17.19 & -3.186 \tabularnewline
63 &  20 &  17.55 &  2.448 \tabularnewline
64 &  12 &  16.02 & -4.019 \tabularnewline
65 &  13 &  15.9 & -2.902 \tabularnewline
66 &  18 &  16.9 &  1.102 \tabularnewline
67 &  14 &  16.74 & -2.743 \tabularnewline
68 &  19 &  16.64 &  2.356 \tabularnewline
69 &  18 &  16.76 &  1.24 \tabularnewline
70 &  14 &  16.14 & -2.143 \tabularnewline
71 &  18 &  16.42 &  1.585 \tabularnewline
72 &  19 &  16.93 &  2.068 \tabularnewline
73 &  15 &  16.9 & -1.898 \tabularnewline
74 &  14 &  16.9 & -2.898 \tabularnewline
75 &  17 &  16.77 &  0.2309 \tabularnewline
76 &  19 &  17.19 &  1.814 \tabularnewline
77 &  13 &  16.43 & -3.432 \tabularnewline
78 &  19 &  17.71 &  1.293 \tabularnewline
79 &  20 &  16.03 &  3.973 \tabularnewline
80 &  15 &  15.89 & -0.8899 \tabularnewline
81 &  15 &  16.64 & -1.644 \tabularnewline
82 &  15 &  16.29 & -1.29 \tabularnewline
83 &  20 &  16.39 &  3.606 \tabularnewline
84 &  15 &  16.14 & -1.135 \tabularnewline
85 &  19 &  16.27 &  2.731 \tabularnewline
86 &  18 &  16.81 &  1.189 \tabularnewline
87 &  18 &  16.39 &  1.606 \tabularnewline
88 &  15 &  16.51 & -1.511 \tabularnewline
89 &  20 &  17.6 &  2.405 \tabularnewline
90 &  17 &  16.14 &  0.8603 \tabularnewline
91 &  12 &  16.06 & -4.062 \tabularnewline
92 &  18 &  16.66 &  1.339 \tabularnewline
93 &  19 &  16.53 &  2.468 \tabularnewline
94 &  20 &  16.02 &  3.981 \tabularnewline
95 &  17 &  16.39 &  0.6148 \tabularnewline
96 &  16 &  16.51 & -0.5062 \tabularnewline
97 &  18 &  16.39 &  1.61 \tabularnewline
98 &  18 &  16.12 &  1.882 \tabularnewline
99 &  14 &  16.24 & -2.239 \tabularnewline
100 &  15 &  16.81 & -1.811 \tabularnewline
101 &  12 &  17.09 & -5.087 \tabularnewline
102 &  17 &  16.54 &  0.4601 \tabularnewline
103 &  14 &  16.67 & -2.665 \tabularnewline
104 &  18 &  17.46 &  0.5424 \tabularnewline
105 &  17 &  16.14 &  0.8559 \tabularnewline
106 &  17 &  15.89 &  1.106 \tabularnewline
107 &  20 &  17.69 &  2.31 \tabularnewline
108 &  16 &  16.39 & -0.3896 \tabularnewline
109 &  14 &  16.54 & -2.544 \tabularnewline
110 &  15 &  16.9 & -1.898 \tabularnewline
111 &  18 &  16.51 &  1.489 \tabularnewline
112 &  20 &  16.93 &  3.068 \tabularnewline
113 &  17 &  17.07 & -0.06536 \tabularnewline
114 &  17 &  15.89 &  1.11 \tabularnewline
115 &  17 &  16.14 &  0.8646 \tabularnewline
116 &  17 &  16.81 &  0.1888 \tabularnewline
117 &  17 &  16.93 &  0.06787 \tabularnewline
118 &  18 &  16.44 &  1.56 \tabularnewline
119 &  17 &  16.12 &  0.8817 \tabularnewline
120 &  20 &  16.81 &  3.193 \tabularnewline
121 &  16 &  17.18 & -1.182 \tabularnewline
122 &  15 &  16.39 & -1.39 \tabularnewline
123 &  18 &  15.61 &  2.386 \tabularnewline
124 &  15 &  15.65 & -0.648 \tabularnewline
125 &  18 &  16.03 &  1.972 \tabularnewline
126 &  20 &  16.55 &  3.451 \tabularnewline
127 &  19 &  17.2 &  1.797 \tabularnewline
128 &  14 &  16.14 & -2.135 \tabularnewline
129 &  16 &  16.62 & -0.6223 \tabularnewline
130 &  15 &  16.26 & -1.261 \tabularnewline
131 &  17 &  16.14 &  0.8603 \tabularnewline
132 &  18 &  16.37 &  1.628 \tabularnewline
133 &  20 &  16.01 &  3.986 \tabularnewline
134 &  17 &  15.5 &  1.499 \tabularnewline
135 &  18 &  16.37 &  1.628 \tabularnewline
136 &  15 &  17.29 & -2.29 \tabularnewline
137 &  16 &  16.12 & -0.1183 \tabularnewline
138 &  11 &  16.95 & -5.949 \tabularnewline
139 &  15 &  16.42 & -1.415 \tabularnewline
140 &  18 &  17.56 &  0.4429 \tabularnewline
141 &  17 &  16.93 &  0.06787 \tabularnewline
142 &  12 &  16.9 & -4.898 \tabularnewline
143 &  19 &  17.19 &  1.814 \tabularnewline
144 &  18 &  16.37 &  1.628 \tabularnewline
145 &  15 &  15.77 & -0.7689 \tabularnewline
146 &  17 &  16.75 &  0.248 \tabularnewline
147 &  19 &  16.29 &  2.71 \tabularnewline
148 &  18 &  17.19 &  0.8137 \tabularnewline
149 &  19 &  16.64 &  2.356 \tabularnewline
150 &  16 &  17.56 & -1.561 \tabularnewline
151 &  16 &  16.91 & -0.915 \tabularnewline
152 &  16 &  16.67 & -0.6652 \tabularnewline
153 &  14 &  16.19 & -2.186 \tabularnewline
\hline
\end{tabular}
%Source: https://freestatistics.org/blog/index.php?pk=299335&T=4

[TABLE]
[ROW][C]Multiple Linear Regression - Actuals, Interpolation, and Residuals[/C][/ROW]
[ROW][C]Time or Index[/C][C]Actuals[/C][C]InterpolationForecast[/C][C]ResidualsPrediction Error[/C][/ROW]
[ROW][C]1[/C][C] 14[/C][C] 16.69[/C][C]-2.687[/C][/ROW]
[ROW][C]2[/C][C] 19[/C][C] 17.69[/C][C] 1.305[/C][/ROW]
[ROW][C]3[/C][C] 17[/C][C] 16.68[/C][C] 0.3221[/C][/ROW]
[ROW][C]4[/C][C] 17[/C][C] 16.66[/C][C] 0.3392[/C][/ROW]
[ROW][C]5[/C][C] 15[/C][C] 16.27[/C][C]-1.273[/C][/ROW]
[ROW][C]6[/C][C] 20[/C][C] 17.29[/C][C] 2.71[/C][/ROW]
[ROW][C]7[/C][C] 15[/C][C] 15.64[/C][C]-0.6401[/C][/ROW]
[ROW][C]8[/C][C] 19[/C][C] 16.68[/C][C] 2.322[/C][/ROW]
[ROW][C]9[/C][C] 15[/C][C] 16.64[/C][C]-1.644[/C][/ROW]
[ROW][C]10[/C][C] 19[/C][C] 16.94[/C][C] 2.059[/C][/ROW]
[ROW][C]11[/C][C] 20[/C][C] 16[/C][C] 4.003[/C][/ROW]
[ROW][C]12[/C][C] 18[/C][C] 16.64[/C][C] 1.361[/C][/ROW]
[ROW][C]13[/C][C] 15[/C][C] 16.93[/C][C]-1.932[/C][/ROW]
[ROW][C]14[/C][C] 14[/C][C] 15.66[/C][C]-1.657[/C][/ROW]
[ROW][C]15[/C][C] 20[/C][C] 17.33[/C][C] 2.667[/C][/ROW]
[ROW][C]16[/C][C] 16[/C][C] 17.17[/C][C]-1.169[/C][/ROW]
[ROW][C]17[/C][C] 16[/C][C] 16.64[/C][C]-0.6394[/C][/ROW]
[ROW][C]18[/C][C] 16[/C][C] 16.37[/C][C]-0.3681[/C][/ROW]
[ROW][C]19[/C][C] 10[/C][C] 16.12[/C][C]-6.118[/C][/ROW]
[ROW][C]20[/C][C] 19[/C][C] 16.2[/C][C] 2.8[/C][/ROW]
[ROW][C]21[/C][C] 19[/C][C] 16.64[/C][C] 2.356[/C][/ROW]
[ROW][C]22[/C][C] 16[/C][C] 16.43[/C][C]-0.4325[/C][/ROW]
[ROW][C]23[/C][C] 15[/C][C] 16.64[/C][C]-1.644[/C][/ROW]
[ROW][C]24[/C][C] 18[/C][C] 16.77[/C][C] 1.227[/C][/ROW]
[ROW][C]25[/C][C] 17[/C][C] 16.54[/C][C] 0.4558[/C][/ROW]
[ROW][C]26[/C][C] 19[/C][C] 16.51[/C][C] 2.494[/C][/ROW]
[ROW][C]27[/C][C] 17[/C][C] 16.68[/C][C] 0.3177[/C][/ROW]
[ROW][C]28[/C][C] 19[/C][C] 16.14[/C][C] 2.856[/C][/ROW]
[ROW][C]29[/C][C] 20[/C][C] 16.44[/C][C] 3.563[/C][/ROW]
[ROW][C]30[/C][C] 19[/C][C] 17.07[/C][C] 1.935[/C][/ROW]
[ROW][C]31[/C][C] 16[/C][C] 16.64[/C][C]-0.6437[/C][/ROW]
[ROW][C]32[/C][C] 15[/C][C] 16.67[/C][C]-1.665[/C][/ROW]
[ROW][C]33[/C][C] 16[/C][C] 16.78[/C][C]-0.7774[/C][/ROW]
[ROW][C]34[/C][C] 18[/C][C] 16.64[/C][C] 1.356[/C][/ROW]
[ROW][C]35[/C][C] 15[/C][C] 16.91[/C][C]-1.915[/C][/ROW]
[ROW][C]36[/C][C] 17[/C][C] 16.31[/C][C] 0.6885[/C][/ROW]
[ROW][C]37[/C][C] 20[/C][C] 17.07[/C][C] 2.934[/C][/ROW]
[ROW][C]38[/C][C] 19[/C][C] 16.68[/C][C] 2.318[/C][/ROW]
[ROW][C]39[/C][C] 7[/C][C] 16.29[/C][C]-9.29[/C][/ROW]
[ROW][C]40[/C][C] 13[/C][C] 16.54[/C][C]-3.544[/C][/ROW]
[ROW][C]41[/C][C] 16[/C][C] 16.39[/C][C]-0.3896[/C][/ROW]
[ROW][C]42[/C][C] 18[/C][C] 16.39[/C][C] 1.61[/C][/ROW]
[ROW][C]43[/C][C] 18[/C][C] 16.39[/C][C] 1.61[/C][/ROW]
[ROW][C]44[/C][C] 16[/C][C] 16.14[/C][C]-0.1441[/C][/ROW]
[ROW][C]45[/C][C] 17[/C][C] 17.69[/C][C]-0.6903[/C][/ROW]
[ROW][C]46[/C][C] 19[/C][C] 16.56[/C][C] 2.439[/C][/ROW]
[ROW][C]47[/C][C] 16[/C][C] 17.21[/C][C]-1.208[/C][/ROW]
[ROW][C]48[/C][C] 19[/C][C] 16.79[/C][C] 2.206[/C][/ROW]
[ROW][C]49[/C][C] 13[/C][C] 16.64[/C][C]-3.644[/C][/ROW]
[ROW][C]50[/C][C] 16[/C][C] 16.42[/C][C]-0.4189[/C][/ROW]
[ROW][C]51[/C][C] 13[/C][C] 16.41[/C][C]-3.411[/C][/ROW]
[ROW][C]52[/C][C] 12[/C][C] 17.19[/C][C]-5.186[/C][/ROW]
[ROW][C]53[/C][C] 17[/C][C] 16.66[/C][C] 0.3392[/C][/ROW]
[ROW][C]54[/C][C] 17[/C][C] 16.56[/C][C] 0.443[/C][/ROW]
[ROW][C]55[/C][C] 17[/C][C] 16.9[/C][C] 0.1021[/C][/ROW]
[ROW][C]56[/C][C] 16[/C][C] 16.79[/C][C]-0.7941[/C][/ROW]
[ROW][C]57[/C][C] 16[/C][C] 16.69[/C][C]-0.6867[/C][/ROW]
[ROW][C]58[/C][C] 14[/C][C] 16.52[/C][C]-2.523[/C][/ROW]
[ROW][C]59[/C][C] 16[/C][C] 16.12[/C][C]-0.1183[/C][/ROW]
[ROW][C]60[/C][C] 13[/C][C] 16.64[/C][C]-3.644[/C][/ROW]
[ROW][C]61[/C][C] 16[/C][C] 16.66[/C][C]-0.6608[/C][/ROW]
[ROW][C]62[/C][C] 14[/C][C] 17.19[/C][C]-3.186[/C][/ROW]
[ROW][C]63[/C][C] 20[/C][C] 17.55[/C][C] 2.448[/C][/ROW]
[ROW][C]64[/C][C] 12[/C][C] 16.02[/C][C]-4.019[/C][/ROW]
[ROW][C]65[/C][C] 13[/C][C] 15.9[/C][C]-2.902[/C][/ROW]
[ROW][C]66[/C][C] 18[/C][C] 16.9[/C][C] 1.102[/C][/ROW]
[ROW][C]67[/C][C] 14[/C][C] 16.74[/C][C]-2.743[/C][/ROW]
[ROW][C]68[/C][C] 19[/C][C] 16.64[/C][C] 2.356[/C][/ROW]
[ROW][C]69[/C][C] 18[/C][C] 16.76[/C][C] 1.24[/C][/ROW]
[ROW][C]70[/C][C] 14[/C][C] 16.14[/C][C]-2.143[/C][/ROW]
[ROW][C]71[/C][C] 18[/C][C] 16.42[/C][C] 1.585[/C][/ROW]
[ROW][C]72[/C][C] 19[/C][C] 16.93[/C][C] 2.068[/C][/ROW]
[ROW][C]73[/C][C] 15[/C][C] 16.9[/C][C]-1.898[/C][/ROW]
[ROW][C]74[/C][C] 14[/C][C] 16.9[/C][C]-2.898[/C][/ROW]
[ROW][C]75[/C][C] 17[/C][C] 16.77[/C][C] 0.2309[/C][/ROW]
[ROW][C]76[/C][C] 19[/C][C] 17.19[/C][C] 1.814[/C][/ROW]
[ROW][C]77[/C][C] 13[/C][C] 16.43[/C][C]-3.432[/C][/ROW]
[ROW][C]78[/C][C] 19[/C][C] 17.71[/C][C] 1.293[/C][/ROW]
[ROW][C]79[/C][C] 20[/C][C] 16.03[/C][C] 3.973[/C][/ROW]
[ROW][C]80[/C][C] 15[/C][C] 15.89[/C][C]-0.8899[/C][/ROW]
[ROW][C]81[/C][C] 15[/C][C] 16.64[/C][C]-1.644[/C][/ROW]
[ROW][C]82[/C][C] 15[/C][C] 16.29[/C][C]-1.29[/C][/ROW]
[ROW][C]83[/C][C] 20[/C][C] 16.39[/C][C] 3.606[/C][/ROW]
[ROW][C]84[/C][C] 15[/C][C] 16.14[/C][C]-1.135[/C][/ROW]
[ROW][C]85[/C][C] 19[/C][C] 16.27[/C][C] 2.731[/C][/ROW]
[ROW][C]86[/C][C] 18[/C][C] 16.81[/C][C] 1.189[/C][/ROW]
[ROW][C]87[/C][C] 18[/C][C] 16.39[/C][C] 1.606[/C][/ROW]
[ROW][C]88[/C][C] 15[/C][C] 16.51[/C][C]-1.511[/C][/ROW]
[ROW][C]89[/C][C] 20[/C][C] 17.6[/C][C] 2.405[/C][/ROW]
[ROW][C]90[/C][C] 17[/C][C] 16.14[/C][C] 0.8603[/C][/ROW]
[ROW][C]91[/C][C] 12[/C][C] 16.06[/C][C]-4.062[/C][/ROW]
[ROW][C]92[/C][C] 18[/C][C] 16.66[/C][C] 1.339[/C][/ROW]
[ROW][C]93[/C][C] 19[/C][C] 16.53[/C][C] 2.468[/C][/ROW]
[ROW][C]94[/C][C] 20[/C][C] 16.02[/C][C] 3.981[/C][/ROW]
[ROW][C]95[/C][C] 17[/C][C] 16.39[/C][C] 0.6148[/C][/ROW]
[ROW][C]96[/C][C] 16[/C][C] 16.51[/C][C]-0.5062[/C][/ROW]
[ROW][C]97[/C][C] 18[/C][C] 16.39[/C][C] 1.61[/C][/ROW]
[ROW][C]98[/C][C] 18[/C][C] 16.12[/C][C] 1.882[/C][/ROW]
[ROW][C]99[/C][C] 14[/C][C] 16.24[/C][C]-2.239[/C][/ROW]
[ROW][C]100[/C][C] 15[/C][C] 16.81[/C][C]-1.811[/C][/ROW]
[ROW][C]101[/C][C] 12[/C][C] 17.09[/C][C]-5.087[/C][/ROW]
[ROW][C]102[/C][C] 17[/C][C] 16.54[/C][C] 0.4601[/C][/ROW]
[ROW][C]103[/C][C] 14[/C][C] 16.67[/C][C]-2.665[/C][/ROW]
[ROW][C]104[/C][C] 18[/C][C] 17.46[/C][C] 0.5424[/C][/ROW]
[ROW][C]105[/C][C] 17[/C][C] 16.14[/C][C] 0.8559[/C][/ROW]
[ROW][C]106[/C][C] 17[/C][C] 15.89[/C][C] 1.106[/C][/ROW]
[ROW][C]107[/C][C] 20[/C][C] 17.69[/C][C] 2.31[/C][/ROW]
[ROW][C]108[/C][C] 16[/C][C] 16.39[/C][C]-0.3896[/C][/ROW]
[ROW][C]109[/C][C] 14[/C][C] 16.54[/C][C]-2.544[/C][/ROW]
[ROW][C]110[/C][C] 15[/C][C] 16.9[/C][C]-1.898[/C][/ROW]
[ROW][C]111[/C][C] 18[/C][C] 16.51[/C][C] 1.489[/C][/ROW]
[ROW][C]112[/C][C] 20[/C][C] 16.93[/C][C] 3.068[/C][/ROW]
[ROW][C]113[/C][C] 17[/C][C] 17.07[/C][C]-0.06536[/C][/ROW]
[ROW][C]114[/C][C] 17[/C][C] 15.89[/C][C] 1.11[/C][/ROW]
[ROW][C]115[/C][C] 17[/C][C] 16.14[/C][C] 0.8646[/C][/ROW]
[ROW][C]116[/C][C] 17[/C][C] 16.81[/C][C] 0.1888[/C][/ROW]
[ROW][C]117[/C][C] 17[/C][C] 16.93[/C][C] 0.06787[/C][/ROW]
[ROW][C]118[/C][C] 18[/C][C] 16.44[/C][C] 1.56[/C][/ROW]
[ROW][C]119[/C][C] 17[/C][C] 16.12[/C][C] 0.8817[/C][/ROW]
[ROW][C]120[/C][C] 20[/C][C] 16.81[/C][C] 3.193[/C][/ROW]
[ROW][C]121[/C][C] 16[/C][C] 17.18[/C][C]-1.182[/C][/ROW]
[ROW][C]122[/C][C] 15[/C][C] 16.39[/C][C]-1.39[/C][/ROW]
[ROW][C]123[/C][C] 18[/C][C] 15.61[/C][C] 2.386[/C][/ROW]
[ROW][C]124[/C][C] 15[/C][C] 15.65[/C][C]-0.648[/C][/ROW]
[ROW][C]125[/C][C] 18[/C][C] 16.03[/C][C] 1.972[/C][/ROW]
[ROW][C]126[/C][C] 20[/C][C] 16.55[/C][C] 3.451[/C][/ROW]
[ROW][C]127[/C][C] 19[/C][C] 17.2[/C][C] 1.797[/C][/ROW]
[ROW][C]128[/C][C] 14[/C][C] 16.14[/C][C]-2.135[/C][/ROW]
[ROW][C]129[/C][C] 16[/C][C] 16.62[/C][C]-0.6223[/C][/ROW]
[ROW][C]130[/C][C] 15[/C][C] 16.26[/C][C]-1.261[/C][/ROW]
[ROW][C]131[/C][C] 17[/C][C] 16.14[/C][C] 0.8603[/C][/ROW]
[ROW][C]132[/C][C] 18[/C][C] 16.37[/C][C] 1.628[/C][/ROW]
[ROW][C]133[/C][C] 20[/C][C] 16.01[/C][C] 3.986[/C][/ROW]
[ROW][C]134[/C][C] 17[/C][C] 15.5[/C][C] 1.499[/C][/ROW]
[ROW][C]135[/C][C] 18[/C][C] 16.37[/C][C] 1.628[/C][/ROW]
[ROW][C]136[/C][C] 15[/C][C] 17.29[/C][C]-2.29[/C][/ROW]
[ROW][C]137[/C][C] 16[/C][C] 16.12[/C][C]-0.1183[/C][/ROW]
[ROW][C]138[/C][C] 11[/C][C] 16.95[/C][C]-5.949[/C][/ROW]
[ROW][C]139[/C][C] 15[/C][C] 16.42[/C][C]-1.415[/C][/ROW]
[ROW][C]140[/C][C] 18[/C][C] 17.56[/C][C] 0.4429[/C][/ROW]
[ROW][C]141[/C][C] 17[/C][C] 16.93[/C][C] 0.06787[/C][/ROW]
[ROW][C]142[/C][C] 12[/C][C] 16.9[/C][C]-4.898[/C][/ROW]
[ROW][C]143[/C][C] 19[/C][C] 17.19[/C][C] 1.814[/C][/ROW]
[ROW][C]144[/C][C] 18[/C][C] 16.37[/C][C] 1.628[/C][/ROW]
[ROW][C]145[/C][C] 15[/C][C] 15.77[/C][C]-0.7689[/C][/ROW]
[ROW][C]146[/C][C] 17[/C][C] 16.75[/C][C] 0.248[/C][/ROW]
[ROW][C]147[/C][C] 19[/C][C] 16.29[/C][C] 2.71[/C][/ROW]
[ROW][C]148[/C][C] 18[/C][C] 17.19[/C][C] 0.8137[/C][/ROW]
[ROW][C]149[/C][C] 19[/C][C] 16.64[/C][C] 2.356[/C][/ROW]
[ROW][C]150[/C][C] 16[/C][C] 17.56[/C][C]-1.561[/C][/ROW]
[ROW][C]151[/C][C] 16[/C][C] 16.91[/C][C]-0.915[/C][/ROW]
[ROW][C]152[/C][C] 16[/C][C] 16.67[/C][C]-0.6652[/C][/ROW]
[ROW][C]153[/C][C] 14[/C][C] 16.19[/C][C]-2.186[/C][/ROW]
[/TABLE]
Source: https://freestatistics.org/blog/index.php?pk=299335&T=4

Globally Unique Identifier (entire table): ba.freestatistics.org/blog/index.php?pk=299335&T=4

As an alternative you can also use a QR Code:  

The GUIDs for individual cells are displayed in the table below:

Multiple Linear Regression - Actuals, Interpolation, and Residuals
Time or IndexActualsInterpolationForecastResidualsPrediction Error
1 14 16.69-2.687
2 19 17.69 1.305
3 17 16.68 0.3221
4 17 16.66 0.3392
5 15 16.27-1.273
6 20 17.29 2.71
7 15 15.64-0.6401
8 19 16.68 2.322
9 15 16.64-1.644
10 19 16.94 2.059
11 20 16 4.003
12 18 16.64 1.361
13 15 16.93-1.932
14 14 15.66-1.657
15 20 17.33 2.667
16 16 17.17-1.169
17 16 16.64-0.6394
18 16 16.37-0.3681
19 10 16.12-6.118
20 19 16.2 2.8
21 19 16.64 2.356
22 16 16.43-0.4325
23 15 16.64-1.644
24 18 16.77 1.227
25 17 16.54 0.4558
26 19 16.51 2.494
27 17 16.68 0.3177
28 19 16.14 2.856
29 20 16.44 3.563
30 19 17.07 1.935
31 16 16.64-0.6437
32 15 16.67-1.665
33 16 16.78-0.7774
34 18 16.64 1.356
35 15 16.91-1.915
36 17 16.31 0.6885
37 20 17.07 2.934
38 19 16.68 2.318
39 7 16.29-9.29
40 13 16.54-3.544
41 16 16.39-0.3896
42 18 16.39 1.61
43 18 16.39 1.61
44 16 16.14-0.1441
45 17 17.69-0.6903
46 19 16.56 2.439
47 16 17.21-1.208
48 19 16.79 2.206
49 13 16.64-3.644
50 16 16.42-0.4189
51 13 16.41-3.411
52 12 17.19-5.186
53 17 16.66 0.3392
54 17 16.56 0.443
55 17 16.9 0.1021
56 16 16.79-0.7941
57 16 16.69-0.6867
58 14 16.52-2.523
59 16 16.12-0.1183
60 13 16.64-3.644
61 16 16.66-0.6608
62 14 17.19-3.186
63 20 17.55 2.448
64 12 16.02-4.019
65 13 15.9-2.902
66 18 16.9 1.102
67 14 16.74-2.743
68 19 16.64 2.356
69 18 16.76 1.24
70 14 16.14-2.143
71 18 16.42 1.585
72 19 16.93 2.068
73 15 16.9-1.898
74 14 16.9-2.898
75 17 16.77 0.2309
76 19 17.19 1.814
77 13 16.43-3.432
78 19 17.71 1.293
79 20 16.03 3.973
80 15 15.89-0.8899
81 15 16.64-1.644
82 15 16.29-1.29
83 20 16.39 3.606
84 15 16.14-1.135
85 19 16.27 2.731
86 18 16.81 1.189
87 18 16.39 1.606
88 15 16.51-1.511
89 20 17.6 2.405
90 17 16.14 0.8603
91 12 16.06-4.062
92 18 16.66 1.339
93 19 16.53 2.468
94 20 16.02 3.981
95 17 16.39 0.6148
96 16 16.51-0.5062
97 18 16.39 1.61
98 18 16.12 1.882
99 14 16.24-2.239
100 15 16.81-1.811
101 12 17.09-5.087
102 17 16.54 0.4601
103 14 16.67-2.665
104 18 17.46 0.5424
105 17 16.14 0.8559
106 17 15.89 1.106
107 20 17.69 2.31
108 16 16.39-0.3896
109 14 16.54-2.544
110 15 16.9-1.898
111 18 16.51 1.489
112 20 16.93 3.068
113 17 17.07-0.06536
114 17 15.89 1.11
115 17 16.14 0.8646
116 17 16.81 0.1888
117 17 16.93 0.06787
118 18 16.44 1.56
119 17 16.12 0.8817
120 20 16.81 3.193
121 16 17.18-1.182
122 15 16.39-1.39
123 18 15.61 2.386
124 15 15.65-0.648
125 18 16.03 1.972
126 20 16.55 3.451
127 19 17.2 1.797
128 14 16.14-2.135
129 16 16.62-0.6223
130 15 16.26-1.261
131 17 16.14 0.8603
132 18 16.37 1.628
133 20 16.01 3.986
134 17 15.5 1.499
135 18 16.37 1.628
136 15 17.29-2.29
137 16 16.12-0.1183
138 11 16.95-5.949
139 15 16.42-1.415
140 18 17.56 0.4429
141 17 16.93 0.06787
142 12 16.9-4.898
143 19 17.19 1.814
144 18 16.37 1.628
145 15 15.77-0.7689
146 17 16.75 0.248
147 19 16.29 2.71
148 18 17.19 0.8137
149 19 16.64 2.356
150 16 17.56-1.561
151 16 16.91-0.915
152 16 16.67-0.6652
153 14 16.19-2.186


Goldfeld-Quandt test for Heteroskedasticity
p-valuesAlternative Hypothesis
breakpoint indexgreater2-sidedless
8 0.221 0.442 0.779
9 0.3214 0.6427 0.6786
10 0.3287 0.6574 0.6713
11 0.6074 0.7852 0.3926
12 0.4994 0.9988 0.5006
13 0.5144 0.9713 0.4856
14 0.4151 0.8302 0.5849
15 0.434 0.8681 0.566
16 0.429 0.858 0.571
17 0.384 0.768 0.616
18 0.3189 0.6377 0.6811
19 0.6912 0.6175 0.3088
20 0.6857 0.6286 0.3143
21 0.6973 0.6053 0.3027
22 0.6386 0.7229 0.3614
23 0.5933 0.8134 0.4067
24 0.5321 0.9358 0.4679
25 0.4631 0.9263 0.5369
26 0.4817 0.9635 0.5183
27 0.4178 0.8356 0.5822
28 0.4839 0.9677 0.5161
29 0.5295 0.941 0.4705
30 0.4839 0.9679 0.5161
31 0.4283 0.8567 0.5717
32 0.4155 0.831 0.5845
33 0.3682 0.7363 0.6318
34 0.3303 0.6606 0.6697
35 0.3312 0.6623 0.6688
36 0.2814 0.5628 0.7186
37 0.2782 0.5563 0.7218
38 0.2627 0.5254 0.7373
39 0.9036 0.1928 0.09642
40 0.9178 0.1645 0.08225
41 0.8958 0.2084 0.1042
42 0.8848 0.2304 0.1152
43 0.8721 0.2558 0.1279
44 0.8427 0.3147 0.1573
45 0.8195 0.361 0.1805
46 0.8347 0.3305 0.1653
47 0.8207 0.3587 0.1793
48 0.8255 0.349 0.1745
49 0.8658 0.2685 0.1342
50 0.8401 0.3198 0.1599
51 0.8692 0.2616 0.1308
52 0.9474 0.1052 0.05258
53 0.9332 0.1337 0.06684
54 0.9175 0.1649 0.08247
55 0.8972 0.2056 0.1028
56 0.8755 0.249 0.1245
57 0.8523 0.2954 0.1477
58 0.8506 0.2987 0.1494
59 0.8219 0.3562 0.1781
60 0.8602 0.2797 0.1398
61 0.8336 0.3327 0.1664
62 0.8585 0.2831 0.1415
63 0.8627 0.2746 0.1373
64 0.8992 0.2017 0.1008
65 0.9048 0.1905 0.09524
66 0.8877 0.2246 0.1123
67 0.8999 0.2002 0.1001
68 0.9013 0.1974 0.09871
69 0.8844 0.2312 0.1156
70 0.8906 0.2188 0.1094
71 0.8818 0.2363 0.1182
72 0.8774 0.2452 0.1226
73 0.8727 0.2547 0.1273
74 0.893 0.2139 0.107
75 0.8699 0.2602 0.1301
76 0.8595 0.281 0.1405
77 0.8813 0.2373 0.1187
78 0.8641 0.2717 0.1359
79 0.9116 0.1768 0.0884
80 0.8935 0.2129 0.1065
81 0.8851 0.2298 0.1149
82 0.8695 0.2609 0.1305
83 0.9037 0.1927 0.09634
84 0.8895 0.2209 0.1105
85 0.895 0.2099 0.105
86 0.8769 0.2462 0.1231
87 0.864 0.2721 0.136
88 0.8486 0.3028 0.1514
89 0.8644 0.2711 0.1356
90 0.8409 0.3183 0.1591
91 0.8887 0.2226 0.1113
92 0.8718 0.2563 0.1282
93 0.8787 0.2426 0.1213
94 0.9179 0.1643 0.08215
95 0.8985 0.203 0.1015
96 0.8784 0.2431 0.1216
97 0.8623 0.2754 0.1377
98 0.8481 0.3039 0.1519
99 0.8572 0.2857 0.1428
100 0.846 0.3079 0.154
101 0.9289 0.1423 0.07114
102 0.91 0.18 0.08999
103 0.9183 0.1634 0.08172
104 0.8992 0.2016 0.1008
105 0.8769 0.2461 0.1231
106 0.8551 0.2898 0.1449
107 0.8657 0.2685 0.1343
108 0.8378 0.3243 0.1622
109 0.8494 0.3011 0.1506
110 0.8401 0.3199 0.1599
111 0.8184 0.3632 0.1816
112 0.8524 0.2953 0.1476
113 0.8174 0.3653 0.1826
114 0.7838 0.4324 0.2162
115 0.743 0.514 0.257
116 0.6943 0.6113 0.3057
117 0.6425 0.715 0.3575
118 0.6031 0.7937 0.3969
119 0.5484 0.9031 0.4516
120 0.6115 0.7769 0.3885
121 0.5578 0.8845 0.4422
122 0.523 0.9539 0.477
123 0.5015 0.997 0.4985
124 0.4724 0.9449 0.5276
125 0.5074 0.9852 0.4926
126 0.5555 0.889 0.4445
127 0.5998 0.8004 0.4002
128 0.5978 0.8044 0.4022
129 0.5834 0.8331 0.4166
130 0.5301 0.9398 0.4699
131 0.4629 0.9258 0.5371
132 0.3964 0.7928 0.6036
133 0.4753 0.9506 0.5247
134 0.4063 0.8126 0.5937
135 0.3412 0.6824 0.6588
136 0.305 0.61 0.695
137 0.2379 0.4758 0.7621
138 0.6819 0.6362 0.3181
139 0.6136 0.7727 0.3864
140 0.5415 0.917 0.4585
141 0.5794 0.8412 0.4206
142 0.7372 0.5256 0.2628
143 0.7207 0.5586 0.2793
144 0.6193 0.7614 0.3807
145 0.5029 0.9942 0.4971

\begin{tabular}{lllllllll}
\hline
Goldfeld-Quandt test for Heteroskedasticity \tabularnewline
p-values & Alternative Hypothesis \tabularnewline
breakpoint index & greater & 2-sided & less \tabularnewline
8 &  0.221 &  0.442 &  0.779 \tabularnewline
9 &  0.3214 &  0.6427 &  0.6786 \tabularnewline
10 &  0.3287 &  0.6574 &  0.6713 \tabularnewline
11 &  0.6074 &  0.7852 &  0.3926 \tabularnewline
12 &  0.4994 &  0.9988 &  0.5006 \tabularnewline
13 &  0.5144 &  0.9713 &  0.4856 \tabularnewline
14 &  0.4151 &  0.8302 &  0.5849 \tabularnewline
15 &  0.434 &  0.8681 &  0.566 \tabularnewline
16 &  0.429 &  0.858 &  0.571 \tabularnewline
17 &  0.384 &  0.768 &  0.616 \tabularnewline
18 &  0.3189 &  0.6377 &  0.6811 \tabularnewline
19 &  0.6912 &  0.6175 &  0.3088 \tabularnewline
20 &  0.6857 &  0.6286 &  0.3143 \tabularnewline
21 &  0.6973 &  0.6053 &  0.3027 \tabularnewline
22 &  0.6386 &  0.7229 &  0.3614 \tabularnewline
23 &  0.5933 &  0.8134 &  0.4067 \tabularnewline
24 &  0.5321 &  0.9358 &  0.4679 \tabularnewline
25 &  0.4631 &  0.9263 &  0.5369 \tabularnewline
26 &  0.4817 &  0.9635 &  0.5183 \tabularnewline
27 &  0.4178 &  0.8356 &  0.5822 \tabularnewline
28 &  0.4839 &  0.9677 &  0.5161 \tabularnewline
29 &  0.5295 &  0.941 &  0.4705 \tabularnewline
30 &  0.4839 &  0.9679 &  0.5161 \tabularnewline
31 &  0.4283 &  0.8567 &  0.5717 \tabularnewline
32 &  0.4155 &  0.831 &  0.5845 \tabularnewline
33 &  0.3682 &  0.7363 &  0.6318 \tabularnewline
34 &  0.3303 &  0.6606 &  0.6697 \tabularnewline
35 &  0.3312 &  0.6623 &  0.6688 \tabularnewline
36 &  0.2814 &  0.5628 &  0.7186 \tabularnewline
37 &  0.2782 &  0.5563 &  0.7218 \tabularnewline
38 &  0.2627 &  0.5254 &  0.7373 \tabularnewline
39 &  0.9036 &  0.1928 &  0.09642 \tabularnewline
40 &  0.9178 &  0.1645 &  0.08225 \tabularnewline
41 &  0.8958 &  0.2084 &  0.1042 \tabularnewline
42 &  0.8848 &  0.2304 &  0.1152 \tabularnewline
43 &  0.8721 &  0.2558 &  0.1279 \tabularnewline
44 &  0.8427 &  0.3147 &  0.1573 \tabularnewline
45 &  0.8195 &  0.361 &  0.1805 \tabularnewline
46 &  0.8347 &  0.3305 &  0.1653 \tabularnewline
47 &  0.8207 &  0.3587 &  0.1793 \tabularnewline
48 &  0.8255 &  0.349 &  0.1745 \tabularnewline
49 &  0.8658 &  0.2685 &  0.1342 \tabularnewline
50 &  0.8401 &  0.3198 &  0.1599 \tabularnewline
51 &  0.8692 &  0.2616 &  0.1308 \tabularnewline
52 &  0.9474 &  0.1052 &  0.05258 \tabularnewline
53 &  0.9332 &  0.1337 &  0.06684 \tabularnewline
54 &  0.9175 &  0.1649 &  0.08247 \tabularnewline
55 &  0.8972 &  0.2056 &  0.1028 \tabularnewline
56 &  0.8755 &  0.249 &  0.1245 \tabularnewline
57 &  0.8523 &  0.2954 &  0.1477 \tabularnewline
58 &  0.8506 &  0.2987 &  0.1494 \tabularnewline
59 &  0.8219 &  0.3562 &  0.1781 \tabularnewline
60 &  0.8602 &  0.2797 &  0.1398 \tabularnewline
61 &  0.8336 &  0.3327 &  0.1664 \tabularnewline
62 &  0.8585 &  0.2831 &  0.1415 \tabularnewline
63 &  0.8627 &  0.2746 &  0.1373 \tabularnewline
64 &  0.8992 &  0.2017 &  0.1008 \tabularnewline
65 &  0.9048 &  0.1905 &  0.09524 \tabularnewline
66 &  0.8877 &  0.2246 &  0.1123 \tabularnewline
67 &  0.8999 &  0.2002 &  0.1001 \tabularnewline
68 &  0.9013 &  0.1974 &  0.09871 \tabularnewline
69 &  0.8844 &  0.2312 &  0.1156 \tabularnewline
70 &  0.8906 &  0.2188 &  0.1094 \tabularnewline
71 &  0.8818 &  0.2363 &  0.1182 \tabularnewline
72 &  0.8774 &  0.2452 &  0.1226 \tabularnewline
73 &  0.8727 &  0.2547 &  0.1273 \tabularnewline
74 &  0.893 &  0.2139 &  0.107 \tabularnewline
75 &  0.8699 &  0.2602 &  0.1301 \tabularnewline
76 &  0.8595 &  0.281 &  0.1405 \tabularnewline
77 &  0.8813 &  0.2373 &  0.1187 \tabularnewline
78 &  0.8641 &  0.2717 &  0.1359 \tabularnewline
79 &  0.9116 &  0.1768 &  0.0884 \tabularnewline
80 &  0.8935 &  0.2129 &  0.1065 \tabularnewline
81 &  0.8851 &  0.2298 &  0.1149 \tabularnewline
82 &  0.8695 &  0.2609 &  0.1305 \tabularnewline
83 &  0.9037 &  0.1927 &  0.09634 \tabularnewline
84 &  0.8895 &  0.2209 &  0.1105 \tabularnewline
85 &  0.895 &  0.2099 &  0.105 \tabularnewline
86 &  0.8769 &  0.2462 &  0.1231 \tabularnewline
87 &  0.864 &  0.2721 &  0.136 \tabularnewline
88 &  0.8486 &  0.3028 &  0.1514 \tabularnewline
89 &  0.8644 &  0.2711 &  0.1356 \tabularnewline
90 &  0.8409 &  0.3183 &  0.1591 \tabularnewline
91 &  0.8887 &  0.2226 &  0.1113 \tabularnewline
92 &  0.8718 &  0.2563 &  0.1282 \tabularnewline
93 &  0.8787 &  0.2426 &  0.1213 \tabularnewline
94 &  0.9179 &  0.1643 &  0.08215 \tabularnewline
95 &  0.8985 &  0.203 &  0.1015 \tabularnewline
96 &  0.8784 &  0.2431 &  0.1216 \tabularnewline
97 &  0.8623 &  0.2754 &  0.1377 \tabularnewline
98 &  0.8481 &  0.3039 &  0.1519 \tabularnewline
99 &  0.8572 &  0.2857 &  0.1428 \tabularnewline
100 &  0.846 &  0.3079 &  0.154 \tabularnewline
101 &  0.9289 &  0.1423 &  0.07114 \tabularnewline
102 &  0.91 &  0.18 &  0.08999 \tabularnewline
103 &  0.9183 &  0.1634 &  0.08172 \tabularnewline
104 &  0.8992 &  0.2016 &  0.1008 \tabularnewline
105 &  0.8769 &  0.2461 &  0.1231 \tabularnewline
106 &  0.8551 &  0.2898 &  0.1449 \tabularnewline
107 &  0.8657 &  0.2685 &  0.1343 \tabularnewline
108 &  0.8378 &  0.3243 &  0.1622 \tabularnewline
109 &  0.8494 &  0.3011 &  0.1506 \tabularnewline
110 &  0.8401 &  0.3199 &  0.1599 \tabularnewline
111 &  0.8184 &  0.3632 &  0.1816 \tabularnewline
112 &  0.8524 &  0.2953 &  0.1476 \tabularnewline
113 &  0.8174 &  0.3653 &  0.1826 \tabularnewline
114 &  0.7838 &  0.4324 &  0.2162 \tabularnewline
115 &  0.743 &  0.514 &  0.257 \tabularnewline
116 &  0.6943 &  0.6113 &  0.3057 \tabularnewline
117 &  0.6425 &  0.715 &  0.3575 \tabularnewline
118 &  0.6031 &  0.7937 &  0.3969 \tabularnewline
119 &  0.5484 &  0.9031 &  0.4516 \tabularnewline
120 &  0.6115 &  0.7769 &  0.3885 \tabularnewline
121 &  0.5578 &  0.8845 &  0.4422 \tabularnewline
122 &  0.523 &  0.9539 &  0.477 \tabularnewline
123 &  0.5015 &  0.997 &  0.4985 \tabularnewline
124 &  0.4724 &  0.9449 &  0.5276 \tabularnewline
125 &  0.5074 &  0.9852 &  0.4926 \tabularnewline
126 &  0.5555 &  0.889 &  0.4445 \tabularnewline
127 &  0.5998 &  0.8004 &  0.4002 \tabularnewline
128 &  0.5978 &  0.8044 &  0.4022 \tabularnewline
129 &  0.5834 &  0.8331 &  0.4166 \tabularnewline
130 &  0.5301 &  0.9398 &  0.4699 \tabularnewline
131 &  0.4629 &  0.9258 &  0.5371 \tabularnewline
132 &  0.3964 &  0.7928 &  0.6036 \tabularnewline
133 &  0.4753 &  0.9506 &  0.5247 \tabularnewline
134 &  0.4063 &  0.8126 &  0.5937 \tabularnewline
135 &  0.3412 &  0.6824 &  0.6588 \tabularnewline
136 &  0.305 &  0.61 &  0.695 \tabularnewline
137 &  0.2379 &  0.4758 &  0.7621 \tabularnewline
138 &  0.6819 &  0.6362 &  0.3181 \tabularnewline
139 &  0.6136 &  0.7727 &  0.3864 \tabularnewline
140 &  0.5415 &  0.917 &  0.4585 \tabularnewline
141 &  0.5794 &  0.8412 &  0.4206 \tabularnewline
142 &  0.7372 &  0.5256 &  0.2628 \tabularnewline
143 &  0.7207 &  0.5586 &  0.2793 \tabularnewline
144 &  0.6193 &  0.7614 &  0.3807 \tabularnewline
145 &  0.5029 &  0.9942 &  0.4971 \tabularnewline
\hline
\end{tabular}
%Source: https://freestatistics.org/blog/index.php?pk=299335&T=5

[TABLE]
[ROW][C]Goldfeld-Quandt test for Heteroskedasticity[/C][/ROW]
[ROW][C]p-values[/C][C]Alternative Hypothesis[/C][/ROW]
[ROW][C]breakpoint index[/C][C]greater[/C][C]2-sided[/C][C]less[/C][/ROW]
[ROW][C]8[/C][C] 0.221[/C][C] 0.442[/C][C] 0.779[/C][/ROW]
[ROW][C]9[/C][C] 0.3214[/C][C] 0.6427[/C][C] 0.6786[/C][/ROW]
[ROW][C]10[/C][C] 0.3287[/C][C] 0.6574[/C][C] 0.6713[/C][/ROW]
[ROW][C]11[/C][C] 0.6074[/C][C] 0.7852[/C][C] 0.3926[/C][/ROW]
[ROW][C]12[/C][C] 0.4994[/C][C] 0.9988[/C][C] 0.5006[/C][/ROW]
[ROW][C]13[/C][C] 0.5144[/C][C] 0.9713[/C][C] 0.4856[/C][/ROW]
[ROW][C]14[/C][C] 0.4151[/C][C] 0.8302[/C][C] 0.5849[/C][/ROW]
[ROW][C]15[/C][C] 0.434[/C][C] 0.8681[/C][C] 0.566[/C][/ROW]
[ROW][C]16[/C][C] 0.429[/C][C] 0.858[/C][C] 0.571[/C][/ROW]
[ROW][C]17[/C][C] 0.384[/C][C] 0.768[/C][C] 0.616[/C][/ROW]
[ROW][C]18[/C][C] 0.3189[/C][C] 0.6377[/C][C] 0.6811[/C][/ROW]
[ROW][C]19[/C][C] 0.6912[/C][C] 0.6175[/C][C] 0.3088[/C][/ROW]
[ROW][C]20[/C][C] 0.6857[/C][C] 0.6286[/C][C] 0.3143[/C][/ROW]
[ROW][C]21[/C][C] 0.6973[/C][C] 0.6053[/C][C] 0.3027[/C][/ROW]
[ROW][C]22[/C][C] 0.6386[/C][C] 0.7229[/C][C] 0.3614[/C][/ROW]
[ROW][C]23[/C][C] 0.5933[/C][C] 0.8134[/C][C] 0.4067[/C][/ROW]
[ROW][C]24[/C][C] 0.5321[/C][C] 0.9358[/C][C] 0.4679[/C][/ROW]
[ROW][C]25[/C][C] 0.4631[/C][C] 0.9263[/C][C] 0.5369[/C][/ROW]
[ROW][C]26[/C][C] 0.4817[/C][C] 0.9635[/C][C] 0.5183[/C][/ROW]
[ROW][C]27[/C][C] 0.4178[/C][C] 0.8356[/C][C] 0.5822[/C][/ROW]
[ROW][C]28[/C][C] 0.4839[/C][C] 0.9677[/C][C] 0.5161[/C][/ROW]
[ROW][C]29[/C][C] 0.5295[/C][C] 0.941[/C][C] 0.4705[/C][/ROW]
[ROW][C]30[/C][C] 0.4839[/C][C] 0.9679[/C][C] 0.5161[/C][/ROW]
[ROW][C]31[/C][C] 0.4283[/C][C] 0.8567[/C][C] 0.5717[/C][/ROW]
[ROW][C]32[/C][C] 0.4155[/C][C] 0.831[/C][C] 0.5845[/C][/ROW]
[ROW][C]33[/C][C] 0.3682[/C][C] 0.7363[/C][C] 0.6318[/C][/ROW]
[ROW][C]34[/C][C] 0.3303[/C][C] 0.6606[/C][C] 0.6697[/C][/ROW]
[ROW][C]35[/C][C] 0.3312[/C][C] 0.6623[/C][C] 0.6688[/C][/ROW]
[ROW][C]36[/C][C] 0.2814[/C][C] 0.5628[/C][C] 0.7186[/C][/ROW]
[ROW][C]37[/C][C] 0.2782[/C][C] 0.5563[/C][C] 0.7218[/C][/ROW]
[ROW][C]38[/C][C] 0.2627[/C][C] 0.5254[/C][C] 0.7373[/C][/ROW]
[ROW][C]39[/C][C] 0.9036[/C][C] 0.1928[/C][C] 0.09642[/C][/ROW]
[ROW][C]40[/C][C] 0.9178[/C][C] 0.1645[/C][C] 0.08225[/C][/ROW]
[ROW][C]41[/C][C] 0.8958[/C][C] 0.2084[/C][C] 0.1042[/C][/ROW]
[ROW][C]42[/C][C] 0.8848[/C][C] 0.2304[/C][C] 0.1152[/C][/ROW]
[ROW][C]43[/C][C] 0.8721[/C][C] 0.2558[/C][C] 0.1279[/C][/ROW]
[ROW][C]44[/C][C] 0.8427[/C][C] 0.3147[/C][C] 0.1573[/C][/ROW]
[ROW][C]45[/C][C] 0.8195[/C][C] 0.361[/C][C] 0.1805[/C][/ROW]
[ROW][C]46[/C][C] 0.8347[/C][C] 0.3305[/C][C] 0.1653[/C][/ROW]
[ROW][C]47[/C][C] 0.8207[/C][C] 0.3587[/C][C] 0.1793[/C][/ROW]
[ROW][C]48[/C][C] 0.8255[/C][C] 0.349[/C][C] 0.1745[/C][/ROW]
[ROW][C]49[/C][C] 0.8658[/C][C] 0.2685[/C][C] 0.1342[/C][/ROW]
[ROW][C]50[/C][C] 0.8401[/C][C] 0.3198[/C][C] 0.1599[/C][/ROW]
[ROW][C]51[/C][C] 0.8692[/C][C] 0.2616[/C][C] 0.1308[/C][/ROW]
[ROW][C]52[/C][C] 0.9474[/C][C] 0.1052[/C][C] 0.05258[/C][/ROW]
[ROW][C]53[/C][C] 0.9332[/C][C] 0.1337[/C][C] 0.06684[/C][/ROW]
[ROW][C]54[/C][C] 0.9175[/C][C] 0.1649[/C][C] 0.08247[/C][/ROW]
[ROW][C]55[/C][C] 0.8972[/C][C] 0.2056[/C][C] 0.1028[/C][/ROW]
[ROW][C]56[/C][C] 0.8755[/C][C] 0.249[/C][C] 0.1245[/C][/ROW]
[ROW][C]57[/C][C] 0.8523[/C][C] 0.2954[/C][C] 0.1477[/C][/ROW]
[ROW][C]58[/C][C] 0.8506[/C][C] 0.2987[/C][C] 0.1494[/C][/ROW]
[ROW][C]59[/C][C] 0.8219[/C][C] 0.3562[/C][C] 0.1781[/C][/ROW]
[ROW][C]60[/C][C] 0.8602[/C][C] 0.2797[/C][C] 0.1398[/C][/ROW]
[ROW][C]61[/C][C] 0.8336[/C][C] 0.3327[/C][C] 0.1664[/C][/ROW]
[ROW][C]62[/C][C] 0.8585[/C][C] 0.2831[/C][C] 0.1415[/C][/ROW]
[ROW][C]63[/C][C] 0.8627[/C][C] 0.2746[/C][C] 0.1373[/C][/ROW]
[ROW][C]64[/C][C] 0.8992[/C][C] 0.2017[/C][C] 0.1008[/C][/ROW]
[ROW][C]65[/C][C] 0.9048[/C][C] 0.1905[/C][C] 0.09524[/C][/ROW]
[ROW][C]66[/C][C] 0.8877[/C][C] 0.2246[/C][C] 0.1123[/C][/ROW]
[ROW][C]67[/C][C] 0.8999[/C][C] 0.2002[/C][C] 0.1001[/C][/ROW]
[ROW][C]68[/C][C] 0.9013[/C][C] 0.1974[/C][C] 0.09871[/C][/ROW]
[ROW][C]69[/C][C] 0.8844[/C][C] 0.2312[/C][C] 0.1156[/C][/ROW]
[ROW][C]70[/C][C] 0.8906[/C][C] 0.2188[/C][C] 0.1094[/C][/ROW]
[ROW][C]71[/C][C] 0.8818[/C][C] 0.2363[/C][C] 0.1182[/C][/ROW]
[ROW][C]72[/C][C] 0.8774[/C][C] 0.2452[/C][C] 0.1226[/C][/ROW]
[ROW][C]73[/C][C] 0.8727[/C][C] 0.2547[/C][C] 0.1273[/C][/ROW]
[ROW][C]74[/C][C] 0.893[/C][C] 0.2139[/C][C] 0.107[/C][/ROW]
[ROW][C]75[/C][C] 0.8699[/C][C] 0.2602[/C][C] 0.1301[/C][/ROW]
[ROW][C]76[/C][C] 0.8595[/C][C] 0.281[/C][C] 0.1405[/C][/ROW]
[ROW][C]77[/C][C] 0.8813[/C][C] 0.2373[/C][C] 0.1187[/C][/ROW]
[ROW][C]78[/C][C] 0.8641[/C][C] 0.2717[/C][C] 0.1359[/C][/ROW]
[ROW][C]79[/C][C] 0.9116[/C][C] 0.1768[/C][C] 0.0884[/C][/ROW]
[ROW][C]80[/C][C] 0.8935[/C][C] 0.2129[/C][C] 0.1065[/C][/ROW]
[ROW][C]81[/C][C] 0.8851[/C][C] 0.2298[/C][C] 0.1149[/C][/ROW]
[ROW][C]82[/C][C] 0.8695[/C][C] 0.2609[/C][C] 0.1305[/C][/ROW]
[ROW][C]83[/C][C] 0.9037[/C][C] 0.1927[/C][C] 0.09634[/C][/ROW]
[ROW][C]84[/C][C] 0.8895[/C][C] 0.2209[/C][C] 0.1105[/C][/ROW]
[ROW][C]85[/C][C] 0.895[/C][C] 0.2099[/C][C] 0.105[/C][/ROW]
[ROW][C]86[/C][C] 0.8769[/C][C] 0.2462[/C][C] 0.1231[/C][/ROW]
[ROW][C]87[/C][C] 0.864[/C][C] 0.2721[/C][C] 0.136[/C][/ROW]
[ROW][C]88[/C][C] 0.8486[/C][C] 0.3028[/C][C] 0.1514[/C][/ROW]
[ROW][C]89[/C][C] 0.8644[/C][C] 0.2711[/C][C] 0.1356[/C][/ROW]
[ROW][C]90[/C][C] 0.8409[/C][C] 0.3183[/C][C] 0.1591[/C][/ROW]
[ROW][C]91[/C][C] 0.8887[/C][C] 0.2226[/C][C] 0.1113[/C][/ROW]
[ROW][C]92[/C][C] 0.8718[/C][C] 0.2563[/C][C] 0.1282[/C][/ROW]
[ROW][C]93[/C][C] 0.8787[/C][C] 0.2426[/C][C] 0.1213[/C][/ROW]
[ROW][C]94[/C][C] 0.9179[/C][C] 0.1643[/C][C] 0.08215[/C][/ROW]
[ROW][C]95[/C][C] 0.8985[/C][C] 0.203[/C][C] 0.1015[/C][/ROW]
[ROW][C]96[/C][C] 0.8784[/C][C] 0.2431[/C][C] 0.1216[/C][/ROW]
[ROW][C]97[/C][C] 0.8623[/C][C] 0.2754[/C][C] 0.1377[/C][/ROW]
[ROW][C]98[/C][C] 0.8481[/C][C] 0.3039[/C][C] 0.1519[/C][/ROW]
[ROW][C]99[/C][C] 0.8572[/C][C] 0.2857[/C][C] 0.1428[/C][/ROW]
[ROW][C]100[/C][C] 0.846[/C][C] 0.3079[/C][C] 0.154[/C][/ROW]
[ROW][C]101[/C][C] 0.9289[/C][C] 0.1423[/C][C] 0.07114[/C][/ROW]
[ROW][C]102[/C][C] 0.91[/C][C] 0.18[/C][C] 0.08999[/C][/ROW]
[ROW][C]103[/C][C] 0.9183[/C][C] 0.1634[/C][C] 0.08172[/C][/ROW]
[ROW][C]104[/C][C] 0.8992[/C][C] 0.2016[/C][C] 0.1008[/C][/ROW]
[ROW][C]105[/C][C] 0.8769[/C][C] 0.2461[/C][C] 0.1231[/C][/ROW]
[ROW][C]106[/C][C] 0.8551[/C][C] 0.2898[/C][C] 0.1449[/C][/ROW]
[ROW][C]107[/C][C] 0.8657[/C][C] 0.2685[/C][C] 0.1343[/C][/ROW]
[ROW][C]108[/C][C] 0.8378[/C][C] 0.3243[/C][C] 0.1622[/C][/ROW]
[ROW][C]109[/C][C] 0.8494[/C][C] 0.3011[/C][C] 0.1506[/C][/ROW]
[ROW][C]110[/C][C] 0.8401[/C][C] 0.3199[/C][C] 0.1599[/C][/ROW]
[ROW][C]111[/C][C] 0.8184[/C][C] 0.3632[/C][C] 0.1816[/C][/ROW]
[ROW][C]112[/C][C] 0.8524[/C][C] 0.2953[/C][C] 0.1476[/C][/ROW]
[ROW][C]113[/C][C] 0.8174[/C][C] 0.3653[/C][C] 0.1826[/C][/ROW]
[ROW][C]114[/C][C] 0.7838[/C][C] 0.4324[/C][C] 0.2162[/C][/ROW]
[ROW][C]115[/C][C] 0.743[/C][C] 0.514[/C][C] 0.257[/C][/ROW]
[ROW][C]116[/C][C] 0.6943[/C][C] 0.6113[/C][C] 0.3057[/C][/ROW]
[ROW][C]117[/C][C] 0.6425[/C][C] 0.715[/C][C] 0.3575[/C][/ROW]
[ROW][C]118[/C][C] 0.6031[/C][C] 0.7937[/C][C] 0.3969[/C][/ROW]
[ROW][C]119[/C][C] 0.5484[/C][C] 0.9031[/C][C] 0.4516[/C][/ROW]
[ROW][C]120[/C][C] 0.6115[/C][C] 0.7769[/C][C] 0.3885[/C][/ROW]
[ROW][C]121[/C][C] 0.5578[/C][C] 0.8845[/C][C] 0.4422[/C][/ROW]
[ROW][C]122[/C][C] 0.523[/C][C] 0.9539[/C][C] 0.477[/C][/ROW]
[ROW][C]123[/C][C] 0.5015[/C][C] 0.997[/C][C] 0.4985[/C][/ROW]
[ROW][C]124[/C][C] 0.4724[/C][C] 0.9449[/C][C] 0.5276[/C][/ROW]
[ROW][C]125[/C][C] 0.5074[/C][C] 0.9852[/C][C] 0.4926[/C][/ROW]
[ROW][C]126[/C][C] 0.5555[/C][C] 0.889[/C][C] 0.4445[/C][/ROW]
[ROW][C]127[/C][C] 0.5998[/C][C] 0.8004[/C][C] 0.4002[/C][/ROW]
[ROW][C]128[/C][C] 0.5978[/C][C] 0.8044[/C][C] 0.4022[/C][/ROW]
[ROW][C]129[/C][C] 0.5834[/C][C] 0.8331[/C][C] 0.4166[/C][/ROW]
[ROW][C]130[/C][C] 0.5301[/C][C] 0.9398[/C][C] 0.4699[/C][/ROW]
[ROW][C]131[/C][C] 0.4629[/C][C] 0.9258[/C][C] 0.5371[/C][/ROW]
[ROW][C]132[/C][C] 0.3964[/C][C] 0.7928[/C][C] 0.6036[/C][/ROW]
[ROW][C]133[/C][C] 0.4753[/C][C] 0.9506[/C][C] 0.5247[/C][/ROW]
[ROW][C]134[/C][C] 0.4063[/C][C] 0.8126[/C][C] 0.5937[/C][/ROW]
[ROW][C]135[/C][C] 0.3412[/C][C] 0.6824[/C][C] 0.6588[/C][/ROW]
[ROW][C]136[/C][C] 0.305[/C][C] 0.61[/C][C] 0.695[/C][/ROW]
[ROW][C]137[/C][C] 0.2379[/C][C] 0.4758[/C][C] 0.7621[/C][/ROW]
[ROW][C]138[/C][C] 0.6819[/C][C] 0.6362[/C][C] 0.3181[/C][/ROW]
[ROW][C]139[/C][C] 0.6136[/C][C] 0.7727[/C][C] 0.3864[/C][/ROW]
[ROW][C]140[/C][C] 0.5415[/C][C] 0.917[/C][C] 0.4585[/C][/ROW]
[ROW][C]141[/C][C] 0.5794[/C][C] 0.8412[/C][C] 0.4206[/C][/ROW]
[ROW][C]142[/C][C] 0.7372[/C][C] 0.5256[/C][C] 0.2628[/C][/ROW]
[ROW][C]143[/C][C] 0.7207[/C][C] 0.5586[/C][C] 0.2793[/C][/ROW]
[ROW][C]144[/C][C] 0.6193[/C][C] 0.7614[/C][C] 0.3807[/C][/ROW]
[ROW][C]145[/C][C] 0.5029[/C][C] 0.9942[/C][C] 0.4971[/C][/ROW]
[/TABLE]
Source: https://freestatistics.org/blog/index.php?pk=299335&T=5

Globally Unique Identifier (entire table): ba.freestatistics.org/blog/index.php?pk=299335&T=5

As an alternative you can also use a QR Code:  

The GUIDs for individual cells are displayed in the table below:

Goldfeld-Quandt test for Heteroskedasticity
p-valuesAlternative Hypothesis
breakpoint indexgreater2-sidedless
8 0.221 0.442 0.779
9 0.3214 0.6427 0.6786
10 0.3287 0.6574 0.6713
11 0.6074 0.7852 0.3926
12 0.4994 0.9988 0.5006
13 0.5144 0.9713 0.4856
14 0.4151 0.8302 0.5849
15 0.434 0.8681 0.566
16 0.429 0.858 0.571
17 0.384 0.768 0.616
18 0.3189 0.6377 0.6811
19 0.6912 0.6175 0.3088
20 0.6857 0.6286 0.3143
21 0.6973 0.6053 0.3027
22 0.6386 0.7229 0.3614
23 0.5933 0.8134 0.4067
24 0.5321 0.9358 0.4679
25 0.4631 0.9263 0.5369
26 0.4817 0.9635 0.5183
27 0.4178 0.8356 0.5822
28 0.4839 0.9677 0.5161
29 0.5295 0.941 0.4705
30 0.4839 0.9679 0.5161
31 0.4283 0.8567 0.5717
32 0.4155 0.831 0.5845
33 0.3682 0.7363 0.6318
34 0.3303 0.6606 0.6697
35 0.3312 0.6623 0.6688
36 0.2814 0.5628 0.7186
37 0.2782 0.5563 0.7218
38 0.2627 0.5254 0.7373
39 0.9036 0.1928 0.09642
40 0.9178 0.1645 0.08225
41 0.8958 0.2084 0.1042
42 0.8848 0.2304 0.1152
43 0.8721 0.2558 0.1279
44 0.8427 0.3147 0.1573
45 0.8195 0.361 0.1805
46 0.8347 0.3305 0.1653
47 0.8207 0.3587 0.1793
48 0.8255 0.349 0.1745
49 0.8658 0.2685 0.1342
50 0.8401 0.3198 0.1599
51 0.8692 0.2616 0.1308
52 0.9474 0.1052 0.05258
53 0.9332 0.1337 0.06684
54 0.9175 0.1649 0.08247
55 0.8972 0.2056 0.1028
56 0.8755 0.249 0.1245
57 0.8523 0.2954 0.1477
58 0.8506 0.2987 0.1494
59 0.8219 0.3562 0.1781
60 0.8602 0.2797 0.1398
61 0.8336 0.3327 0.1664
62 0.8585 0.2831 0.1415
63 0.8627 0.2746 0.1373
64 0.8992 0.2017 0.1008
65 0.9048 0.1905 0.09524
66 0.8877 0.2246 0.1123
67 0.8999 0.2002 0.1001
68 0.9013 0.1974 0.09871
69 0.8844 0.2312 0.1156
70 0.8906 0.2188 0.1094
71 0.8818 0.2363 0.1182
72 0.8774 0.2452 0.1226
73 0.8727 0.2547 0.1273
74 0.893 0.2139 0.107
75 0.8699 0.2602 0.1301
76 0.8595 0.281 0.1405
77 0.8813 0.2373 0.1187
78 0.8641 0.2717 0.1359
79 0.9116 0.1768 0.0884
80 0.8935 0.2129 0.1065
81 0.8851 0.2298 0.1149
82 0.8695 0.2609 0.1305
83 0.9037 0.1927 0.09634
84 0.8895 0.2209 0.1105
85 0.895 0.2099 0.105
86 0.8769 0.2462 0.1231
87 0.864 0.2721 0.136
88 0.8486 0.3028 0.1514
89 0.8644 0.2711 0.1356
90 0.8409 0.3183 0.1591
91 0.8887 0.2226 0.1113
92 0.8718 0.2563 0.1282
93 0.8787 0.2426 0.1213
94 0.9179 0.1643 0.08215
95 0.8985 0.203 0.1015
96 0.8784 0.2431 0.1216
97 0.8623 0.2754 0.1377
98 0.8481 0.3039 0.1519
99 0.8572 0.2857 0.1428
100 0.846 0.3079 0.154
101 0.9289 0.1423 0.07114
102 0.91 0.18 0.08999
103 0.9183 0.1634 0.08172
104 0.8992 0.2016 0.1008
105 0.8769 0.2461 0.1231
106 0.8551 0.2898 0.1449
107 0.8657 0.2685 0.1343
108 0.8378 0.3243 0.1622
109 0.8494 0.3011 0.1506
110 0.8401 0.3199 0.1599
111 0.8184 0.3632 0.1816
112 0.8524 0.2953 0.1476
113 0.8174 0.3653 0.1826
114 0.7838 0.4324 0.2162
115 0.743 0.514 0.257
116 0.6943 0.6113 0.3057
117 0.6425 0.715 0.3575
118 0.6031 0.7937 0.3969
119 0.5484 0.9031 0.4516
120 0.6115 0.7769 0.3885
121 0.5578 0.8845 0.4422
122 0.523 0.9539 0.477
123 0.5015 0.997 0.4985
124 0.4724 0.9449 0.5276
125 0.5074 0.9852 0.4926
126 0.5555 0.889 0.4445
127 0.5998 0.8004 0.4002
128 0.5978 0.8044 0.4022
129 0.5834 0.8331 0.4166
130 0.5301 0.9398 0.4699
131 0.4629 0.9258 0.5371
132 0.3964 0.7928 0.6036
133 0.4753 0.9506 0.5247
134 0.4063 0.8126 0.5937
135 0.3412 0.6824 0.6588
136 0.305 0.61 0.695
137 0.2379 0.4758 0.7621
138 0.6819 0.6362 0.3181
139 0.6136 0.7727 0.3864
140 0.5415 0.917 0.4585
141 0.5794 0.8412 0.4206
142 0.7372 0.5256 0.2628
143 0.7207 0.5586 0.2793
144 0.6193 0.7614 0.3807
145 0.5029 0.9942 0.4971


Meta Analysis of Goldfeld-Quandt test for Heteroskedasticity
Description# significant tests% significant testsOK/NOK
1% type I error level0 0OK
5% type I error level00OK
10% type I error level00OK

\begin{tabular}{lllllllll}
\hline
Meta Analysis of Goldfeld-Quandt test for Heteroskedasticity \tabularnewline
Description & # significant tests & % significant tests & OK/NOK \tabularnewline
1% type I error level & 0 &  0 & OK \tabularnewline
5% type I error level & 0 & 0 & OK \tabularnewline
10% type I error level & 0 & 0 & OK \tabularnewline
\hline
\end{tabular}
%Source: https://freestatistics.org/blog/index.php?pk=299335&T=6

[TABLE]
[ROW][C]Meta Analysis of Goldfeld-Quandt test for Heteroskedasticity[/C][/ROW]
[ROW][C]Description[/C][C]# significant tests[/C][C]% significant tests[/C][C]OK/NOK[/C][/ROW]
[ROW][C]1% type I error level[/C][C]0[/C][C] 0[/C][C]OK[/C][/ROW]
[ROW][C]5% type I error level[/C][C]0[/C][C]0[/C][C]OK[/C][/ROW]
[ROW][C]10% type I error level[/C][C]0[/C][C]0[/C][C]OK[/C][/ROW]
[/TABLE]
Source: https://freestatistics.org/blog/index.php?pk=299335&T=6

Globally Unique Identifier (entire table): ba.freestatistics.org/blog/index.php?pk=299335&T=6

As an alternative you can also use a QR Code:  

The GUIDs for individual cells are displayed in the table below:

Meta Analysis of Goldfeld-Quandt test for Heteroskedasticity
Description# significant tests% significant testsOK/NOK
1% type I error level0 0OK
5% type I error level00OK
10% type I error level00OK


Ramsey RESET F-Test for powers (2 and 3) of fitted values
> reset_test_fitted
	RESET test
data:  mylm
RESET = 1.2518, df1 = 2, df2 = 146, p-value = 0.289
Ramsey RESET F-Test for powers (2 and 3) of regressors
> reset_test_regressors
	RESET test
data:  mylm
RESET = 0.90468, df1 = 8, df2 = 140, p-value = 0.5145
Ramsey RESET F-Test for powers (2 and 3) of principal components
> reset_test_principal_components
	RESET test
data:  mylm
RESET = 2.1469, df1 = 2, df2 = 146, p-value = 0.1205

\begin{tabular}{lllllllll}
\hline
Ramsey RESET F-Test for powers (2 and 3) of fitted values \tabularnewline
> reset_test_fitted
	RESET test
data:  mylm
RESET = 1.2518, df1 = 2, df2 = 146, p-value = 0.289
\tabularnewline Ramsey RESET F-Test for powers (2 and 3) of regressors \tabularnewline
> reset_test_regressors
	RESET test
data:  mylm
RESET = 0.90468, df1 = 8, df2 = 140, p-value = 0.5145
\tabularnewline Ramsey RESET F-Test for powers (2 and 3) of principal components \tabularnewline
> reset_test_principal_components
	RESET test
data:  mylm
RESET = 2.1469, df1 = 2, df2 = 146, p-value = 0.1205
\tabularnewline \hline \end{tabular} %Source: https://freestatistics.org/blog/index.php?pk=299335&T=7

[TABLE]
[ROW][C]Ramsey RESET F-Test for powers (2 and 3) of fitted values[/C][/ROW]
[ROW][C]
> reset_test_fitted
	RESET test
data:  mylm
RESET = 1.2518, df1 = 2, df2 = 146, p-value = 0.289
[/C][/ROW] [ROW][C]Ramsey RESET F-Test for powers (2 and 3) of regressors[/C][/ROW] [ROW][C]
> reset_test_regressors
	RESET test
data:  mylm
RESET = 0.90468, df1 = 8, df2 = 140, p-value = 0.5145
[/C][/ROW] [ROW][C]Ramsey RESET F-Test for powers (2 and 3) of principal components[/C][/ROW] [ROW][C]
> reset_test_principal_components
	RESET test
data:  mylm
RESET = 2.1469, df1 = 2, df2 = 146, p-value = 0.1205
[/C][/ROW] [/TABLE] Source: https://freestatistics.org/blog/index.php?pk=299335&T=7

Globally Unique Identifier (entire table): ba.freestatistics.org/blog/index.php?pk=299335&T=7

As an alternative you can also use a QR Code:  

The GUIDs for individual cells are displayed in the table below:

Ramsey RESET F-Test for powers (2 and 3) of fitted values
> reset_test_fitted
	RESET test
data:  mylm
RESET = 1.2518, df1 = 2, df2 = 146, p-value = 0.289
Ramsey RESET F-Test for powers (2 and 3) of regressors
> reset_test_regressors
	RESET test
data:  mylm
RESET = 0.90468, df1 = 8, df2 = 140, p-value = 0.5145
Ramsey RESET F-Test for powers (2 and 3) of principal components
> reset_test_principal_components
	RESET test
data:  mylm
RESET = 2.1469, df1 = 2, df2 = 146, p-value = 0.1205


Variance Inflation Factors (Multicollinearity)
> vif
     IVHB1      IVHB2      IVHB3 `IVHB4\\r` 
  1.038729   1.038396   1.044089   1.042759 

\begin{tabular}{lllllllll}
\hline
Variance Inflation Factors (Multicollinearity) \tabularnewline
> vif
     IVHB1      IVHB2      IVHB3 `IVHB4\\r` 
  1.038729   1.038396   1.044089   1.042759 
\tabularnewline \hline \end{tabular} %Source: https://freestatistics.org/blog/index.php?pk=299335&T=8

[TABLE]
[ROW][C]Variance Inflation Factors (Multicollinearity)[/C][/ROW]
[ROW][C]
> vif
     IVHB1      IVHB2      IVHB3 `IVHB4\\r` 
  1.038729   1.038396   1.044089   1.042759 
[/C][/ROW] [/TABLE] Source: https://freestatistics.org/blog/index.php?pk=299335&T=8

Globally Unique Identifier (entire table): ba.freestatistics.org/blog/index.php?pk=299335&T=8

As an alternative you can also use a QR Code:  

The GUIDs for individual cells are displayed in the table below:

Variance Inflation Factors (Multicollinearity)
> vif
     IVHB1      IVHB2      IVHB3 `IVHB4\\r` 
  1.038729   1.038396   1.044089   1.042759 


Parameters (Session):
par1 = 1 ; par2 = Do not include Seasonal Dummies ; par3 = No Linear Trend ;
Parameters (R input):
par1 = 1 ; par2 = Do not include Seasonal Dummies ; par3 = No Linear Trend ; par4 = ; par5 = ;
R code (references can be found in the software module):
library(lattice)
library(lmtest)
library(car)
library(MASS)
n25 <- 25 #minimum number of obs. for Goldfeld-Quandt test
mywarning <- ''
par1 <- as.numeric(par1)
if(is.na(par1)) {
par1 <- 1
mywarning = 'Warning: you did not specify the column number of the endogenous series! The first column was selected by default.'
}
if (par4=='') par4 <- 0
par4 <- as.numeric(par4)
if (par5=='') par5 <- 0
par5 <- as.numeric(par5)
x <- na.omit(t(y))
k <- length(x[1,])
n <- length(x[,1])
x1 <- cbind(x[,par1], x[,1:k!=par1])
mycolnames <- c(colnames(x)[par1], colnames(x)[1:k!=par1])
colnames(x1) <- mycolnames #colnames(x)[par1]
x <- x1
if (par3 == 'First Differences'){
(n <- n -1)
x2 <- array(0, dim=c(n,k), dimnames=list(1:n, paste('(1-B)',colnames(x),sep='')))
for (i in 1:n) {
for (j in 1:k) {
x2[i,j] <- x[i+1,j] - x[i,j]
}
}
x <- x2
}
if (par3 == 'Seasonal Differences (s=12)'){
(n <- n - 12)
x2 <- array(0, dim=c(n,k), dimnames=list(1:n, paste('(1-B12)',colnames(x),sep='')))
for (i in 1:n) {
for (j in 1:k) {
x2[i,j] <- x[i+12,j] - x[i,j]
}
}
x <- x2
}
if (par3 == 'First and Seasonal Differences (s=12)'){
(n <- n -1)
x2 <- array(0, dim=c(n,k), dimnames=list(1:n, paste('(1-B)',colnames(x),sep='')))
for (i in 1:n) {
for (j in 1:k) {
x2[i,j] <- x[i+1,j] - x[i,j]
}
}
x <- x2
(n <- n - 12)
x2 <- array(0, dim=c(n,k), dimnames=list(1:n, paste('(1-B12)',colnames(x),sep='')))
for (i in 1:n) {
for (j in 1:k) {
x2[i,j] <- x[i+12,j] - x[i,j]
}
}
x <- x2
}
if(par4 > 0) {
x2 <- array(0, dim=c(n-par4,par4), dimnames=list(1:(n-par4), paste(colnames(x)[par1],'(t-',1:par4,')',sep='')))
for (i in 1:(n-par4)) {
for (j in 1:par4) {
x2[i,j] <- x[i+par4-j,par1]
}
}
x <- cbind(x[(par4+1):n,], x2)
n <- n - par4
}
if(par5 > 0) {
x2 <- array(0, dim=c(n-par5*12,par5), dimnames=list(1:(n-par5*12), paste(colnames(x)[par1],'(t-',1:par5,'s)',sep='')))
for (i in 1:(n-par5*12)) {
for (j in 1:par5) {
x2[i,j] <- x[i+par5*12-j*12,par1]
}
}
x <- cbind(x[(par5*12+1):n,], x2)
n <- n - par5*12
}
if (par2 == 'Include Monthly Dummies'){
x2 <- array(0, dim=c(n,11), dimnames=list(1:n, paste('M', seq(1:11), sep ='')))
for (i in 1:11){
x2[seq(i,n,12),i] <- 1
}
x <- cbind(x, x2)
}
if (par2 == 'Include Quarterly Dummies'){
x2 <- array(0, dim=c(n,3), dimnames=list(1:n, paste('Q', seq(1:3), sep ='')))
for (i in 1:3){
x2[seq(i,n,4),i] <- 1
}
x <- cbind(x, x2)
}
(k <- length(x[n,]))
if (par3 == 'Linear Trend'){
x <- cbind(x, c(1:n))
colnames(x)[k+1] <- 't'
}
print(x)
(k <- length(x[n,]))
head(x)
df <- as.data.frame(x)
(mylm <- lm(df))
(mysum <- summary(mylm))
if (n > n25) {
kp3 <- k + 3
nmkm3 <- n - k - 3
gqarr <- array(NA, dim=c(nmkm3-kp3+1,3))
numgqtests <- 0
numsignificant1 <- 0
numsignificant5 <- 0
numsignificant10 <- 0
for (mypoint in kp3:nmkm3) {
j <- 0
numgqtests <- numgqtests + 1
for (myalt in c('greater', 'two.sided', 'less')) {
j <- j + 1
gqarr[mypoint-kp3+1,j] <- gqtest(mylm, point=mypoint, alternative=myalt)$p.value
}
if (gqarr[mypoint-kp3+1,2] < 0.01) numsignificant1 <- numsignificant1 + 1
if (gqarr[mypoint-kp3+1,2] < 0.05) numsignificant5 <- numsignificant5 + 1
if (gqarr[mypoint-kp3+1,2] < 0.10) numsignificant10 <- numsignificant10 + 1
}
gqarr
}
bitmap(file='test0.png')
plot(x[,1], type='l', main='Actuals and Interpolation', ylab='value of Actuals and Interpolation (dots)', xlab='time or index')
points(x[,1]-mysum$resid)
grid()
dev.off()
bitmap(file='test1.png')
plot(mysum$resid, type='b', pch=19, main='Residuals', ylab='value of Residuals', xlab='time or index')
grid()
dev.off()
bitmap(file='test2.png')
sresid <- studres(mylm)
hist(sresid, freq=FALSE, main='Distribution of Studentized Residuals')
xfit<-seq(min(sresid),max(sresid),length=40)
yfit<-dnorm(xfit)
lines(xfit, yfit)
grid()
dev.off()
bitmap(file='test3.png')
densityplot(~mysum$resid,col='black',main='Residual Density Plot', xlab='values of Residuals')
dev.off()
bitmap(file='test4.png')
qqPlot(mylm, main='QQ Plot')
grid()
dev.off()
(myerror <- as.ts(mysum$resid))
bitmap(file='test5.png')
dum <- cbind(lag(myerror,k=1),myerror)
dum
dum1 <- dum[2:length(myerror),]
dum1
z <- as.data.frame(dum1)
print(z)
plot(z,main=paste('Residual Lag plot, lowess, and regression line'), ylab='values of Residuals', xlab='lagged values of Residuals')
lines(lowess(z))
abline(lm(z))
grid()
dev.off()
bitmap(file='test6.png')
acf(mysum$resid, lag.max=length(mysum$resid)/2, main='Residual Autocorrelation Function')
grid()
dev.off()
bitmap(file='test7.png')
pacf(mysum$resid, lag.max=length(mysum$resid)/2, main='Residual Partial Autocorrelation Function')
grid()
dev.off()
bitmap(file='test8.png')
opar <- par(mfrow = c(2,2), oma = c(0, 0, 1.1, 0))
plot(mylm, las = 1, sub='Residual Diagnostics')
par(opar)
dev.off()
if (n > n25) {
bitmap(file='test9.png')
plot(kp3:nmkm3,gqarr[,2], main='Goldfeld-Quandt test',ylab='2-sided p-value',xlab='breakpoint')
grid()
dev.off()
}
load(file='createtable')
a<-table.start()
a<-table.row.start(a)
a<-table.element(a, 'Multiple Linear Regression - Estimated Regression Equation', 1, TRUE)
a<-table.row.end(a)
myeq <- colnames(x)[1]
myeq <- paste(myeq, '[t] = ', sep='')
for (i in 1:k){
if (mysum$coefficients[i,1] > 0) myeq <- paste(myeq, '+', '')
myeq <- paste(myeq, signif(mysum$coefficients[i,1],6), sep=' ')
if (rownames(mysum$coefficients)[i] != '(Intercept)') {
myeq <- paste(myeq, rownames(mysum$coefficients)[i], sep='')
if (rownames(mysum$coefficients)[i] != 't') myeq <- paste(myeq, '[t]', sep='')
}
}
myeq <- paste(myeq, ' + e[t]')
a<-table.row.start(a)
a<-table.element(a, myeq)
a<-table.row.end(a)
a<-table.row.start(a)
a<-table.element(a, mywarning)
a<-table.row.end(a)
a<-table.end(a)
table.save(a,file='mytable1.tab')
a<-table.start()
a<-table.row.start(a)
a<-table.element(a,'Multiple Linear Regression - Ordinary Least Squares', 6, TRUE)
a<-table.row.end(a)
a<-table.row.start(a)
a<-table.element(a,'Variable',header=TRUE)
a<-table.element(a,'Parameter',header=TRUE)
a<-table.element(a,'S.D.',header=TRUE)
a<-table.element(a,'T-STAT
H0: parameter = 0',header=TRUE)
a<-table.element(a,'2-tail p-value',header=TRUE)
a<-table.element(a,'1-tail p-value',header=TRUE)
a<-table.row.end(a)
for (i in 1:k){
a<-table.row.start(a)
a<-table.element(a,rownames(mysum$coefficients)[i],header=TRUE)
a<-table.element(a,formatC(signif(mysum$coefficients[i,1],5),format='g',flag='+'))
a<-table.element(a,formatC(signif(mysum$coefficients[i,2],5),format='g',flag=' '))
a<-table.element(a,formatC(signif(mysum$coefficients[i,3],4),format='e',flag='+'))
a<-table.element(a,formatC(signif(mysum$coefficients[i,4],4),format='g',flag=' '))
a<-table.element(a,formatC(signif(mysum$coefficients[i,4]/2,4),format='g',flag=' '))
a<-table.row.end(a)
}
a<-table.end(a)
table.save(a,file='mytable2.tab')
a<-table.start()
a<-table.row.start(a)
a<-table.element(a, 'Multiple Linear Regression - Regression Statistics', 2, TRUE)
a<-table.row.end(a)
a<-table.row.start(a)
a<-table.element(a, 'Multiple R',1,TRUE)
a<-table.element(a,formatC(signif(sqrt(mysum$r.squared),6),format='g',flag=' '))
a<-table.row.end(a)
a<-table.row.start(a)
a<-table.element(a, 'R-squared',1,TRUE)
a<-table.element(a,formatC(signif(mysum$r.squared,6),format='g',flag=' '))
a<-table.row.end(a)
a<-table.row.start(a)
a<-table.element(a, 'Adjusted R-squared',1,TRUE)
a<-table.element(a,formatC(signif(mysum$adj.r.squared,6),format='g',flag=' '))
a<-table.row.end(a)
a<-table.row.start(a)
a<-table.element(a, 'F-TEST (value)',1,TRUE)
a<-table.element(a,formatC(signif(mysum$fstatistic[1],6),format='g',flag=' '))
a<-table.row.end(a)
a<-table.row.start(a)
a<-table.element(a, 'F-TEST (DF numerator)',1,TRUE)
a<-table.element(a, signif(mysum$fstatistic[2],6))
a<-table.row.end(a)
a<-table.row.start(a)
a<-table.element(a, 'F-TEST (DF denominator)',1,TRUE)
a<-table.element(a, signif(mysum$fstatistic[3],6))
a<-table.row.end(a)
a<-table.row.start(a)
a<-table.element(a, 'p-value',1,TRUE)
a<-table.element(a,formatC(signif(1-pf(mysum$fstatistic[1],mysum$fstatistic[2],mysum$fstatistic[3]),6),format='g',flag=' '))
a<-table.row.end(a)
a<-table.row.start(a)
a<-table.element(a, 'Multiple Linear Regression - Residual Statistics', 2, TRUE)
a<-table.row.end(a)
a<-table.row.start(a)
a<-table.element(a, 'Residual Standard Deviation',1,TRUE)
a<-table.element(a,formatC(signif(mysum$sigma,6),format='g',flag=' '))
a<-table.row.end(a)
a<-table.row.start(a)
a<-table.element(a, 'Sum Squared Residuals',1,TRUE)
a<-table.element(a,formatC(signif(sum(myerror*myerror),6),format='g',flag=' '))
a<-table.row.end(a)
a<-table.end(a)
table.save(a,file='mytable3.tab')
myr <- as.numeric(mysum$resid)
myr
if(n < 200) {
a<-table.start()
a<-table.row.start(a)
a<-table.element(a, 'Multiple Linear Regression - Actuals, Interpolation, and Residuals', 4, TRUE)
a<-table.row.end(a)
a<-table.row.start(a)
a<-table.element(a, 'Time or Index', 1, TRUE)
a<-table.element(a, 'Actuals', 1, TRUE)
a<-table.element(a, 'Interpolation
Forecast', 1, TRUE)
a<-table.element(a, 'Residuals
Prediction Error', 1, TRUE)
a<-table.row.end(a)
for (i in 1:n) {
a<-table.row.start(a)
a<-table.element(a,i, 1, TRUE)
a<-table.element(a,formatC(signif(x[i],6),format='g',flag=' '))
a<-table.element(a,formatC(signif(x[i]-mysum$resid[i],6),format='g',flag=' '))
a<-table.element(a,formatC(signif(mysum$resid[i],6),format='g',flag=' '))
a<-table.row.end(a)
}
a<-table.end(a)
table.save(a,file='mytable4.tab')
if (n > n25) {
a<-table.start()
a<-table.row.start(a)
a<-table.element(a,'Goldfeld-Quandt test for Heteroskedasticity',4,TRUE)
a<-table.row.end(a)
a<-table.row.start(a)
a<-table.element(a,'p-values',header=TRUE)
a<-table.element(a,'Alternative Hypothesis',3,header=TRUE)
a<-table.row.end(a)
a<-table.row.start(a)
a<-table.element(a,'breakpoint index',header=TRUE)
a<-table.element(a,'greater',header=TRUE)
a<-table.element(a,'2-sided',header=TRUE)
a<-table.element(a,'less',header=TRUE)
a<-table.row.end(a)
for (mypoint in kp3:nmkm3) {
a<-table.row.start(a)
a<-table.element(a,mypoint,header=TRUE)
a<-table.element(a,formatC(signif(gqarr[mypoint-kp3+1,1],6),format='g',flag=' '))
a<-table.element(a,formatC(signif(gqarr[mypoint-kp3+1,2],6),format='g',flag=' '))
a<-table.element(a,formatC(signif(gqarr[mypoint-kp3+1,3],6),format='g',flag=' '))
a<-table.row.end(a)
}
a<-table.end(a)
table.save(a,file='mytable5.tab')
a<-table.start()
a<-table.row.start(a)
a<-table.element(a,'Meta Analysis of Goldfeld-Quandt test for Heteroskedasticity',4,TRUE)
a<-table.row.end(a)
a<-table.row.start(a)
a<-table.element(a,'Description',header=TRUE)
a<-table.element(a,'# significant tests',header=TRUE)
a<-table.element(a,'% significant tests',header=TRUE)
a<-table.element(a,'OK/NOK',header=TRUE)
a<-table.row.end(a)
a<-table.row.start(a)
a<-table.element(a,'1% type I error level',header=TRUE)
a<-table.element(a,signif(numsignificant1,6))
a<-table.element(a,formatC(signif(numsignificant1/numgqtests,6),format='g',flag=' '))
if (numsignificant1/numgqtests < 0.01) dum <- 'OK' else dum <- 'NOK'
a<-table.element(a,dum)
a<-table.row.end(a)
a<-table.row.start(a)
a<-table.element(a,'5% type I error level',header=TRUE)
a<-table.element(a,signif(numsignificant5,6))
a<-table.element(a,signif(numsignificant5/numgqtests,6))
if (numsignificant5/numgqtests < 0.05) dum <- 'OK' else dum <- 'NOK'
a<-table.element(a,dum)
a<-table.row.end(a)
a<-table.row.start(a)
a<-table.element(a,'10% type I error level',header=TRUE)
a<-table.element(a,signif(numsignificant10,6))
a<-table.element(a,signif(numsignificant10/numgqtests,6))
if (numsignificant10/numgqtests < 0.1) dum <- 'OK' else dum <- 'NOK'
a<-table.element(a,dum)
a<-table.row.end(a)
a<-table.end(a)
table.save(a,file='mytable6.tab')
}
}
a<-table.start()
a<-table.row.start(a)
a<-table.element(a,'Ramsey RESET F-Test for powers (2 and 3) of fitted values',1,TRUE)
a<-table.row.end(a)
a<-table.row.start(a)
reset_test_fitted <- resettest(mylm,power=2:3,type='fitted')
a<-table.element(a,paste('
',RC.texteval('reset_test_fitted'),'
',sep=''))
a<-table.row.end(a)
a<-table.row.start(a)
a<-table.element(a,'Ramsey RESET F-Test for powers (2 and 3) of regressors',1,TRUE)
a<-table.row.end(a)
a<-table.row.start(a)
reset_test_regressors <- resettest(mylm,power=2:3,type='regressor')
a<-table.element(a,paste('
',RC.texteval('reset_test_regressors'),'
',sep=''))
a<-table.row.end(a)
a<-table.row.start(a)
a<-table.element(a,'Ramsey RESET F-Test for powers (2 and 3) of principal components',1,TRUE)
a<-table.row.end(a)
a<-table.row.start(a)
reset_test_principal_components <- resettest(mylm,power=2:3,type='princomp')
a<-table.element(a,paste('
',RC.texteval('reset_test_principal_components'),'
',sep=''))
a<-table.row.end(a)
a<-table.end(a)
table.save(a,file='mytable8.tab')
a<-table.start()
a<-table.row.start(a)
a<-table.element(a,'Variance Inflation Factors (Multicollinearity)',1,TRUE)
a<-table.row.end(a)
a<-table.row.start(a)
vif <- vif(mylm)
a<-table.element(a,paste('
',RC.texteval('vif'),'
',sep=''))
a<-table.row.end(a)
a<-table.end(a)
table.save(a,file='mytable9.tab')