Free Statistics

of Irreproducible Research!

Author's title

Author*The author of this computation has been verified*
R Software Modulerwasp_arimabackwardselection.wasp
Title produced by softwareARIMA Backward Selection
Date of computationWed, 14 Dec 2016 13:32:02 +0100
Cite this page as followsStatistical Computations at FreeStatistics.org, Office for Research Development and Education, URL https://freestatistics.org/blog/index.php?v=date/2016/Dec/14/t1481718821rgxsom84e6a5fcz.htm/, Retrieved Fri, 03 May 2024 18:45:15 +0000
Statistical Computations at FreeStatistics.org, Office for Research Development and Education, URL https://freestatistics.org/blog/index.php?pk=299360, Retrieved Fri, 03 May 2024 18:45:15 +0000
QR Codes:

Original text written by user:
IsPrivate?No (this computation is public)
User-defined keywords
Estimated Impact77
Family? (F = Feedback message, R = changed R code, M = changed R Module, P = changed Parameters, D = changed Data)
-       [ARIMA Backward Selection] [ARIMA Backward Se...] [2016-12-14 12:32:02] [f916b4255bf1e1993d1067800ff1f972] [Current]
Feedback Forum

Post a new message
Dataseries X:
5033
4509.5
3970
3378
2866
2315.5
1895
8401.5
8040
7534
7135.5
6466.5
5661.5
4896
4064.5
3296
2593.5
2007
1513.5
6645
6221.5
5474
5135.5
4630.5
4164
3600.5
2969
2503.5
2054.5
1608.5
1297.5
8485
8163.5
7814
7453.5
6888.5
6283.5
5712
5030
4488
4058.5
3585
3199.5
8181
8219.5
7865.5
7516.5
7116
6615.5
6216.5
5699.5
5179
4727.5
4224.5
3780.5
7023.5
6558
6257.5
5862.5
5343
4756
4173.5
3451.5
2849
2351
1887.5
1416.5
7399
7013
6644.5
6238.5
5721
5137.5
4357
3750.5
3324
2861
2455.5
2027.5
8388.5
7910
7686
7163
6841.5
6448.5
6060.5
5739
5362.5
5081
4764
4522.5
9056.5
8352
7683
7319.5
6708
6204.5
5576.5
4776.5
4279.5
3918
3288.5
2393.5
8131.5
8121
7790.5
7411.5
6861
6197
5622.5
4855.5
4303.5
3853.5
3283.5
2861.5
9486.5
9061
8877.5
8557.5
8031
7404.5
6852.5
6174.5
5341.5
4975.5
4290


Summary of computational transaction
Raw Input view raw input (R code)
Raw Outputview raw output of R engine
Computing time4 seconds
R ServerBig Analytics Cloud Computing Center

\begin{tabular}{lllllllll}
\hline
Summary of computational transaction \tabularnewline
Raw Input view raw input (R code)  \tabularnewline
Raw Outputview raw output of R engine  \tabularnewline
Computing time4 seconds \tabularnewline
R ServerBig Analytics Cloud Computing Center \tabularnewline
\hline
\end{tabular}
%Source: https://freestatistics.org/blog/index.php?pk=299360&T=0

[TABLE]
[ROW]
Summary of computational transaction[/C][/ROW] [ROW]Raw Input[/C] view raw input (R code) [/C][/ROW] [ROW]Raw Output[/C]view raw output of R engine [/C][/ROW] [ROW]Computing time[/C]4 seconds[/C][/ROW] [ROW]R Server[/C]Big Analytics Cloud Computing Center[/C][/ROW] [/TABLE] Source: https://freestatistics.org/blog/index.php?pk=299360&T=0

Globally Unique Identifier (entire table): ba.freestatistics.org/blog/index.php?pk=299360&T=0

As an alternative you can also use a QR Code:  

The GUIDs for individual cells are displayed in the table below:

Summary of computational transaction
Raw Input view raw input (R code)
Raw Outputview raw output of R engine
Computing time4 seconds
R ServerBig Analytics Cloud Computing Center


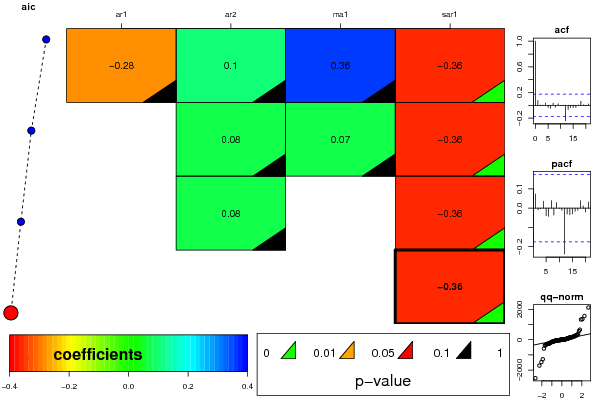
ARIMA Parameter Estimation and Backward Selection
Iterationar1ar2ma1sar1
Estimates ( 1 )-0.28340.09770.3593-0.3562
(p-val)(0.7627 )(0.3491 )(0.7026 )(1e-04 )
Estimates ( 2 )00.07790.0742-0.356
(p-val)(NA )(0.4062 )(0.4307 )(1e-04 )
Estimates ( 3 )00.07720-0.3582
(p-val)(NA )(0.4089 )(NA )(1e-04 )
Estimates ( 4 )000-0.3604
(p-val)(NA )(NA )(NA )(1e-04 )
Estimates ( 5 )NANANANA
(p-val)(NA )(NA )(NA )(NA )
Estimates ( 6 )NANANANA
(p-val)(NA )(NA )(NA )(NA )
Estimates ( 7 )NANANANA
(p-val)(NA )(NA )(NA )(NA )

\begin{tabular}{lllllllll}
\hline
ARIMA Parameter Estimation and Backward Selection \tabularnewline
Iteration & ar1 & ar2 & ma1 & sar1 \tabularnewline
Estimates ( 1 ) & -0.2834 & 0.0977 & 0.3593 & -0.3562 \tabularnewline
(p-val) & (0.7627 ) & (0.3491 ) & (0.7026 ) & (1e-04 ) \tabularnewline
Estimates ( 2 ) & 0 & 0.0779 & 0.0742 & -0.356 \tabularnewline
(p-val) & (NA ) & (0.4062 ) & (0.4307 ) & (1e-04 ) \tabularnewline
Estimates ( 3 ) & 0 & 0.0772 & 0 & -0.3582 \tabularnewline
(p-val) & (NA ) & (0.4089 ) & (NA ) & (1e-04 ) \tabularnewline
Estimates ( 4 ) & 0 & 0 & 0 & -0.3604 \tabularnewline
(p-val) & (NA ) & (NA ) & (NA ) & (1e-04 ) \tabularnewline
Estimates ( 5 ) & NA & NA & NA & NA \tabularnewline
(p-val) & (NA ) & (NA ) & (NA ) & (NA ) \tabularnewline
Estimates ( 6 ) & NA & NA & NA & NA \tabularnewline
(p-val) & (NA ) & (NA ) & (NA ) & (NA ) \tabularnewline
Estimates ( 7 ) & NA & NA & NA & NA \tabularnewline
(p-val) & (NA ) & (NA ) & (NA ) & (NA ) \tabularnewline
\hline
\end{tabular}
%Source: https://freestatistics.org/blog/index.php?pk=299360&T=1

[TABLE]
[ROW][C]ARIMA Parameter Estimation and Backward Selection[/C][/ROW]
[ROW][C]Iteration[/C][C]ar1[/C][C]ar2[/C][C]ma1[/C][C]sar1[/C][/ROW]
[ROW][C]Estimates ( 1 )[/C][C]-0.2834[/C][C]0.0977[/C][C]0.3593[/C][C]-0.3562[/C][/ROW]
[ROW][C](p-val)[/C][C](0.7627 )[/C][C](0.3491 )[/C][C](0.7026 )[/C][C](1e-04 )[/C][/ROW]
[ROW][C]Estimates ( 2 )[/C][C]0[/C][C]0.0779[/C][C]0.0742[/C][C]-0.356[/C][/ROW]
[ROW][C](p-val)[/C][C](NA )[/C][C](0.4062 )[/C][C](0.4307 )[/C][C](1e-04 )[/C][/ROW]
[ROW][C]Estimates ( 3 )[/C][C]0[/C][C]0.0772[/C][C]0[/C][C]-0.3582[/C][/ROW]
[ROW][C](p-val)[/C][C](NA )[/C][C](0.4089 )[/C][C](NA )[/C][C](1e-04 )[/C][/ROW]
[ROW][C]Estimates ( 4 )[/C][C]0[/C][C]0[/C][C]0[/C][C]-0.3604[/C][/ROW]
[ROW][C](p-val)[/C][C](NA )[/C][C](NA )[/C][C](NA )[/C][C](1e-04 )[/C][/ROW]
[ROW][C]Estimates ( 5 )[/C][C]NA[/C][C]NA[/C][C]NA[/C][C]NA[/C][/ROW]
[ROW][C](p-val)[/C][C](NA )[/C][C](NA )[/C][C](NA )[/C][C](NA )[/C][/ROW]
[ROW][C]Estimates ( 6 )[/C][C]NA[/C][C]NA[/C][C]NA[/C][C]NA[/C][/ROW]
[ROW][C](p-val)[/C][C](NA )[/C][C](NA )[/C][C](NA )[/C][C](NA )[/C][/ROW]
[ROW][C]Estimates ( 7 )[/C][C]NA[/C][C]NA[/C][C]NA[/C][C]NA[/C][/ROW]
[ROW][C](p-val)[/C][C](NA )[/C][C](NA )[/C][C](NA )[/C][C](NA )[/C][/ROW]
[/TABLE]
Source: https://freestatistics.org/blog/index.php?pk=299360&T=1

Globally Unique Identifier (entire table): ba.freestatistics.org/blog/index.php?pk=299360&T=1

As an alternative you can also use a QR Code:  

The GUIDs for individual cells are displayed in the table below:

ARIMA Parameter Estimation and Backward Selection
Iterationar1ar2ma1sar1
Estimates ( 1 )-0.28340.09770.3593-0.3562
(p-val)(0.7627 )(0.3491 )(0.7026 )(1e-04 )
Estimates ( 2 )00.07790.0742-0.356
(p-val)(NA )(0.4062 )(0.4307 )(1e-04 )
Estimates ( 3 )00.07720-0.3582
(p-val)(NA )(0.4089 )(NA )(1e-04 )
Estimates ( 4 )000-0.3604
(p-val)(NA )(NA )(NA )(1e-04 )
Estimates ( 5 )NANANANA
(p-val)(NA )(NA )(NA )(NA )
Estimates ( 6 )NANANANA
(p-val)(NA )(NA )(NA )(NA )
Estimates ( 7 )NANANANA
(p-val)(NA )(NA )(NA )(NA )


Estimated ARIMA Residuals
Value
-16.1048244002728
-225.267359174633
-271.811127933422
-147.356511998527
-156.825661220673
-20.9045260263531
-54.4419765052849
-1281.21492819247
-52.6862050052266
-126.887941993105
59.8860891335897
164.338008956646
304.315416488921
104.684475690962
73.1302405875095
230.876641652616
177.898552051346
109.097626627755
142.051808619642
1553.62163569764
67.7235321069938
190.818360826357
-6.66646759247977
-25.297172150506
-17.2090535640617
64.4538698447968
22.4719172221429
27.0681807515576
108.67276050353
20.3548914865219
-17.6417217042854
-1471.29634585302
397.241251018334
251.490004718824
-26.9869267725071
132.351358719011
54.609498450206
158.5963992939
142.674177322885
-18.9956692522001
-26.3542606806432
-38.8950014278016
-84.0272041561489
-2525.65879789172
-368.471839545251
247.064036559676
-12.9328863610044
-64.0805412674245
-45.8352405104933
-117.073064537745
-142.109219596486
-64.9045196272337
-43.1195318140399
34.6677056766312
-43.7575564815379
2114.53072389515
-97.3329950848283
-212.217338383114
-19.6790634742656
-36.8567806156661
-25.363745698065
-260.594562281521
44.1897440453204
166.983214589131
15.0965331657826
60.8316753219324
31.9126793669198
1354.22862602666
-66.5952954864906
15.1870079324226
-115.998667054526
187.443300451257
201.088413296412
306.392342465513
311.572058749857
88.2231044666605
168.846238139732
100.550563534028
186.926090871363
-1699.85451290964
-274.717533621364
-262.688361602518
137.591329040479
-189.440215013249
-51.3384432479606
-82.4407472849935
-373.150123026633
-94.9173052707611
14.0670162485903
-272.880687011962
-585.538424549459
571.236237983456
658.329823743097
136.681919684219
-5.68421527600094
-56.7026015628653
-203.294892805393
-29.1591619818037
-122.957014732293
-95.6573927512827
-106.473909660169
-44.8617790859175
247.956908379286
1322.32397191265
-184.847505551405
166.501334549313
66.2918839424074
25.1455322652137
-24.1169401055931
38.1249301896241
102.363742499543
-303.916972338098
44.517237240254
-70.9774682850139

\begin{tabular}{lllllllll}
\hline
Estimated ARIMA Residuals \tabularnewline
Value \tabularnewline
-16.1048244002728 \tabularnewline
-225.267359174633 \tabularnewline
-271.811127933422 \tabularnewline
-147.356511998527 \tabularnewline
-156.825661220673 \tabularnewline
-20.9045260263531 \tabularnewline
-54.4419765052849 \tabularnewline
-1281.21492819247 \tabularnewline
-52.6862050052266 \tabularnewline
-126.887941993105 \tabularnewline
59.8860891335897 \tabularnewline
164.338008956646 \tabularnewline
304.315416488921 \tabularnewline
104.684475690962 \tabularnewline
73.1302405875095 \tabularnewline
230.876641652616 \tabularnewline
177.898552051346 \tabularnewline
109.097626627755 \tabularnewline
142.051808619642 \tabularnewline
1553.62163569764 \tabularnewline
67.7235321069938 \tabularnewline
190.818360826357 \tabularnewline
-6.66646759247977 \tabularnewline
-25.297172150506 \tabularnewline
-17.2090535640617 \tabularnewline
64.4538698447968 \tabularnewline
22.4719172221429 \tabularnewline
27.0681807515576 \tabularnewline
108.67276050353 \tabularnewline
20.3548914865219 \tabularnewline
-17.6417217042854 \tabularnewline
-1471.29634585302 \tabularnewline
397.241251018334 \tabularnewline
251.490004718824 \tabularnewline
-26.9869267725071 \tabularnewline
132.351358719011 \tabularnewline
54.609498450206 \tabularnewline
158.5963992939 \tabularnewline
142.674177322885 \tabularnewline
-18.9956692522001 \tabularnewline
-26.3542606806432 \tabularnewline
-38.8950014278016 \tabularnewline
-84.0272041561489 \tabularnewline
-2525.65879789172 \tabularnewline
-368.471839545251 \tabularnewline
247.064036559676 \tabularnewline
-12.9328863610044 \tabularnewline
-64.0805412674245 \tabularnewline
-45.8352405104933 \tabularnewline
-117.073064537745 \tabularnewline
-142.109219596486 \tabularnewline
-64.9045196272337 \tabularnewline
-43.1195318140399 \tabularnewline
34.6677056766312 \tabularnewline
-43.7575564815379 \tabularnewline
2114.53072389515 \tabularnewline
-97.3329950848283 \tabularnewline
-212.217338383114 \tabularnewline
-19.6790634742656 \tabularnewline
-36.8567806156661 \tabularnewline
-25.363745698065 \tabularnewline
-260.594562281521 \tabularnewline
44.1897440453204 \tabularnewline
166.983214589131 \tabularnewline
15.0965331657826 \tabularnewline
60.8316753219324 \tabularnewline
31.9126793669198 \tabularnewline
1354.22862602666 \tabularnewline
-66.5952954864906 \tabularnewline
15.1870079324226 \tabularnewline
-115.998667054526 \tabularnewline
187.443300451257 \tabularnewline
201.088413296412 \tabularnewline
306.392342465513 \tabularnewline
311.572058749857 \tabularnewline
88.2231044666605 \tabularnewline
168.846238139732 \tabularnewline
100.550563534028 \tabularnewline
186.926090871363 \tabularnewline
-1699.85451290964 \tabularnewline
-274.717533621364 \tabularnewline
-262.688361602518 \tabularnewline
137.591329040479 \tabularnewline
-189.440215013249 \tabularnewline
-51.3384432479606 \tabularnewline
-82.4407472849935 \tabularnewline
-373.150123026633 \tabularnewline
-94.9173052707611 \tabularnewline
14.0670162485903 \tabularnewline
-272.880687011962 \tabularnewline
-585.538424549459 \tabularnewline
571.236237983456 \tabularnewline
658.329823743097 \tabularnewline
136.681919684219 \tabularnewline
-5.68421527600094 \tabularnewline
-56.7026015628653 \tabularnewline
-203.294892805393 \tabularnewline
-29.1591619818037 \tabularnewline
-122.957014732293 \tabularnewline
-95.6573927512827 \tabularnewline
-106.473909660169 \tabularnewline
-44.8617790859175 \tabularnewline
247.956908379286 \tabularnewline
1322.32397191265 \tabularnewline
-184.847505551405 \tabularnewline
166.501334549313 \tabularnewline
66.2918839424074 \tabularnewline
25.1455322652137 \tabularnewline
-24.1169401055931 \tabularnewline
38.1249301896241 \tabularnewline
102.363742499543 \tabularnewline
-303.916972338098 \tabularnewline
44.517237240254 \tabularnewline
-70.9774682850139 \tabularnewline
\hline
\end{tabular}
%Source: https://freestatistics.org/blog/index.php?pk=299360&T=2

[TABLE]
[ROW][C]Estimated ARIMA Residuals[/C][/ROW]
[ROW][C]Value[/C][/ROW]
[ROW][C]-16.1048244002728[/C][/ROW]
[ROW][C]-225.267359174633[/C][/ROW]
[ROW][C]-271.811127933422[/C][/ROW]
[ROW][C]-147.356511998527[/C][/ROW]
[ROW][C]-156.825661220673[/C][/ROW]
[ROW][C]-20.9045260263531[/C][/ROW]
[ROW][C]-54.4419765052849[/C][/ROW]
[ROW][C]-1281.21492819247[/C][/ROW]
[ROW][C]-52.6862050052266[/C][/ROW]
[ROW][C]-126.887941993105[/C][/ROW]
[ROW][C]59.8860891335897[/C][/ROW]
[ROW][C]164.338008956646[/C][/ROW]
[ROW][C]304.315416488921[/C][/ROW]
[ROW][C]104.684475690962[/C][/ROW]
[ROW][C]73.1302405875095[/C][/ROW]
[ROW][C]230.876641652616[/C][/ROW]
[ROW][C]177.898552051346[/C][/ROW]
[ROW][C]109.097626627755[/C][/ROW]
[ROW][C]142.051808619642[/C][/ROW]
[ROW][C]1553.62163569764[/C][/ROW]
[ROW][C]67.7235321069938[/C][/ROW]
[ROW][C]190.818360826357[/C][/ROW]
[ROW][C]-6.66646759247977[/C][/ROW]
[ROW][C]-25.297172150506[/C][/ROW]
[ROW][C]-17.2090535640617[/C][/ROW]
[ROW][C]64.4538698447968[/C][/ROW]
[ROW][C]22.4719172221429[/C][/ROW]
[ROW][C]27.0681807515576[/C][/ROW]
[ROW][C]108.67276050353[/C][/ROW]
[ROW][C]20.3548914865219[/C][/ROW]
[ROW][C]-17.6417217042854[/C][/ROW]
[ROW][C]-1471.29634585302[/C][/ROW]
[ROW][C]397.241251018334[/C][/ROW]
[ROW][C]251.490004718824[/C][/ROW]
[ROW][C]-26.9869267725071[/C][/ROW]
[ROW][C]132.351358719011[/C][/ROW]
[ROW][C]54.609498450206[/C][/ROW]
[ROW][C]158.5963992939[/C][/ROW]
[ROW][C]142.674177322885[/C][/ROW]
[ROW][C]-18.9956692522001[/C][/ROW]
[ROW][C]-26.3542606806432[/C][/ROW]
[ROW][C]-38.8950014278016[/C][/ROW]
[ROW][C]-84.0272041561489[/C][/ROW]
[ROW][C]-2525.65879789172[/C][/ROW]
[ROW][C]-368.471839545251[/C][/ROW]
[ROW][C]247.064036559676[/C][/ROW]
[ROW][C]-12.9328863610044[/C][/ROW]
[ROW][C]-64.0805412674245[/C][/ROW]
[ROW][C]-45.8352405104933[/C][/ROW]
[ROW][C]-117.073064537745[/C][/ROW]
[ROW][C]-142.109219596486[/C][/ROW]
[ROW][C]-64.9045196272337[/C][/ROW]
[ROW][C]-43.1195318140399[/C][/ROW]
[ROW][C]34.6677056766312[/C][/ROW]
[ROW][C]-43.7575564815379[/C][/ROW]
[ROW][C]2114.53072389515[/C][/ROW]
[ROW][C]-97.3329950848283[/C][/ROW]
[ROW][C]-212.217338383114[/C][/ROW]
[ROW][C]-19.6790634742656[/C][/ROW]
[ROW][C]-36.8567806156661[/C][/ROW]
[ROW][C]-25.363745698065[/C][/ROW]
[ROW][C]-260.594562281521[/C][/ROW]
[ROW][C]44.1897440453204[/C][/ROW]
[ROW][C]166.983214589131[/C][/ROW]
[ROW][C]15.0965331657826[/C][/ROW]
[ROW][C]60.8316753219324[/C][/ROW]
[ROW][C]31.9126793669198[/C][/ROW]
[ROW][C]1354.22862602666[/C][/ROW]
[ROW][C]-66.5952954864906[/C][/ROW]
[ROW][C]15.1870079324226[/C][/ROW]
[ROW][C]-115.998667054526[/C][/ROW]
[ROW][C]187.443300451257[/C][/ROW]
[ROW][C]201.088413296412[/C][/ROW]
[ROW][C]306.392342465513[/C][/ROW]
[ROW][C]311.572058749857[/C][/ROW]
[ROW][C]88.2231044666605[/C][/ROW]
[ROW][C]168.846238139732[/C][/ROW]
[ROW][C]100.550563534028[/C][/ROW]
[ROW][C]186.926090871363[/C][/ROW]
[ROW][C]-1699.85451290964[/C][/ROW]
[ROW][C]-274.717533621364[/C][/ROW]
[ROW][C]-262.688361602518[/C][/ROW]
[ROW][C]137.591329040479[/C][/ROW]
[ROW][C]-189.440215013249[/C][/ROW]
[ROW][C]-51.3384432479606[/C][/ROW]
[ROW][C]-82.4407472849935[/C][/ROW]
[ROW][C]-373.150123026633[/C][/ROW]
[ROW][C]-94.9173052707611[/C][/ROW]
[ROW][C]14.0670162485903[/C][/ROW]
[ROW][C]-272.880687011962[/C][/ROW]
[ROW][C]-585.538424549459[/C][/ROW]
[ROW][C]571.236237983456[/C][/ROW]
[ROW][C]658.329823743097[/C][/ROW]
[ROW][C]136.681919684219[/C][/ROW]
[ROW][C]-5.68421527600094[/C][/ROW]
[ROW][C]-56.7026015628653[/C][/ROW]
[ROW][C]-203.294892805393[/C][/ROW]
[ROW][C]-29.1591619818037[/C][/ROW]
[ROW][C]-122.957014732293[/C][/ROW]
[ROW][C]-95.6573927512827[/C][/ROW]
[ROW][C]-106.473909660169[/C][/ROW]
[ROW][C]-44.8617790859175[/C][/ROW]
[ROW][C]247.956908379286[/C][/ROW]
[ROW][C]1322.32397191265[/C][/ROW]
[ROW][C]-184.847505551405[/C][/ROW]
[ROW][C]166.501334549313[/C][/ROW]
[ROW][C]66.2918839424074[/C][/ROW]
[ROW][C]25.1455322652137[/C][/ROW]
[ROW][C]-24.1169401055931[/C][/ROW]
[ROW][C]38.1249301896241[/C][/ROW]
[ROW][C]102.363742499543[/C][/ROW]
[ROW][C]-303.916972338098[/C][/ROW]
[ROW][C]44.517237240254[/C][/ROW]
[ROW][C]-70.9774682850139[/C][/ROW]
[/TABLE]
Source: https://freestatistics.org/blog/index.php?pk=299360&T=2

Globally Unique Identifier (entire table): ba.freestatistics.org/blog/index.php?pk=299360&T=2

As an alternative you can also use a QR Code:  

The GUIDs for individual cells are displayed in the table below:

Estimated ARIMA Residuals
Value
-16.1048244002728
-225.267359174633
-271.811127933422
-147.356511998527
-156.825661220673
-20.9045260263531
-54.4419765052849
-1281.21492819247
-52.6862050052266
-126.887941993105
59.8860891335897
164.338008956646
304.315416488921
104.684475690962
73.1302405875095
230.876641652616
177.898552051346
109.097626627755
142.051808619642
1553.62163569764
67.7235321069938
190.818360826357
-6.66646759247977
-25.297172150506
-17.2090535640617
64.4538698447968
22.4719172221429
27.0681807515576
108.67276050353
20.3548914865219
-17.6417217042854
-1471.29634585302
397.241251018334
251.490004718824
-26.9869267725071
132.351358719011
54.609498450206
158.5963992939
142.674177322885
-18.9956692522001
-26.3542606806432
-38.8950014278016
-84.0272041561489
-2525.65879789172
-368.471839545251
247.064036559676
-12.9328863610044
-64.0805412674245
-45.8352405104933
-117.073064537745
-142.109219596486
-64.9045196272337
-43.1195318140399
34.6677056766312
-43.7575564815379
2114.53072389515
-97.3329950848283
-212.217338383114
-19.6790634742656
-36.8567806156661
-25.363745698065
-260.594562281521
44.1897440453204
166.983214589131
15.0965331657826
60.8316753219324
31.9126793669198
1354.22862602666
-66.5952954864906
15.1870079324226
-115.998667054526
187.443300451257
201.088413296412
306.392342465513
311.572058749857
88.2231044666605
168.846238139732
100.550563534028
186.926090871363
-1699.85451290964
-274.717533621364
-262.688361602518
137.591329040479
-189.440215013249
-51.3384432479606
-82.4407472849935
-373.150123026633
-94.9173052707611
14.0670162485903
-272.880687011962
-585.538424549459
571.236237983456
658.329823743097
136.681919684219
-5.68421527600094
-56.7026015628653
-203.294892805393
-29.1591619818037
-122.957014732293
-95.6573927512827
-106.473909660169
-44.8617790859175
247.956908379286
1322.32397191265
-184.847505551405
166.501334549313
66.2918839424074
25.1455322652137
-24.1169401055931
38.1249301896241
102.363742499543
-303.916972338098
44.517237240254
-70.9774682850139


Parameters (Session):
par1 = FALSE ; par2 = 1 ; par3 = 1 ; par4 = 1 ; par5 = 12 ; par6 = 2 ; par7 = 1 ; par8 = 1 ; par9 = 0 ;
Parameters (R input):
par1 = FALSE ; par2 = 1 ; par3 = 1 ; par4 = 1 ; par5 = 12 ; par6 = 2 ; par7 = 1 ; par8 = 1 ; par9 = 0 ;
R code (references can be found in the software module):
par9 <- '0'
par8 <- '1'
par7 <- '1'
par6 <- '2'
par5 <- '12'
par4 <- '1'
par3 <- '1'
par2 <- '1'
par1 <- 'FALSE'
library(lattice)
if (par1 == 'TRUE') par1 <- TRUE
if (par1 == 'FALSE') par1 <- FALSE
par2 <- as.numeric(par2) #Box-Cox lambda transformation parameter
par3 <- as.numeric(par3) #degree of non-seasonal differencing
par4 <- as.numeric(par4) #degree of seasonal differencing
par5 <- as.numeric(par5) #seasonal period
par6 <- as.numeric(par6) #degree (p) of the non-seasonal AR(p) polynomial
par7 <- as.numeric(par7) #degree (q) of the non-seasonal MA(q) polynomial
par8 <- as.numeric(par8) #degree (P) of the seasonal AR(P) polynomial
par9 <- as.numeric(par9) #degree (Q) of the seasonal MA(Q) polynomial
armaGR <- function(arima.out, names, n){
try1 <- arima.out$coef
try2 <- sqrt(diag(arima.out$var.coef))
try.data.frame <- data.frame(matrix(NA,ncol=4,nrow=length(names)))
dimnames(try.data.frame) <- list(names,c('coef','std','tstat','pv'))
try.data.frame[,1] <- try1
for(i in 1:length(try2)) try.data.frame[which(rownames(try.data.frame)==names(try2)[i]),2] <- try2[i]
try.data.frame[,3] <- try.data.frame[,1] / try.data.frame[,2]
try.data.frame[,4] <- round((1-pt(abs(try.data.frame[,3]),df=n-(length(try2)+1)))*2,5)
vector <- rep(NA,length(names))
vector[is.na(try.data.frame[,4])] <- 0
maxi <- which.max(try.data.frame[,4])
continue <- max(try.data.frame[,4],na.rm=TRUE) > .05
vector[maxi] <- 0
list(summary=try.data.frame,next.vector=vector,continue=continue)
}
arimaSelect <- function(series, order=c(13,0,0), seasonal=list(order=c(2,0,0),period=12), include.mean=F){
nrc <- order[1]+order[3]+seasonal$order[1]+seasonal$order[3]
coeff <- matrix(NA, nrow=nrc*2, ncol=nrc)
pval <- matrix(NA, nrow=nrc*2, ncol=nrc)
mylist <- rep(list(NULL), nrc)
names <- NULL
if(order[1] > 0) names <- paste('ar',1:order[1],sep='')
if(order[3] > 0) names <- c( names , paste('ma',1:order[3],sep='') )
if(seasonal$order[1] > 0) names <- c(names, paste('sar',1:seasonal$order[1],sep=''))
if(seasonal$order[3] > 0) names <- c(names, paste('sma',1:seasonal$order[3],sep=''))
arima.out <- arima(series, order=order, seasonal=seasonal, include.mean=include.mean, method='ML')
mylist[[1]] <- arima.out
last.arma <- armaGR(arima.out, names, length(series))
mystop <- FALSE
i <- 1
coeff[i,] <- last.arma[[1]][,1]
pval [i,] <- last.arma[[1]][,4]
i <- 2
aic <- arima.out$aic
while(!mystop){
mylist[[i]] <- arima.out
arima.out <- arima(series, order=order, seasonal=seasonal, include.mean=include.mean, method='ML', fixed=last.arma$next.vector)
aic <- c(aic, arima.out$aic)
last.arma <- armaGR(arima.out, names, length(series))
mystop <- !last.arma$continue
coeff[i,] <- last.arma[[1]][,1]
pval [i,] <- last.arma[[1]][,4]
i <- i+1
}
list(coeff, pval, mylist, aic=aic)
}
arimaSelectplot <- function(arimaSelect.out,noms,choix){
noms <- names(arimaSelect.out[[3]][[1]]$coef)
coeff <- arimaSelect.out[[1]]
k <- min(which(is.na(coeff[,1])))-1
coeff <- coeff[1:k,]
pval <- arimaSelect.out[[2]][1:k,]
aic <- arimaSelect.out$aic[1:k]
coeff[coeff==0] <- NA
n <- ncol(coeff)
if(missing(choix)) choix <- k
layout(matrix(c(1,1,1,2,
3,3,3,2,
3,3,3,4,
5,6,7,7),nr=4),
widths=c(10,35,45,15),
heights=c(30,30,15,15))
couleurs <- rainbow(75)[1:50]#(50)
ticks <- pretty(coeff)
par(mar=c(1,1,3,1))
plot(aic,k:1-.5,type='o',pch=21,bg='blue',cex=2,axes=F,lty=2,xpd=NA)
points(aic[choix],k-choix+.5,pch=21,cex=4,bg=2,xpd=NA)
title('aic',line=2)
par(mar=c(3,0,0,0))
plot(0,axes=F,xlab='',ylab='',xlim=range(ticks),ylim=c(.1,1))
rect(xleft = min(ticks) + (0:49)/50*(max(ticks)-min(ticks)),
xright = min(ticks) + (1:50)/50*(max(ticks)-min(ticks)),
ytop = rep(1,50),
ybottom= rep(0,50),col=couleurs,border=NA)
axis(1,ticks)
rect(xleft=min(ticks),xright=max(ticks),ytop=1,ybottom=0)
text(mean(coeff,na.rm=T),.5,'coefficients',cex=2,font=2)
par(mar=c(1,1,3,1))
image(1:n,1:k,t(coeff[k:1,]),axes=F,col=couleurs,zlim=range(ticks))
for(i in 1:n) for(j in 1:k) if(!is.na(coeff[j,i])) {
if(pval[j,i]<.01) symb = 'green'
else if( (pval[j,i]<.05) & (pval[j,i]>=.01)) symb = 'orange'
else if( (pval[j,i]<.1) & (pval[j,i]>=.05)) symb = 'red'
else symb = 'black'
polygon(c(i+.5 ,i+.2 ,i+.5 ,i+.5),
c(k-j+0.5,k-j+0.5,k-j+0.8,k-j+0.5),
col=symb)
if(j==choix) {
rect(xleft=i-.5,
xright=i+.5,
ybottom=k-j+1.5,
ytop=k-j+.5,
lwd=4)
text(i,
k-j+1,
round(coeff[j,i],2),
cex=1.2,
font=2)
}
else{
rect(xleft=i-.5,xright=i+.5,ybottom=k-j+1.5,ytop=k-j+.5)
text(i,k-j+1,round(coeff[j,i],2),cex=1.2,font=1)
}
}
axis(3,1:n,noms)
par(mar=c(0.5,0,0,0.5))
plot(0,axes=F,xlab='',ylab='',type='n',xlim=c(0,8),ylim=c(-.2,.8))
cols <- c('green','orange','red','black')
niv <- c('0','0.01','0.05','0.1')
for(i in 0:3){
polygon(c(1+2*i ,1+2*i ,1+2*i-.5 ,1+2*i),
c(.4 ,.7 , .4 , .4),
col=cols[i+1])
text(2*i,0.5,niv[i+1],cex=1.5)
}
text(8,.5,1,cex=1.5)
text(4,0,'p-value',cex=2)
box()
residus <- arimaSelect.out[[3]][[choix]]$res
par(mar=c(1,2,4,1))
acf(residus,main='')
title('acf',line=.5)
par(mar=c(1,2,4,1))
pacf(residus,main='')
title('pacf',line=.5)
par(mar=c(2,2,4,1))
qqnorm(residus,main='')
title('qq-norm',line=.5)
qqline(residus)
residus
}
if (par2 == 0) x <- log(x)
if (par2 != 0) x <- x^par2
(selection <- arimaSelect(x, order=c(par6,par3,par7), seasonal=list(order=c(par8,par4,par9), period=par5)))
bitmap(file='test1.png')
resid <- arimaSelectplot(selection)
dev.off()
resid
bitmap(file='test2.png')
acf(resid,length(resid)/2, main='Residual Autocorrelation Function')
dev.off()
bitmap(file='test3.png')
pacf(resid,length(resid)/2, main='Residual Partial Autocorrelation Function')
dev.off()
bitmap(file='test4.png')
cpgram(resid, main='Residual Cumulative Periodogram')
dev.off()
bitmap(file='test5.png')
hist(resid, main='Residual Histogram', xlab='values of Residuals')
dev.off()
bitmap(file='test6.png')
densityplot(~resid,col='black',main='Residual Density Plot', xlab='values of Residuals')
dev.off()
bitmap(file='test7.png')
qqnorm(resid, main='Residual Normal Q-Q Plot')
qqline(resid)
dev.off()
ncols <- length(selection[[1]][1,])
nrows <- length(selection[[2]][,1])-1
load(file='createtable')
a<-table.start()
a<-table.row.start(a)
a<-table.element(a,'ARIMA Parameter Estimation and Backward Selection', ncols+1,TRUE)
a<-table.row.end(a)
a<-table.row.start(a)
a<-table.element(a,'Iteration', header=TRUE)
for (i in 1:ncols) {
a<-table.element(a,names(selection[[3]][[1]]$coef)[i],header=TRUE)
}
a<-table.row.end(a)
for (j in 1:nrows) {
a<-table.row.start(a)
mydum <- 'Estimates ('
mydum <- paste(mydum,j)
mydum <- paste(mydum,')')
a<-table.element(a,mydum, header=TRUE)
for (i in 1:ncols) {
a<-table.element(a,round(selection[[1]][j,i],4))
}
a<-table.row.end(a)
a<-table.row.start(a)
a<-table.element(a,'(p-val)', header=TRUE)
for (i in 1:ncols) {
mydum <- '('
mydum <- paste(mydum,round(selection[[2]][j,i],4),sep='')
mydum <- paste(mydum,')')
a<-table.element(a,mydum)
}
a<-table.row.end(a)
}
a<-table.end(a)
table.save(a,file='mytable.tab')
a<-table.start()
a<-table.row.start(a)
a<-table.element(a,'Estimated ARIMA Residuals', 1,TRUE)
a<-table.row.end(a)
a<-table.row.start(a)
a<-table.element(a,'Value', 1,TRUE)
a<-table.row.end(a)
for (i in (par4*par5+par3):length(resid)) {
a<-table.row.start(a)
a<-table.element(a,resid[i])
a<-table.row.end(a)
}
a<-table.end(a)
table.save(a,file='mytable1.tab')